Batch and Equilibrium Studies on Cr6+ Adsorption Using Fe3O4 nanoparticle: Isothermal, Kinetic, and Thermodynamic Evaluation
 , R. Sanjeevi*and J. Anuradha
NIMS University Rajasthan, Jaipur, Rajasthan
Corresponding Author Email:sangwananii5556@gmail.com
DOI : http://dx.doi.org/10.13005/ojc/420404
Download this article as:

An international environmental issue is the infiltration of heavy metals into water systems. Typically, direct industrial discharge pollutes rivers, lakes, and ponds, and these pollutants can seep into groundwater systems through transport processes. Due to a sharp rise in heavy metals, the issues now require high attention. The purpose of this experiment is to look into how Cr6+ ions adsorb onto magnetite (Fe3O4)nanoparticles. Magnetic magnetite Fe3O4 nanoparticle synthesized by chemical co-precipitation was characterized using SEM-EDX, XRD, FTIR, zeta potential and sizer. The synthesized Fe3O4 nanoparticle was effective in removal of Cr6+ from water. The effect of temperature, pH, contact duration, and adsorbent dosage on Cr6+ adsorption was methodically examined in batch adsorption studies. At pH 2.0, the maximum amount of Cr6+ was removed. Thermodynamic analysis and adsorption data fit PSO kinetic, depicting the process's endothermic nature and spontaneity.The Temkin model best-describeCr6+ sorption on nanoparticle. Fe3O4 nanoparticle show potential as adsorbent for the removal of metal ions in wastewater and water treatment.
KEYWORDS:Adsorption; Hexavalent Chromium; Magnetic; Nanoparticle
Introduction
The significance of water for the environmental system is now well acknowledged worldwide. The significant environmental burden is increasing as a result of water pollution and scarcity, and natural water resources are being lost as a result of its increasing scarcity in the modern era.1,2 The bulk of water on Earth is salty from sea and ocean, which makes up over 97.0% of water, while less than 1% of freshwater is easily accessible to human. According to the WHO, nearly three billion people will not have access to clean water by 2025, with more than one-third of them residing in areas that are water-stressed; by 2050, that number is expected to rise to two-thirds of the population.3 Unplanned settlements brought about by the growing population have increased the amount of wastewater discharged into rivers and streams without any previous treatment, lowering the quality of natural water and contributing to pollution. The last 20 years have seen the discharge of heavy metal-containing wastewater, mining activities, power generating facilities, electroplating industries, metallurgical industries, and contaminated organic pollutants into the atmosphere, especially in developing nations.4
Heavy metals, the cyanide complex, and the complex effluent composition are all present in considerable amounts in electroplating wastewater. About 29% of the effluent from the electroplating business is poisonous or harmful. These harmful metal ions are present in far greater amounts than are allowed. Therefore, in order to prevent additional environmental harm, industry effluents must be appropriately treated before discharged.Exposure to electroplating effluent can cause a number of health problems, including as renal failure, rheumatoid arthritis, fatigue, insomnia, thyroid dysfunction, neurological and circulatory system problems, irritation of the gastrointestinal mucosa, and lung cancer. Heavy metals including zinc (Zn), nickel (Ni), iron (Fe), mercury (Hg), chromium (Cr), copper (Cu), cobalt (Co), arsenic (As), and occasionally lead (Pb) and cadmium (Cd) are found in effluent from the electroplating business. Additionally, acids, alkalis, and toxic CN are also present.
A number of techniques, such as ion exchange, membrane filtration, electrochemical processing technologies, ultrafiltration, chemical precipitation, chemical oxidation, reduction, and adsorption, have been studied in response to the need for efficient methods that can remove heavy metals (HMs).5,6 Taking into account the benefits and drawbacks of each of these methods, adsorption is thought to be the most practical and economical choice for extracting metals from aqueous solutions because of its high removal capacit, adaptability in design and speed of operation, high performance, and affordability.5,7 Lastly, even without secondary contamination from the production of byproducts, this process is ecological due to its reversibility and desorption capability.8,9
Ferric chloride was chemically reduced to produce magnetite Fe3O4 nanoparticles for the present study. The produced nanoparticle was then examined using SEM-EDS and XRD methods to determine their structural and morphological properties. The effects of pH, sorbent dosage, starting ion concentration, contact duration and temperature on extraction of hexavalent chromium was investigated in batch studies. The method and mechanism of hexavalent chromium adsorption on magnetite nanoparticle was examined using isotherm and kinetic investigations. In order to investigate the spontaneity and viability of adsorption, thermodynamic parameters were also determined.
Material and methodology
Materials
Analytical grade-potassium dichromate (K2Cr2O7), NaBH4, and FeCl3.6H2O of 98% material were used. K2Cr2O7 was converted into stock solution of 1000mg/L, 100mg/L, and 50mg/L in deionized water. The solution’s pH was determined using a pH-meterand 0.1N HCl and 0.1N NaOH were added to maintain pH of solution. The final concentration of Cr6+ ions determined by using Agilent’s 7900 ICP-MS.
Nanoparticle synthesis
Fe3O4 nanoparticles were prepared using the chemical co-precipitation process. Fe3O4 black precipitates were seen when NaBH4 was added to a solution of FeCl3.6H2O. After being cleaned with ethanol, the synthesized NPs were calcined for five hours. However, a variety of characterization procedures were used to the nanoparticles in order to verify their composition and structure.
Characterization
The surface characterization of Fe3O4NP for presence of functional groups was carried out with the help of FTIR spectroscopy by using Bruker Alpha model FTIR spectrometer fitted with OPUS software. The samples were used in powdered form for FTIR analysis. The spectra were captured in the 400 cm-1 to 4000 cm-1 range. Particle size as well as zeta potential of nanoparticle was determined by Zetasizer (Malvera). Surface morphology and elemental analysis of NP was done using FE-SEM, 7610F Plus/ JEOL and Energy Dispersive Spectroscopy. An XRD instrumentation was used to observe the crystalline structure of the NP in the wide-angle region (10–80°). When electrons strike a solid sample, XRD produces x-rays. By hitting a crystal structure, distinct x-ray behavior can be investigated.
Batch study
The purpose of the batch studies was to examine sorption of Cr6+ on nanoparticles at 25°C; while agitating at 100rpm. Adsorbent dosage of 15 mg magnetite nanoparticles was added to50.0 ml of a 20.0 mg/L chromium stock solution at various pH values between 2.0 and 9.0 for 30 minutes in order to determine the equilibrium pH. Every experiment was carried out in the same way, with all other parameters held constant while one parameter to be changed. To find the final concentration of Cr6+ ions in solution, ICP-MS was utilized. The following equation was used to determine the equilibrium adsorption-capacity (qe) of magnetite nanoparticle:
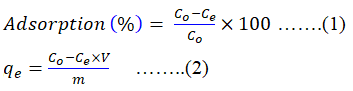
Here, qe, Co, Ce, V, and m stand for equilibrium adsorption-capacity in mg g−1, adsorbate’s initial concentration in mg/L, the adsorbate’s equilibrium concentration in mg/L, adsorbate solution’s volume in ml, and adsorbent’s mass in mg, respectively.
To investigate the kinetic behavior, adsorption study conducted at 2.0pH, 25 °C, starting chromium content of 20mg/L, sorbate dosage of 15mg, and agitation of 100 rpm. The models of PFO and PSO were employed. Additionally, equilibrium models of Langmuir, Freundlich and Temkin were utilized in order to verify equilibrium of Cr6+ using the experiment data on the initial concentration of chromium ion (VI) on the sorption-efficiency. In the 15–45 °C temperature range, metrics such as ΔS°, ΔH°, and ΔG° were examined.
Results& Discussions
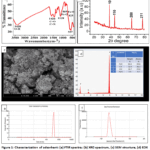 |
Figure 1: Characterization of adsorbent: (a) FTIR spectra; (b) XRD spectrum, (c) SEM structure, (d) EDX spectrum, (e) Size distribution and (f) Zeta potential of synthesized iron nanoparticle. |
One analytical method for identifying the functional-group in a NP and figuring out the particle’s micro-crystalline nature by using Fourier transform infrared (FTIR). The Fe-O bond is responsible for the three distinctive peaks as shown in Figure 1a, which are located at 552 cm−1, 645cm−1, and 990 cm−1. The hydroxyl-group of a water moleculesand ferric hydroxide found in sample are responsible for band at 1636cm−1 and 3410cm−1. The bands in the 400–650cm−1 range arestretching and vibrations modes of Fe–O bonds. Similar research, band at 425cm−1 and 557cm−1 demonstrates Fe-O bonding of magnetite nanoparticle. The tetrahedral site’s inherent stretching vibrations were associated with metal and oxygen band at 557cm−1, whereas the octahedralmetal stretching of Fe-O was linked to metal and oxygen band at 425cm−1.10,11
XRD is a helpful technique for analyzing the crystalline form of Fe3O4 NP and their crystalline size. The XRD pattern revealed a single pure magnetite phase, which was associated with Bragg peaks linked to JCPD card numbers 00–006-0694. The two theta values of 38.56°, 44.37°, 64.51°, and 81.72° correspond to the XRD unique diffraction peaks of Fe3O4 NP synthesized by magnetic stirring (Fig. 1b). These values were clearly linked to Bragg’s reflections at planes 101, 110, 200, and 211, respectively. Using Scherrer’s equation, D = kλ/βCosθ, size of produced Fe@NPs was estimated and found to be 18.21 nm. (Equation (1), where D is crystalline size in nanometers, k is Scherrer’s constant (typically between 0.9 and 1). The high-intensity peak in the diffractrogram’s (101) plane was used to achieve this. This investigation shows that the Fe3O4 NP is crystalline.
For morphological investigation, including the size and structure of the iron oxide NPs, FESEM was used. Fig. 1c displays the NPs’ surface texture and form. The FESEM indicates that the NPs are about spherical. An acceptable surface for adsorption is indicated by the image’s clear, asymmetrical particle with protrusions and shattered edges. The surface’s dot-like forms show that iron oxide (Fe3O4) is present and that iron oxide particles have clustered together to create a significant aggregation. ImageJ program revealed that average particle-size of produced nanoparticle was 15.71 nm. An EDX mapping plot of Fe3O4, as seen in Fig. 1d depicted that iron made up 66.6% of the weight, carbon 12.3%, oxygen 16.7%, and gold 4.4%, respectively, the results showed that iron was present in the synthesized nanoparticles.
The peak at 373 nm in Figure 1e is represented by the particle size distribution by intensity. The electrical potential at the surface of adsorbent particles is shown using zeta potential. The velocity of the adsorbent particles in the electrical field is measured in order to examine it. At neutral pH, the zeta potential of Fe3O4 was found to be -42.1 mV (Fig. 1f). It has been demonstrated that the stronger the electrostatic repulsion between the particles, the higher the zeta potential.
Adsorption study
The solution pH provides insight into the impact of adsorbent functional groups, metal ion solubility, adsorbate ionization level, and counter ion concentration during the process. Because Fe3O4 includes Fe2+, hydrolysis productFe(OH)3−; Fe(OH)2; FeOH+ change in response to pH variations. Aqueous solutions frequently include several chromium species, including CrO42−, Cr2O72−, HCr2O7−, and HCrO4−. As the pH rises, the clearance of Cr6+ falls. The existence of H+ ion or HCrO4− as main species at low pH may be the cause of this behavior because H+ ions neutralize OH− groups, which makes adsorption easier. Because of the existence of CrO42− and Cr2O72−, the concentration of OH− species at high pH inhibits diffusion of dichromate ion and lowers removal percentage as pH rises. As a result, adsorption was found to be greatest at pH of 2.0 and lowest at pH of 9.0 (Fig. 2a).
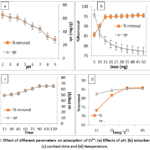 |
Figure 2: Effect of different parameters on adsorption of Cr6+: (a) Effects of pH, (b) adsorbent dose, (c) contact time and (d) temperature. |
To optimize the metal ion-adsorbent interaction, the adsorbent dosage was adjusted. At a constant Cr6+ ion concentration of 20 mg/L, treatment duration 90 min, and experimental pH of 2.0, the adsorbent dose (5 mg to 50 mg per 50 ml) exhibited a rising trend in the removal efficiency of Cr6+. At 5 mg, the Fe@NP adsorbent demonstrated 85% removal, and at 30 mg, it achieved 95% equilibrium (Fig. 2b). Because there was more active site available for sorption on the adsorbent surfaces, the removal percentage increased as the adsorbent dose increased. The results show that the adsorption capacity (qe) declined as the adsorption dosage rose. It could be because of increased competition at low adsorbent doses, which leads to increased adsorption site occupancy, and vice versa at higher doses.10
The effect of contact time was examined in order to determine if the competition effect persisted across the whole adsorption process time range. Removal efficiency and adsorption capacity were shown to rise with an increase in the adsorption process’s contact time. With an increase in duration from 15 to 120 minutes, the removal effectiveness of Cr6+ by Fe3O4NP increases significantly from 73.12 to 97.59% (Fig. 2c). At 120 minutes, the highest adsorption capacity was 65.06mg/g. As the adsorption sites are saturated, no appreciable adsorption takes place after the stipulated equilibrium time of 90 minutes. This is because, after time has passed, all of the adsorption site onsorbent’s surface have become saturated for adsorption. In beginning, metal ions easily fill the adsorption sites, but as time goes on, fewer free sites become available. The solution’s accumulated non-adsorbed cations also limit the adsorption capacity.12 As the starting concentration and contact duration rise, so does the adsorption capability.13
Adsorption requires a certain amount of temperature. Experiments were carried out using optimal dosages for Fe3O4NP at temperature ranging15 to 45°C; pH 2.0, 90 minutes of contact duration, and 20 mg/L of solution. Fig. 2d shows how temperature affects Cr6+, as the temperature increased, the removal % and capacity (qe) increased; nonetheless, they saturate at 35°C. The sorption site with lower and higher activation energy were occupied at their respective low and high temperatures. Increased thermal energy at higher temperatures makes the adsorbate more mobile, which lowers the adsorption fraction and hence reduces adsorption.14,15
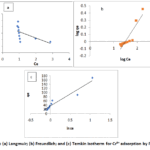 |
Figure 3: (a) Langmuir; (b) Freundlich; and (c) Temkin isotherm for Cr6+ adsorption by Fe3O4NP. Click here to View Figure |
The Langmuir hypothesis states that a metal ion adsorbs monolayer at a homogenous active site over surface of adsorbent, with no interaction among adsorbed molecules.16 Langmuir isotherm is shown by a graph between Ce/qe vs. Ce, as seen in Fig. 3a. The value of b and Qm are measured using plot’s slope & intercept. Langmuir constant value is connected with the adsorbents’ surface area and porosity. As surface area and pore volume increase, so does the adsorption capability. The adsorption type is shown by value of RL. Based on the graph displayed in Figure and Table 1, the correlation coefficient (R2) was 0.32. Because of the significant discrepancy between the calculated and projected values, the adsorbent exhibits a very low correlation coefficient value (R2), suggesting the unfitness of the Langmuir isotherm. The adsorption technique is successful at all metal concentrations studied, as evidenced by the separation factor (RL), which is 0.011 and falls within the range 0 < RL > 1.
The Freundlich model states that interactions took place between the adsorbed molecules as they formed many layers on the adsorbents’ heterogeneous surfaces. The adsorption of Cr6+ ions on this adsorbent is more favorable, as indicated by the greater positive value (1.96) of n. The slope and intercept values were computed using the graph (Fig. 3b). The Freundlich isotherm favors Fe3O4NP, as evidenced by its correlation coefficients (R2) of 0.82, respectively (Table 1). The study’s findings showed that, in contrast to the Langmuir isotherm, the adsorbent obeys the Freundlich isotherm. The Temkin model was proposed by Temkin and Pyzhev.17 This model states that as surface coverage increases, the temperatures of adsorption of all molecules fall linearly. The impact of indirect adsorbate/adsorbent interactions on the adsorption process is also taken into account by the Temkin isotherm model. The Temkin plot was shown using qe versus lnCe (Fig. 3c). Slope and intercept were used to get the values of BT and AT, respectively. When the BT value is less than 20 KJ/mol, physisorption is present. The Temkin constant (BT), which favors physisorption, is 0.021 kJ/molFe3O4NP (Table 1).
Table 1: Isothermic and kinetics parameter
|
Langmuir |
Qm | 104.1mg g-1 |
| B |
4.35 |
|
|
R2 |
0.32 | |
| Freundlich | N |
1.96 |
|
Kf(L/g) |
5.75 | |
| R2 |
0.82 |
|
|
Temkin |
BT | 0.021 |
| AT |
1.37 |
|
|
R2 |
0.92 |
|
|
PFO |
qe | 1.06 |
| K1 |
4.83 |
|
|
PSO |
qe | 71.4 |
| K2 |
0.001 |
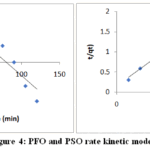 |
Figure 4: PFO and PSO rate kinetic model. Click here to View Figure |
In order to ensure effectiveness of an adsorbent in Cr6+ ion removal process, the rate of a reaction must be ascertained. The experimental data was analyzed using the linear equations for PFO and PSO. Table-1 provides a summary of parameters, Fig. 4 shows the findings. The physisorption mechanism, in which the adsorbents interacted with Cr6+ by the use of intermolecular or van der Waals forces of contact, was supported by PFO.18 Chromium and functional groups of adsorbent generated chemical interactions during the removal aided by Fe3O4NP, which followed pseudo-second-order kinetics aiding the chemisorption process. The calculated and experimental qe values were contrasted. The qe value of Fe3O4NP was found to be quite similar to the value determined using the PSO model. Fe3O4NP shows is a superior and more promising nanosorbent by providing greater surface area and sorption sites due to its increased porosity.19,20
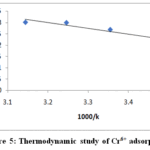 |
Figure 5: Thermodynamic study of Cr6+ adsorption Click here to View Figure |
The spontaneity of sorption process is shown by a negative values of ΔG°. Figure 5 makes it clear that ΔG° is negative for the heavy metal’s adsorption on produced Fe3O4NP. Therefore, the heavy metal under study adsorbs spontaneously on Fe3O4NP. Adsorption study is endo-thermic, as indicated by positive value of ΔH°. It indicates that more energy is used by the adsorption system than is released. The adsorbent/adsorptive interface’s enhanced unpredictability is shown by positive values of ΔS°.21
Table 2: Thermodynamic Parameters of Cr6+ Adsorption
|
Parameters |
Values |
|
ΔS˚ |
0.091 KJ/mol/K |
| ΔH˚ |
21.00KJ/mol |
|
ΔG˚ 288K |
-5.2KJ/mol |
| ΔG˚ 298K |
-6.1KJ/mol |
|
ΔG˚ 308K |
-7.2KJ/mol |
| ΔG˚ 318K |
-7.9KJ/mol |
Conclusion
Fe3O4NP was tested for removing Cr6+ from synthetic solutions. The purpose of the batch research was to optimise different parameter. At pH 2.0, 20mg/L of metal concentration, 90 minutes, and 25 °C, the best elimination was observed. The NP has a greater capability for adsorption. The crystalline size of the nanoparticles was 18.21 nm, and the XRD pattern showed a single pure rhombohedral hematite phase. The asymmetrical particle with protrusions and broken edges is seen in SEM investigation. The FTIR data demonstrated that the adsorption process involves both carboxylic and hydroxyl groups, as well as the presence of a water molecule’s or ferric hydroxide’s hydroxyl group. The stability of the generated nanoparticles is confirmed by zeta potential, and the nanoparticles are visible in the nanometer range by zeta sizer. The adsorption data and the Freundlich isotherm suited each other well, suggesting that adsorption surface was heterogeneous and that multilayer had developed there. The adsorption results suit the PSO kinetics better. The thermodynamic analysis demonstrated that Cr6+ adsorption was endothermic and spontaneous. It was determined that adsorbents are thought to be more effective in removing Cr6+, and they can also be used for removal other heavy metal ions.
Acknowledgments
The authors are thankful to NIMS University Rajasthan, Jaipur, Rajasthan, India.
Funding Sources
The author(s) received no financial support for the research, authorship, and/or publication of this article.
Conflict of Interest
The author(s) do not have any conflict of interest.
Data Availability Statement
This statement does not apply to this article.
Ethics Statement
This research did not involve human participants, animal subjects, or any material that requires ethical approval.
References
- Yadav, D.; Das, S.;Dhillayan, D.;Yadav, S., &Bhukal, S.,Discover Agriculture, 2025, 3(1), 1-18.
CrossRef - Carolin, C. F.; Kumar, P. S.;Saravanan, A.;Joshiba, G. J., &Naushad, M., Journal of environmental chemical engineering, 2017, 5(3), 2782-2799.
CrossRef - Bankole, M. T.;Abdulkareem, A. S.;Tijani, J. O.;Ochigbo, S. S.;Afolabi, A. S., &Roos, W. D.,Water Resources and Industry, 2017, 18, 33-50.
CrossRef - Rajoria, S.;Vashishtha, M.;&Sangal, V. K., Environmental Science and Pollution Research, 2022,29(48), 72196-72246.
CrossRef - Ouni, L.;Ramazani, A., &TaghaviFardood, S.,Frontiers of Chemical Science and Engineering, 2019, 13, 274-295.
CrossRef - Pohl, A.,Water, Air, & Soil Pollution, 2020, 231(10), 503.
CrossRef - Duan, C.; Ma, T.; Wang, J.;& Zhou, Y.,Journal of Water Process Engineering, 2020, 37, 101339.
CrossRef - De Beni, E.;Giurlani, W.;Fabbri, L.;Emanuele, R.;Santini, S.;Sarti, C.;Martellini, T.;Piciollo, E.;Cincinelli, A., &Innocenti, M.,Chemosphere, 2022, 292, 133448. https://doi.org/10.1016/j.chemosphere.2021.133448
CrossRef - Yadav, S.;Bajar, S.;Hemraj;Rohilla, R.; Chhikara, S. K., &Dhankhar, R.,Sustainable Water Resources Management, 2023, 9(6), 174.
CrossRef - Arora, D.; Arora, A.; Singh, A.;Agarwal, R.; Bala, R.;& Kumar, S.,Sustainable Water Resources Management, 2023, 9(5), 168.
CrossRef - Yadav, S.;Yadav, A.; Goyal, G.;Dhawan, M.; Kumar, V.;Yadav, A., & Chhikara, S. K.,Oriental Journal of Chemistry, 2024, 40(1).
CrossRef - Mittal, J.; Ahmad, R.;Mariyam, A.; Gupta, V. K., & Mittal, A., Desalination and Water Treatment, 2021, 210, 365-376.
CrossRef - Zhou, C.; Han, C.; Min, X., & Yang, T.,Journal of Molecular Liquids, 2021, 338, 116619. https://doi.org/10.1016/j.molliq.2021.116619
CrossRef - Wanees, S. A.; Ahmed, A. M. M.; Adam, M. S., & Mohamed, M. A., J, 2012, 2(3), 95-105.
- Singh, A.; Arora, D.; Bala, R.;Khokhar, A., & Kumar, S., Environmental Science and Pollution Research, 2023, 30(48), 105415-105428.
CrossRef - Langmuir, I.,Journal of the American Chemical society, 1918, 40(9), 1361-1403.
CrossRef - Temkin, M. J., &Pyzhev, V., Recent modifications to Langmuir isotherms.1940
- Yadav, S.;Rohilla, R.;& Chhikara, S. K., Proceedings of the National Academy of Sciences, India Section B: Biological Sciences, 2024, 1-9.
- Yadav, S.;Dhawan, M.; Kumar, V.;Dalal, J.;Pandey, R.;Sehrawat, N., & Chhikara, S. K.,Discover Materials, 2025, 5(1), 1-18.
CrossRef - Banerjee, S., Banerjee, I.;Dutta, M.;& Pal, R.,Algal Research, 2021, 58, 102373. https://doi.org/10.1016/j.algal.2021.102373
CrossRef - Mahanty, S.;Sarkar, A.;Chaudhuri, P., & Krishna Darbha, G., Environmental Nanotechnology, Monitoring & Management, 2023, 20, 100854. https://doi.org/10.1016/j.enmm.2023.100854
CrossRef
 PlumX:
  Views: 705 Views
  PDF Downloads: 233
 Accepted on: 20 Jan 2026
Second Review by: Dr. Manisha Rathore
Final Approval by: Dr. Ravindra M Kumbhare


ISSN Online: 2231-5039