Carbon Dioxide Emission and Carbon Mineralization from Organic Residue Amended Soils Under Different Temperature Regimes
 , Ritu S. Thakare1 and Prasad B. Margal2*
1Department of Soil Science, Post Graduate Institute, Mahatma Phule Krishi Vidyapeeth, Rahuri, Maharashtra, India
2Department of Soil Science, College of Agriculture Dhule, MPKV, Rahuri, Maharashtra, India
Corresponding Author’s E-mail: prasadmargal@gmail.com
DOI : http://dx.doi.org/10.13005/ojc/420407
Download this article as:

The decomposition of crop residues, mediated by soil microorganisms, plays a central role in regulating soil organic carbon (SOC) stocks. During this process, microorganisms respire, releasing CO2 as a byproduct. The rate of CO2 emission and the extent of mineralization depend on several factors, including quality of the organic residue and environmental conditions like temperature and moisture. The experiment was conducted using a factorial completely randomized design (FCRD) comprising 36 treatments, which included six types of crop residues (pearl millet straw, wheat straw, sorghum straw, sugarcane trash, parthenium weed and cassia weed) evaluated under six temperature regimes (15, 20, 25, 30, 40, and 50°C). To maintain the particular temperature experimental bottles are kept in BOD incubator. During the 16-week incubation period, carbon dioxide (CO₂) emissions initially increased and reached their peak at different stages depending on the organic residue. Maximum emissions occurred during the 7th week for cassia weed, sugarcane trash and parthenium weed; in the 8th week for pearl millet straw; in the 9th week for sorghum straw; and in the 14th week for wheat straw. Thereafter, CO₂ emissions gradually declined until the 16th week. Among the tested residues, the highest CO₂ emission rate was recorded in cassia weed (228.80 mg CO₂ week⁻¹ kg⁻¹ soil at the 7th week), followed by sugarcane trash (220.73 mg CO₂ week⁻¹ kg⁻¹ soil) and parthenium weed (217.80 mg CO₂ week⁻¹ kg⁻¹ soil). Maximum CO₂ release was recorded with pearl millet straw (206.80 mg CO₂ kg⁻¹ soil week⁻¹ at the 8th week) and sorghum straw (215.80 mg CO₂ kg⁻¹ soil week⁻¹ at the 9th week), both under the 50°C temperature regime. In contrast, wheat straw–amended soil consistently showed the lowest CO₂ emissions across all incubation stages. Emissions from wheat straw increased steadily up to the 14th week, reaching a maximum of 110.00 mg CO₂ week⁻¹ kg⁻¹ soil at 50°C, after which they declined indicating its relatively lower decomposability compared to other residues. A similar trend was observed for carbon mineralization, further supporting the variation in decomposition dynamics among different organic residues. The study demonstrates that high temperatures (15°C to 50°C) and low C: N ratios (found in residues like Cassia weed) accelerate microbial metabolism, leading to rapid mineralization and peak CO2 emissions.
KEYWORDS:CO2 emission; Carbon Mineralization; Cassia; Parthenium; Temperature Regimes
Introduction
Carbon (C) is among the most versatile and dynamic elements in the biosphere. In case of greenhouse gases, carbon dioxide (CO₂) is particularly significant, contributing nearly 60% of the global greenhouse effect1. The decomposition of crop residues plays a central role in regulating soil organic carbon (SOC) stocks, which are critical both for maintaining soil fertility and for mitigating climate change2. Vegetation and soils function as major sinks for atmospheric CO₂; however, in recent decades, emissions of naturally occurring greenhouse gases such as CO₂, methane (CH₄), and nitrous oxide (N₂O) have increased markedly.
Carbon mineralization is a fundamental process that indicates how different organic and inorganic inputs influence soil functioning. The chemical, physical and biological breakdown of soil organic matter (SOM) leads to mineralization, releasing CO₂ 3, which contributes significantly to greenhouse gas emissions1. It is expected that CO₂ emissions from soil vary depending on the nature of the organic residues applied and the prevailing temperature conditions during decomposition. Effective management of organic inputs, however, can promote soil biodiversity, improve micro-aggregation and reduce CO₂ emissions.
The use of organic amendments has been widely adopted as a sustainable agricultural practice to counter soil degradation. This approach not only supports soil restoration but also enhances its chemical, physical, biological and ecological functions4. Enhancement of soil organic matter (SOM) through organic amendments modifies the soil microenvironment, influences microbial community structure, regulates biomass turnover and enhances nutrient mineralization.
Materials and Methods
An incubation experiment was conducted in a factorial completely randomized design (FCRD) with 36 treatment combinations, consisting of six crop residues (pearl millet straw, wheat straw, sorghum straw, sugarcane trash, parthenium weed and cassia weed) across the six temperature regimes (15, 20, 25, 30, 40 and 50 °C). The study was carried out in the laboratory of the Department of Soil Science, Post Graduate Institute, MPKV, Rahuri, during February to May 2023. The organic residues were mixed with local medium deep black soil collected from the PGI farm. According to the USDA soil taxonomy, the soil belongs to the order Inceptisols. The soil was well-drained, clayey in texture, with a neutral pH, medium organic carbon content, low nitrogen and phosphorus and very high potassium status (Table 1).
Table 1: Initial properties and fertility status of experimental soil
|
Sr. No. |
Parameters | Value |
| A. | Physical Properties |
|
|
1. |
Texture | Clayey |
| Sand (%) |
40 |
|
|
Silt (%) |
17.73 | |
| Clay (%) |
41.76 |
|
|
2. |
Bulk Density (Mg m-3) | 1.3 |
| B. | Chemical properties |
|
|
1. |
pH (1:2.5, Soil: Water) | 7.86 |
| 2. | EC (d Sm-1) |
0.41 |
|
3. |
Organic carbon (%) | 0.51 |
| 4. | Available N (kg ha-1) |
178.75 |
|
5. |
Available P (kg ha-1) | 14.12 |
| 6. | Available K (kg ha-1) |
472.87 |
The choice of crop residues was made considering their availability and their potential role in carbon sequestration. Their total organic carbon (TOC), nitrogen content and C:N ratio were determined and are presented in Table 2.
Table 2: Chemical Properties of organic residue
|
Sr. |
Organic Residue | TOC (%) | N (%) | C:N Ratio |
| 1) | Pearl Millet | 41.29 % | 0.7 % |
58.92 |
|
2) |
Wheat | 44.56 % | 0.56 % | 79.57 |
| 3) | Sorghum | 42.57 % | 0.56 % |
76.01 |
|
4) |
Sugarcane | 46.92% | 0.42 % | 111.71 |
| 5) | Parthenium | 43.72 % | 0.28 % |
156.14 |
|
6) |
Cassia | 50.92 % | 0.7 % |
71.71 |
Experiment details (Incubation Study)
Organic residues (ground to 2 mm size) were mixed with soil based on their carbon content to provide the equivalent of 2.5 g C kg⁻¹ soil. For each treatment, 0.5 kg of soil was placed in airtight plastic pots. The experiment consisted of treatments incubated at six temperature regimes (15, 20, 25, 30, 40, and 50 °C) arranged in a completely randomized design with three replications. BOD incubators were used to maintain the required temperatures. Soil moisture was maintained near field capacity by weekly application of water, ensuring the soil remained moist throughout the incubation period.
Carbon dioxide (CO₂) evolution was measured using the alkali (NaOH) trapping method followed by titration with hydrochloric acid (HCl). For each treatment, a trap was prepared by placing 20 ml of 1 N NaOH in a 50 ml test tube, which was then placed inside the airtight pot. Control treatments consisted of soil without residue but with alkali traps. After every 7-day interval, the traps were removed and fresh traps were placed. The timing was standardized so that CO₂ absorption was measured over consistent 7-day intervals. Data collection continued at weekly intervals for a total duration of 16 weeks.
CO2 evolution, Emission loss of carbon and carbon degradation rate determination
The CO₂ evolution was measured using the alkali trap method (Pramar and Schimidt5). The total organic carbon (TOC) was determined by the wet oxidation method (Walkley and Black6). The carbon emission loss (%) and the carbon degradation rate constant (k) were calculated using the standard formulae proposed by Stanford and Smith7.

Where,
t = Time
CO = Initial carbon content
C = Final carbon content
Result and Discussion
Carbon dioxide emissions from residue-amended soils under varying temperature regimes
The rate of CO₂ emission varied significantly among the treatments. Among the organic residues, the maximum emission (228.80 mg CO2 week-1 kg-1 soil) was observed in cassia at the 7th week of incubation under 50 °C (Fig. 6), followed by sugarcane (220.73 mg CO2 week-1 kg-1 soil; Fig. 4) and parthenium residue-amended soils (217.80 mg CO2 week-1 kg-1 soil; Fig. 5). In cassia amended soil, CO₂ emission significantly increased from 214.87 to 228.80 mg CO2 week-1 kg-1 soil as the temperature ranges from 15 °C to 50 °C. The interaction effect between residue type and temperature was found to be significant. After the 7th week, CO₂ emission from cassia weed residue gradually declined up to the 16th week, although the values remained higher compared to other organic residues.
For pearl millet crop residue (Fig. 1), the maximum CO₂ emission (206.80 mg CO2 week-1 kg-1 soil) was recorded at the 8th week of incubation under 50 °C, followed by a gradual decline until the 16th week. In the case of sorghum crop residue (Fig. 3), the highest CO₂ emission (215.80 mg CO2 week-1 kg-1 soil) was observed at 50 °C, peaking at the 9th week of incubation and then gradually decreasing until the 16th week. The wheat straw–amended soil consistently showed the lowest CO₂ emission at all stages of incubation (Fig. 2). However, emission significantly increased from 99.00 to 110.00 mg CO2 week-1 kg-1 soil as temperature increased from 15 °C to 50 °C.
The present findings are consistent with those of Hossain8, who reported maximum CO₂ emission from chicken manure during the 5th week of incubation, followed by rice straw, cow dung, vermicompost and rice husk biochar. The higher CO₂ emission observed from cassia, parthenium and sugarcane residue may be attributed to their higher nitrogen content and favorable moisture levels, which promote rapid microbial decomposition and enhance carbon mineralization. Similar observations have been reported by Ray9.
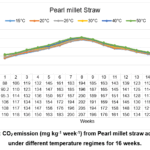 |
Figure 1: CO2 emission (mg kg-1 week-1) from Pearl millet straw added soil under different temperature regimes for 16 weeks. Click here to View Figure |
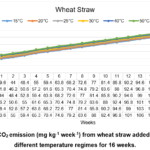 |
Figure 2: CO2 emission (mg kg-1 week-1) from wheat straw added soil under different temperature regimes for 16 weeks. Click here to View Figure |
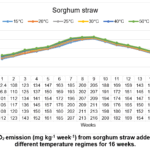 |
Figure 3: CO2 emission (mg kg-1 week-1) from sorghum straw added soil under different temperature regimes for 16 weeks. Click here to View Figure |
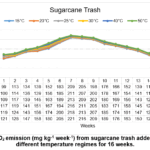 |
Figure 4: CO2 emission (mg kg-1 week-1) from sugarcane trash added soil under different temperature regimes for 16 weeks. Click here to View Figure |
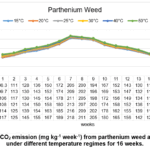 |
Figure 5: CO2 emission (mg kg-1 week-1) from parthenium weed added soil under different temperature regimes for 16 weeks. Click here to View Figure |
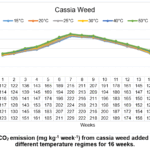 |
Figure 6: CO2 emission (mg kg-1 week-1) from cassia weed added soil under different temperature regimes for 16 weeks. Click here to View Figure |
Cumulative carbon dioxide emission during incubation study
Over the 16-week incubation period, cumulative CO₂ emissions were highest at 50°C (Table 3). Cassia weed recorded the maximum emission (2731.60 mg kg⁻¹ 16 wk⁻¹), followed by sugarcane trash (2610.13 mg kg⁻¹ 16 wk⁻¹), sorghum straw (2595.61 mg kg⁻¹ 16 wk⁻¹), parthenium weed (2508.40 mg kg⁻¹ 16 wk⁻¹) and pearl millet straw (2403.87 mg kg⁻¹ 16 wk⁻¹). Wheat straw showed the lowest cumulative emission, ranging from 1166.00 to 1340.54 mg kg⁻¹ 16 wk⁻¹ across temperatures from 15°C to 50°C.
Table 3: Cumulative carbon dioxide emission during incubation study
|
Cumulative CO2 emission |
|||||||
| Pearl millet straw | Wheat
straw |
Sorghum straw | Sugarcane trash | Parthenium weed | Cassia weed |
Mean |
|
|
15°C |
2167 | 1166.00 | 2348.36 | 2378.19 | 2291.66 | 2511.8 | 2136.29 |
| 20°C | 2206.53 | 1200.47 | 2397.2 | 2410.47 | 2331.26 | 2555.13 |
2176.02 |
|
25°C |
2261.53 | 1236.40 | 2451.6 | 2463.07 | 2371.47 | 2589.93 | 2223.23 |
| 30°C | 2319.46 | 1270.87 | 2497.83 | 2511.07 | 2410.74 | 2634.87 |
2270.58 |
|
40°C |
2357.66 | 1306.80 | 2541.17 | 2561.66 | 2465.87 | 2689.06 | 2318.69 |
| 50°C | 2403.87 | 1340.54 | 2589.01 | 2610.13 | 2508.4 | 2733.8 |
2365.03 |
|
Mean |
2286.00 | 1253.51 | 2470.86 | 2489.09 | 2396.56 | 2619.09 | 2248.31 |
| SE(m) ± |
C.D. at 5% |
||||||
|
Org. residue (O) |
2.36 | 6.62 | |||||
| Temperature (T) | 2.36 |
6.62 |
|||||
|
O × T |
0.57 |
1.62 |
|||||
Likewise, field studies have shown higher CO₂ emissions from cow dung, whereas the relatively lower C:N ratio of chicken manure, compared with cow dung, rice straw and rice husk biochar promoted greater CO₂ release10,11.
Carbon mineralization from residue-amended soils under varying temperature regimes
The carbon mineralization rate varied significantly among the treatments. The highest mineralization (32.69 mg C Day⁻¹) was observed in cassia (Fig. 12) at the 7th week of incubation under 50 °C, followed by sugarcane (Fig. 10) (31.53 mg C Day⁻¹) and parthenium residue-amended soils (Fig. 11) (31.11 mg C Day⁻¹). In cassia residue, mineralization increased significantly with temperature, ranging from 30.70 to 32.69 mg C Day⁻¹ as temperature rose from 15 °C to 50 °C.
For pearl millet straw (Fig. 7), the maximum mineralization (29.54 mg C Day⁻¹) occurred at the 8th week under 50 °C, after which it declined steadily until the 16th week. In sorghum straw–amended soil (Fig. 9), the highest mineralization (30.80 mg C Day⁻¹) was recorded at the 9th week, followed by a gradual decline until the end of the incubation period. In contrast, wheat straw residue (Fig. 8) consistently exhibited the lowest mineralization at all stages. Mineralization in wheat straw residue increased until the 14th week, reaching a peak of 15.71 mg C Day⁻¹ at 50 °C, and declined thereafter, reflecting its lower decomposability compared with other residues. The interaction effect between residue type and temperature was significant across all stages of incubation.
The higher cumulative respiration observed with frequent residue additions may also be linked to an enhanced priming effect12, where the addition of fresh organic inputs stimulates the mineralization of native soil organic matter. Similar results have been demonstrated with glucose additions to soil13. Consistent with the findings of Sahoo14, the application of various organic residues, such as vermicompost (VC) and farmyard manure (FYM), resulted in significant cumulative carbon mineralization and a larger potentially mineralizable carbon pool. This enhancement is attributed to the fact that these organic inputs serve as effective drivers for nitrogen kinetics, yielding higher nitrogen mineralization and a larger active N fraction. Within the context of our varying temperature regimes, the mineralization rates likely accelerated as thermal levels increased. This highlights how organic amendments interact with temperature to dictate the pace of nutrient release and carbon dioxide evolution in coastal soils.
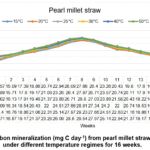 |
Figure 7: Carbon mineralization (mg C day-1) from pearl millet straw added soil under different temperature regimes for 16 weeks. Click here to View Figure |
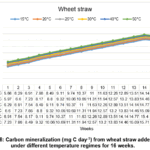 |
Figure 8: Carbon mineralization (mg C day-1) from wheat straw added soil under different temperature regimes for 16 weeks. Click here to View Figure |
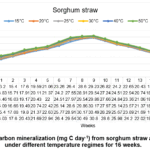 |
Figure 9: Carbon mineralization (mg C day-1) from sorghum straw added soil under different temperature regimes for 16 weeks. Click here to View Figure |
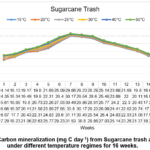 |
Figure 10: Carbon mineralization (mg C day-1) from Sugarcane trash added soil under different temperature regimes for 16 weeks. Click here to View Figure |
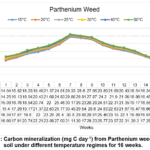 |
Figure 11: Carbon mineralization (mg C day-1) from Parthenium weed added soil under different temperature regimes for 16 weeks. Click here to View Figure |
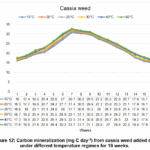 |
Figure 12: Carbon mineralization (mg C day-1) from cassia weed added soil under different temperature regimes for 16 weeks. Click here to View Figure |
Total organic carbon at start and at the end of incubation study
At the beginning of the incubation study, the highest organic carbon content (Table 4) was recorded in cassia weed amended soil (0.71%). This value declined with rising temperature (15–50 °C), reaching 0.48% at the end of the incubation period. In sugarcane trash and parthenium weed, the initial organic carbon contents were 0.70% and 0.67%, which decreased to 0.46% and 0.45%, respectively, after incubation. The smallest reduction was observed in wheat straw, where organic carbon decreased only from 0.62% initially to 0.54% at the end of the study. The decrease in organic carbon content was due to the part of carbon release as CO2 during decomposition and part was assimilated by microbes as a source of energy during decomposition of organic matter9. Hulage15 identified that Cassia biomass possessed the most significant initial total organic carbon (TOC) concentration, recorded at 50.21%. Across the experimental treatments, a consistent reduction in organic carbon levels was observed as composting progressed, indicating active microbial mineralization and the conversion of organic matter into stable humus.
Table 4: Total organic carbon at start and at the end of incubation study
| Organic carbon (%) | ||||||||
|
Sr. |
Soil + Pearl millet straw | Soil + Wheat straw | Soil + Sorghum straw | Soil + Sugarcane trash | Soil + Parthenium weed | Soil + Cassia weed | ||
| 1. | At start of incubation study (Initial Organic carbon) | 0.62 | 0.62 | 0.64 | 0.70 | 0.67 |
0.71 |
|
|
2. |
At the end of incubation period (after 16 weeks) | Temperature | ||||||
| 15°C | 0.58 | 0.61 | 0.56 | 0.61 | 0.60 |
0.63 |
||
|
20°C |
0.57 | 0.60 | 0.54 | 0.58 | 0.58 | 0.60 | ||
| 25°C | 0.52 | 0.58 | 0.52 | 0.57 | 0.55 |
0.57 |
||
|
30°C |
0.51 | 0.57 | 0.49 | 0.52 | 0.51 | 0.55 | ||
| 45°C | 0.49 | 0.55 | 0.48 | 0.51 | 0.49 |
0.52 |
||
|
50°C |
0.48 | 0.54 | 0.47 | 0.46 | 0.45 |
0.48 |
||
Trends of carbon emission loss and carbon degradation rate constant
Emission loss of carbon
The maximum carbon emission loss (Table 5) was recorded in cassia weed residues amended soil, followed by sugarcane trash residue, parthenium weed residue, sorghum straw residue and pearl millet straw residue, whereas the lowest value was observed in wheat straw at 50 °C. In cassia weed, carbon emission loss ranged from 32.94% to 35.94% as temperature increased from 15 °C to 50 °C. Similar trends were noted in sugarcane trash (31.21–34.34%), parthenium weed (29.97–33.01%), sorghum straw (30.70–34.15%) and pearl millet straw (28.46–31.63%) across the same temperature range. The minimum loss, 17.64%, was observed in wheat straw at 50 °C. During the process of incubation, the carbon present in soil and organic residues is converted into CO2 due to microbial activities. When the decomposition rate of organic material increases the rate of carbon emission also increases16. Research by Gill17 indicated that CO2 emission from non-amended control plots escalated between 10°C and 30°C across both soil types. Notably, the Immokalee soil exhibited a more pronounced thermal sensitivity, which can be attributed to its higher organic carbon density. With a carbon concentration of 1.60%—nearly 2.5 times that of the Citra soil (0.62%)—the Immokalee soil provides a larger substrate pool for microbial respiration, thereby facilitating greater cumulative carbon emissions as temperatures rise.
Table 5: Emission loss of carbon from residue-amended soils under varying temperature regimes
|
Emission loss of carbon (%) |
|||||||
| Pearl millet straw | Wheat
straw |
Sorghum straw | Sugarcane trash | Parthenium weed | Cassia weed |
Mean |
|
|
15°C |
28.51 | 15.34 | 30.90 | 31.29 | 30.15 | 33.05 | 28.11 |
| 20°C | 29.03 | 15.80 | 31.54 | 31.72 | 30.67 | 33.62 |
28.63 |
|
25°C |
29.76 | 16.27 | 32.26 | 32.41 | 31.20 | 34.08 | 29.25 |
| 30°C | 30.52 | 16.72 | 32.87 | 33.04 | 31.72 | 34.67 |
29.88 |
|
40°C |
31.02 | 17.19 | 33.44 | 33.71 | 32.45 | 35.38 | 30.51 |
| 50°C | 31.63 | 17.64 | 34.07 | 34.34 | 33.01 | 35.97 |
31.12 |
|
Mean |
30.05 | 16.49 | 32.50 | 32.75 | 31.53 | 34.37 | 29.58 |
| SE(m) ± |
C.D. at 5% |
||||||
|
Org. residue (O) |
0.02 | 0.07 | |||||
| Temperature (T) | 0.02 |
0.07 |
|||||
|
O × T |
0.05 |
0.16 |
|||||
These findings are in agreement with Hossain8, who reported significantly higher carbon losses in soils treated with chicken manure (19.69%) and rice straw (18.60%) compared with other organic inputs. In contrast, cow dung (12.01%) and vermicompost (12.16%) showed similar but lower values, while rice husk biochar recorded the lowest carbon loss (7.96%), which was less than half of that observed in chicken manure and rice straw treatments. As evidenced by Heikkinen18, the observed depletion of SOC stocks under increased temperature and precipitation regimes shows a reduction in carbon residence time. This loss is primarily driven by the intensification of heterotrophic respiration, which systematically outpaces the compensatory sequestration of carbon, leading to a progressive decline in soil organic reserves.
Carbon degradation rate constant (K) from residue-amended soils under varying temperature regimes
Among the organic residues, the carbon degradation rate constant (k) (Fig. 13) ranged from 0.0056 to 0.0043% day⁻¹ in cassia weed residue-amended soils, followed by sugarcane trash residue-amended soils (0.0053–0.0042% day⁻¹), sorghum straw residue-amended soils (0.0053–0.0041% day⁻¹), parthenium weed residue-amended soils (0.0052–0.0040% day⁻¹), and pearl millet straw residue-amended soils (0.0054–0.0044% day⁻¹) over the temperature range of 15 to 50 °C. In contrast, wheat straw showed relatively higher values (0.0056–0.0048% day⁻¹) across the same temperature range.
A higher k value indicates slower degradation of organic material. For instance, rice husk biochar (0.0139% day⁻¹) degraded more slowly than rice straw (0.0078% day⁻¹), which is consistent with their respective cumulative CO₂ emissions as reported by Hossain8.
It is noteworthy that the carbon degradation rate of all organic residues declined with longer incubation periods and a similar trend was observed with increasing temperature. Elevated temperature accelerated the decomposition of organic matter in soil, as reflected by the reduction in k values under higher temperature regimes. The temperature sensitivity of SOC mineralization acts as a critical indicator for measuring the rate of SOC degradation via microbial respiration. Evaluating this parameter is indispensable for forecasting the trajectory of carbon sequestration and the resilience of terrestrial organic reservoirs under various climate change projections19.
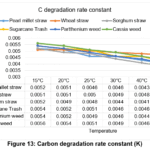 |
Figure 13: Carbon degradation rate constant (K). Click here to View Figure |
Carbon turnover from residue-amended soils under varying temperature regimes
The carbon turnover rate (Table 6) increased consistently with rising temperature. The highest turnover was observed in cassia weed (0.35% day⁻¹) at 50 °C, followed by sorghum straw (0.34% day⁻¹), sugarcane trash (0.33% day⁻¹), parthenium weed (0.31% day⁻¹) and pearl millet straw (0.28% day⁻¹), whereas the lowest turnover occurred in wheat straw amended soil (0.26% day⁻¹). The increase in turnover rate can be attributed to the higher CO₂ release during the incubation period under elevated temperatures10,11. According to Meyer20, soil carbon turnover is highly sensitive to environmental forcing, specifically the synergistic effects of optimal thermal conditions and the magnitude of soil moisture availability
Table 6: Carbon turnover from residue-amended soils under varying temperature regimes
|
Carbon turnover (% day-1) at 16th week |
|||||||
| Pearl millet straw | Wheat
straw |
Sorghum straw | Sugarcane trash | Parthenium weed | Cassia weed |
Mean |
|
|
15°C |
0.19 | 0.21 | 0.24 | 0.23 | 0.22 | 0.23 | 0.22 |
| 20°C | 0.20 | 0.22 | 0.26 | 0.24 | 0.23 | 0.25 |
0.23 |
|
25°C |
0.22 | 0.23 | 0.28 | 0.25 | 0.25 | 0.27 | 0.25 |
| 30°C | 0.24 | 0.24 | 0.30 | 0.28 | 0.28 | 0.29 |
0.27 |
|
40°C |
0.26 | 0.25 | 0.32 | 0.30 | 0.30 | 0.31 | 0.29 |
| 50°C | 0.28 | 0.26 | 0.34 | 0.33 | 0.31 | 0.35 |
0.31 |
|
Mean |
0.25 | 0.23 | 0.29 | 0.27 | 0.27 | 0.28 | 0.26 |
| SE(m) ± |
C.D. at 5% |
||||||
|
Org. residue (O) |
0.002 |
0.01 |
|||||
|
Temperature (T) |
0.002 | 0.01 | |||||
| O × T | 0.005 |
0.01 |
|||||
Conclusion
This study demonstrates that temperature and residue quality (C:N ratio) are the primary drivers of carbon mineralization in agricultural soils. Higher temperatures (up to 50°C) and low C:N ratios—most notably in Cassia weed—synergistically accelerate microbial metabolism, leading to peak CO2 emissions and rapid depletion of soil organic carbon.
In contrast, high C: N residues like wheat and pearl millet straw exhibit greater resistance to degradation, resulting in significantly lower carbon loss even under elevated temperature regimes. While cumulative emissions rose with heat, the decreasing degradation rate constant (k) suggests a shift in microbial efficiency or substrate availability at higher temperatures. Ultimately, the results suggest that incorporating slow-decomposing materials like wheat straw is a superior sustainable strategy. This approach not only enhances soil structural health but also serves as a vital mitigation tool against greenhouse gas emissions in warming climates.
Acknowledgement
I sincerely express my gratitude and indebtedness for department of soil science, PGI, MPKV, Rahuri for providing necessary facilities to conduct of the experiment.
Funding Sources
The author(s) received no financial support for the research, authorship, and/or publication of this article.
Conflict of Interest
The author(s) do not have any conflict of interest.
Data Availability Statement
This statement does not apply to this article.
Ethics Statement
This research did not involve human participants, animal subjects, or any material that requires ethical approval.
References
- Rastogi, M.; Singh, S.; Pathak, H., Emission of carbon dioxide from soil. Current Science. 2002, 82, 510-517.
CrossRef - Ntonta, S.; Mathew, I.; Zengeni, R.; Muchaonyerwa, P.; Chaplot, V., Crop residues differ in their decomposition dynamics: Review of available data from world literature. Geoderma., 2022, 419, 115855.
CrossRef - Van Gestel, J. N. M.; Van Veen, J. A. R.; De Beer, V. H. J.; Prins, R., The effect of phosphate on the hydrodenitrogenation activity and selectivity of alumina-supported sulfided Mo, Ni, and Ni, Mo catalysts. Journal of Catalysis., 1991, 131(2), 412-432.
CrossRef - Amoah-Antwi, C.; Kwiatkowska-Malina, J.; Thornton, S. F.; Fenton, O.; Malina, G.; Szara, E., Restoration of soil quality using biochar and brown coal waste: A review. Science of the Total Environment., 2020, 722, 137852.
CrossRef - Pramar, D.; Schimidt, E.L., Experimental Soil Microbiology. Burgers pub. Com Minnesota. U.S.A. 1965.
- Walkley, A.; Black, I.A., An examination of the Degtjareff method for determining soil organic matter and a proposed modification of the chromic acid titration method. Soil Science., 1934, 37(1), 29-38.
CrossRef - Stanford, G.; Smith, S.J., Nitrogen mineralization potentials of soils. Soil Science Society of America Proceedings, 1972, 36, 465-472.
CrossRef - Hossain, M. B.; Rahman, M. M.; Biswas, J.C.; Miah, M. M. U.; Akhter, S.; Maniruzzaman, M.; Choudhury, A.K.; Ahmed, F.; Shiragi, M. H. K.; Kalra, N., Carbon mineralization and carbon dioxide emission from organic matter added soil under different temperature regimes. International Journal of Recycling of Organic Waste in Agriculture., 2017, 6, 311–319.
CrossRef - Ray, R. L.; Griffin, R. W.; Fares, A.; Elhassan, A.; Awal, R.; Woldesenbet, S.; Risch, E., Soil CO2 emission in response to organic amendments, temperature, and rainfall. Scientific Reports., 2020, 10(1), 5849.
CrossRef - Rahman, Md. Mizanur, Carbon dioxide emission from Soil. Agriculture Research., 2013, 2(2), 132–139.
CrossRef - Mühlbachová, G.; Kusá, H.; Růžek, P.; Vavera, R., CO2 emissions in a soil under different tillage practices. Plant, Soil and Environment., 2022, 68(6), 253-261.
CrossRef - Kuzyakov, Y.; Friedel, J.K.; Stahr, K., Review of mechanisms and quantification of priming effects. Soil Biology and Biochemistry., 2000, 32, 1485–1498.
CrossRef - De Nobili, M.; Contin, M.; Mondini, C.; Brookes, P.C., Soil microbial biomass is triggered into activity by trace amounts of substrate. Soil Biology and Biochemistry., 2006, 33, 1163–1170.
CrossRef - Sahoo, S. K.; Mishra, K. N.; Panda, N.; Sethi, D.; Dey, P., Carbon and nitrogen mineralization kinetics in soil under differential nutrient management regimes in Inceptisols of coastal India. Communications in Soil Science and Plant Analysis., 2023, 54(20), 2782-2799.
CrossRef - Hulage, R. P.; Thakare, R. S.; Kamble, B. M.; Shelke, S. R., Evaluation of nutrient potential in compost prepared using various weed species. Journal of Agriculture Research and Technology., 2025, 50(3), 330–333.
CrossRef - Franzluebbers, A. J.; Doraiswamy, P. C., Carbon sequestration and land degradation. In Climate and land degradation. Berlin, Heidelberg: Springer Berlin Heidelberg, 2007, 343-358.
CrossRef - Gil, C.; Tucker, K.; Victores, S.; Lin, Y.; Obreza, T.; Maltais-Landry, G., Nitrogen and Carbon Mineralization from Organic Amendments and Fertilizers Using Incubations with Sandy Soils. Agriculture, 2024, 14, 2009.
CrossRef - Heikkinen, J.; Regina, K.; Tuomi, M.; Peltoniemi, M., Increasing temperature and precipitation at the same time can cause a significant soil organic carbon loss. Global Change Biology., 2022, 28(13), 3960–3973.
CrossRef - Wang, X.; Dalal, R. C.; Li, T.; Zhang, H. L.; Dang, Y. P., Temperature sensitivity of soil organic carbon mineralization in response to long-term fertilization in a subtropical paddy soil. Agriculture, Ecosystems & Environment., 2025, 397, 110099.
CrossRef - Meyer, V. D.; Köhler, P.; Smit, N.T.; Lipp, J. S.; Wei, B.; Mollenhauer.; Schefuß, E., Dominant control of temperature on (sub-) tropical soil carbon turnover. Nature Communications., 2025, 16, 4530.
CrossRef
 PlumX:
  Views: 452 Views
  PDF Downloads: 33
 Accepted on: 02 Mar 2026
Second Review by: Dr. Ramesh Bhargaw
Final Approval by: Dr. Tawkir Sheikh


ISSN Online: 2231-5039