Synthesis, Characterization and Density Functional Theory (DFT) Studies of S-benzyl β-N-(4-NN bischloroaminophenylmethylene) dithiocarbazate
 , Prashant Shrivastava2and Mahendra Singh Bhadauriya3
1Department of Chemistry, Institute of Technology and Management, Gwalior, MP, India
2Department of Chemical Engineering, Institute of Technology and Management, Gwalior, MP, India
3Department of Mathematics, Institute of Technology and Management, Gwalior, MP, India
Corresponding author E-mailrajeev.singh@itmgoi.in
DOI : http://dx.doi.org/10.13005/ojc/410217
Download this article as:
![]()
This research focused on the synthesis and analysis of a novel compound, S-benzyl β-N-(4-NN bischloroaminophenylmethylene)dithiocarbazate (SBCDTC). A range of analytical techniques, including mass spectrometry, nuclear magnetic resonance (NMR), infrared spectroscopy (IR), and density functional theory (DFT) quantum chemical calculations, were employed to explore its structure and properties. The molecular structure of SBCDTC was optimized using the DFT method with the 6-311G(2d,2p) basis set. Vibrational frequencies were also calculated at the same theoretical level for comparison with experimental infrared data. Furthermore, the electrostatic surface potential and electronic properties of the molecule were analyzed to gain insights into its electronic structure and potential reaction sites. A comparison between experimental results from the spectroscopic techniques and the theoretical calculations showed good agreement, validating the computational approach. This study provided a comprehensive understanding of the structural and electronic properties of SBCDTC through a combined experimental and theoretical investigation.
KEYWORDS:benzyl β-N-(4-NN bischloroaminophenyl methylene)dithiocarbazate; DFT; HOMO; LUMO; MEP surface
Introduction
The biological characteristics and possible applications of dithiocarbazic acid and its derivatives have piqued great interest in study1-11. To create, describe, and assess these chemicals’ biological actions, an enormous amount of research has been done. It has been noted that the biological characteristics of dithiocarbazate derivatives can be altered by adding substituents to the side chain12,13. Beyond the biological and pharmacological investigations, there is a need to explore the structural and reactivity aspects of these compounds through theoretical studies. Such theoretical insights can facilitate further advancements in bioinformatics, chemoinformatics, and computer-aided drug design. In the present research, the authors have undertaken an experimental and theoretical study to characterize the compound S-benzyl β-N-(4-NN bischloroaminophenylmethylene)dithiocarbazate (SBCDTC), a dithiocarbazate derivative.
To validate the theoretical approach, the optimized molecular structure and theoretically computed vibrational data of SBCDTC were collected and compared with experimental results. This combined experimental and computational investigation aims to provide a comprehensive understanding of the structural and spectroscopic properties of SBCDTC, contributing to the broader knowledge base of dithiocarbazate derivatives and their potential applications.
Material and Method
Reagents from Sigma-Aldrich and Merck Chemicals (India) were used directly in the synthesis without further purification. Instrumental analysis was carried out using the facilities at CDRI Lucknow, STIC Chochin, SAIF-CSIR, and ITM University Gwalior. ESI+ mass spectra were acquired with an Agilent 6520 Q-TOF mass spectrometer, while FAB mass spectra were recorded using a JEOL SX 102/DA 6000 mass spectrometer. FTIR spectra were obtained with the RXI and Spectrum II spectrometers from Perkin Elmer. 1H NMR spectra were recorded on Bruker Avance DRX 200 and Bruker AV III HD model FT NMR spectrometers. DFT calculations were performed using the ORCA computational chemistry package (version 3.0.3) with the 6-311G(3df, 3pd) basis set.
Synthesis of Benzyl 2-(4-(bis(2-chloroethyl)amino)benzylidene)hydrazinecarbodithioate (SBCDTC)
Separate ethanolic solutions of 4-(bis(2-chloroethyl)amino)benzaldehyde (benzaldehyde nitrogen mustard) and S-benzyl dithiocarbazate were prepared, then combined in a 1:1 molar ratio. Additional ethanol was introduced to ensure a uniform mixture, which underwent refluxing on a water bath for approximately 1 hour. A pale yellow, coarsely crystalline solid product formed after the mixture was refluxed and then allowed to cool overnight. After filtering and repeatedly washing the solid mass with ethanol to get rid of contaminants, it was allowed to air dry. Further purification was achieved through recrystallization from ethanol. Finally, the purified SBCDTC compound was stored under reduced pressure in a calcium chloride desiccator to prevent moisture absorption.
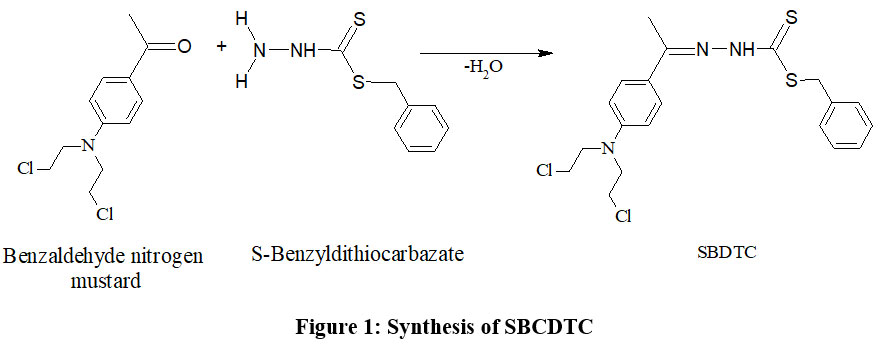 |
Figure 1. Synthesis of SBCDTCClick here to View Figure |
Yield-70%; m.p. 1450C. Spectroscopic results for C19H21Cl2N3S2: IR (KBr), ν (cm-1): ~ 3050 s, 2970 s, 1604.7 s, 1558 m, 1508 s, 1454 m, 1423 m, 1396 m, 1338 m, 1254 m, 1177 m, 1092 m, 1022 m, 814 w, 779 w, 714 w, 644 w, 520 w; 1H1NMR (200 MHz, CDCl3), δ: 1.2909 (0.1H, s), 3.6803-3.8194 (8H, m), 4.6012 (2H, s), 6.6762-6.7202 (2H, d), 7.3038-7.4071 (3H, m), 7.4569-7.4918 (2H, d), 7.6136-7.6573 (2H, d), 7.8107 (1H, s) and 10.4067 (0.9H, s); FAB Mass m/z: 426.3 (100%), 428 (100%)
Reseult and Discussion
There is a thione group (C=S) with a neighbouring proton in the SBCDT molecule. Similar cases report that the thione group (C=S) is less stable in its monomeric state and frequently experiences thiolization, which forms a more stable C-S bond14. The distinctive vS-H stretching band about 2570 cm-1 is absent from the vibrational spectrum of SBCDT; however, νN-H modes are visible at about 3050 cm-1 and 2970 cm-1 as shown in figure 3(a). This finding implies that in the solid state, thione tautomeric form predominates. Figure 3(b) shows the 1H-NMR spectra of SBCDT in CDCl3, which shows an equilibrium between the thione and thiol tautomeric forms of the compound in solution. The existence of the –NH-C=S proton (δ = 10.41) and the –N=C-SH proton (δ = 1.66) supports this equilibrium. Calculations based on the proton signals indicate that the thione form is predominant, with a thione:thiol ratio of approximately 9:1 in solution (Figure 2).
In summary, while SBCDT exists predominantly in the thione tautomeric form in the solid state, it exhibits an equilibrium between the thione and thiol forms in solution, with the thione form being favored at a ratio of 9:1.
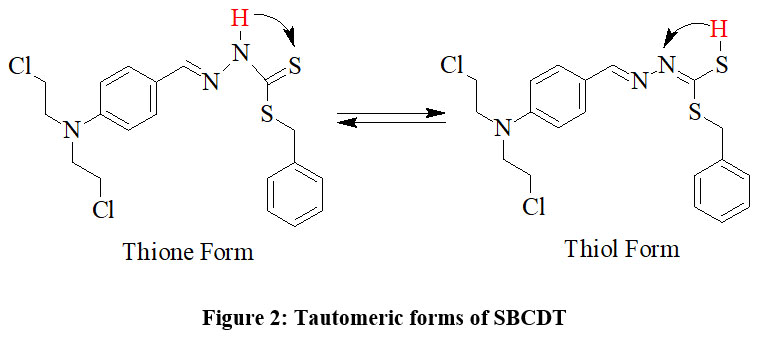 |
Figure 2: Tautomeric forms of SBCDTClick here to View Figure |
Optimized Structure
Since the molecular parameters are controlled by the molecular geometry, the crucial step for the calculation of IR spectra is the geometry optimization of the molecule. The optimized structural parameters such as bond length and bond angle of S-benzyl β-N-(4-NN bischloroaminophenyl methylene)dithiocarbazate calculated by DFT/B3LYP method with 6-311G(3df,3pd) basis sets are presented in Table 1 in accordance with atom numbering schemes given in Fig 4. According to the literature, the perfect experimental geometrical parameters of the molecule are not obtainable. Hence closely correlated molecules XRD data are taken for the comparison 15,16. Table 1 presents the bond parameters determined through both DFT and XRD methods.
The optimized structure yielded reasonably accurate bond lengths calculated by the DFT method. The bond lengths N7-C15 and N7-C8 were found to be a little longer because the N7 atom has large groups bonded to it. Most of the calculated bond angles deviated less than 2° from the experimental values, except for the C8-C9-Cl13 angle. This observation suggests that the DFT method is reliable in reproducing bond angles accurately.
To further evaluate the accuracy of the DFT method, experimental values were compared to the calculated values, and the regression coefficients were determined (Figures 5a and 5b). The regression coefficients for bond lengths and bond angles were found to be 0.9483 and 0.977, respectively. This demonstrates a strong correlation between the experimental and theoretical values. It is worth noting that some optimized parameters slightly exceed the experimental values. This discrepancy may result from the fact that experimental measurements were made for the solid phase while theoretical calculations were carried out for the gas phase. Nevertheless, these calculated geometric parameters provide a reliable approximation, serving as a basis for deriving other properties, such as thermodynamic and vibrational frequencies.
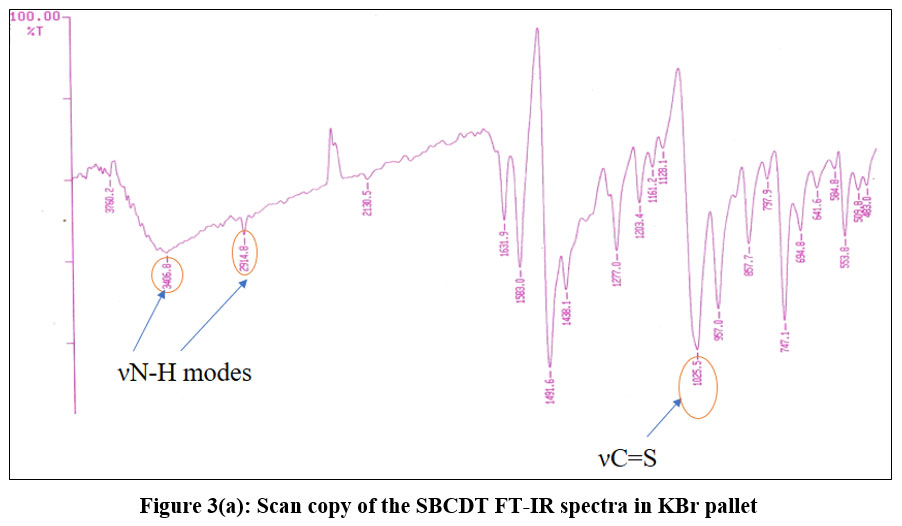 |
Figure 3(a): Scan copy of the SBCDT FT-IR spectra in KBr pallet .Click here to View Figure |
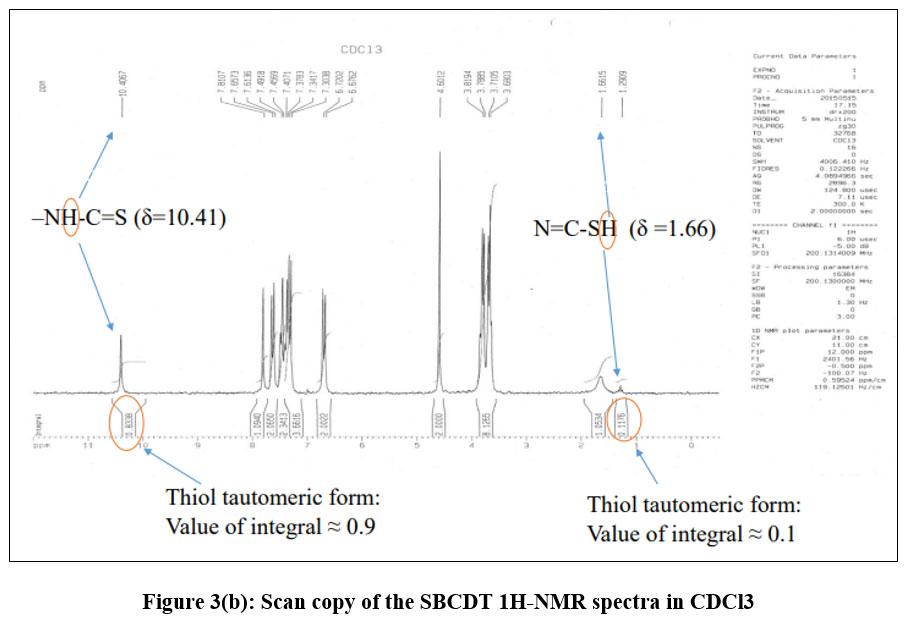 |
Figure 3(b): Scan copy of the SBCDT 1H-NMR spectra in CDCl3.Click here to View Figure |
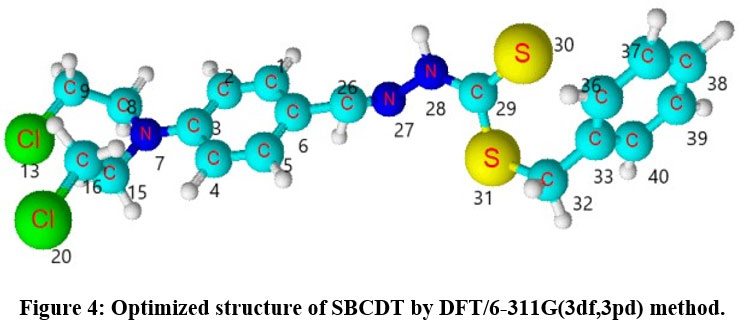 |
Figure 4: Optimized structure of SBCDT by DFT/6-311G(3df,3pd) method.Click here to View Figure |
Table 1: Geometric parameters for the thione form of SBCDT obtained by DFT/6-311G(3df,3pd)
| Bond Length (Ǻ) | bond angles (0) | ||||
| Exp. | DFT | Exp. | DFT | ||
| C1-C2 | 1.374 | 1.384 | C1-C2-C3 | 120.9 | 121.0 |
| C2-C3 | 1.377 | 1.409 | C2-C3-C4 | 116.8 | 116.9 |
| C3-C4 | 1.402 | 1.414 | C3-C4-C5 | 121.3 | 121.4 |
| C4-C5 | 1.367 | 1.379 | C4-C5-C6 | 121.9 | 121.5 |
| C5-C6 | 1.388 | 1.402 | C5-C6-C1 | 117.2 | 117.2 |
| C6-C1 | 1.440 | 1.398 | C2-C3-N7 | 121.9 | 121.6 |
| C3-N7 | 1.443 | 1.391 | C4-C3-N7 | 121.3 | 121.4 |
| N7-C8 | 1.367 | 1.456 | C3-N7-C8* | 122.4 | 122.7 |
| C8-C9* | 1.498 | 1.529 | N7-C8-C9* | 112.4 | 112.6 |
| C9-Cl13* | 1.877 | 1.916 | C8-C9-Cl13* | 105.2 | 107.2 |
| N7-C15 | 1.388 | 1.456 | C3-N7-C15 | 120.3 | 121.1 |
| C15-C16* | 1.472 | 1.529 | N7-C15-C16* | 116.8 | 117.6 |
| C16-Cl20* | 1.768 | 1.816 | C15-C16-Cl20* | 115.3 | 117.2 |
| C6-C26 | 1.447 | 1.452 | C1-C6-C26* | 119.4 | 119.6 |
| C26-N27 | 1.274 | 1.284 | C5-C6-C26* | 123.7 | 123.1 |
| N27-N28 | 1.388 | 1.360 | C6-C26-N27* | 124.1 | 123.2 |
| N28-C29 | 1.324 | 1.356 | C26-N27-N28 | 114.0 | 115.9 |
| C29-S30 | 1.611 | 1.667 | N27-N28-N29 | 122.4 | 123.1 |
| C29-S31 | 1.742 | 1.758 | N28-C29-S30 | 120.5 | 121.3 |
| S31-C32 | 1.817 | 1.868 | N28-C29-S31 | 114.6 | 115.6 |
| C32-C33 | 1.498 | 1.503 | S30-C29-S31 | 124.0 | 125.8 |
| C33-C36 | 1.373 | 1.397 | C29-S31-C32 | 102.4 | 103.8 |
| C36-C37 | 1.405 | 1.389 | S31-C32-C33 | 107.6 | 107.1 |
| C37-C38 | 1.344 | 1.392 | C32-C33-C36 | 122.2 | 120.8 |
| C38-C39 | 1.328 | 1.390 | C33-C36-C37 | 120.0 | 120.6 |
| C39-C40 | 1.368 | 1.390 | C36-C37-C38 | 120.0 | 120.1 |
| C40-C33 | 1.360 | 1.396 | C37-C38-C39 | 120.6 | 119.8 |
| C38-C39-C40 | 119.8 | 120.1 | |||
| C39-C40-C33 | 122.8 | 123.7 | |||
| C40-C33-C32* | 121.0 | 121.5 | |||
| r2 | 0.9483 | 0.977 | |||
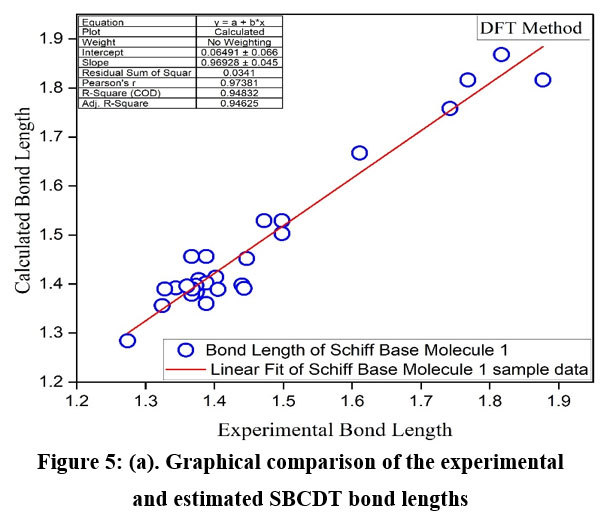 |
Figure 5(a): Graphical comparison of the experimental and estimated SBCDT bond lengths.Click here to View Figure |
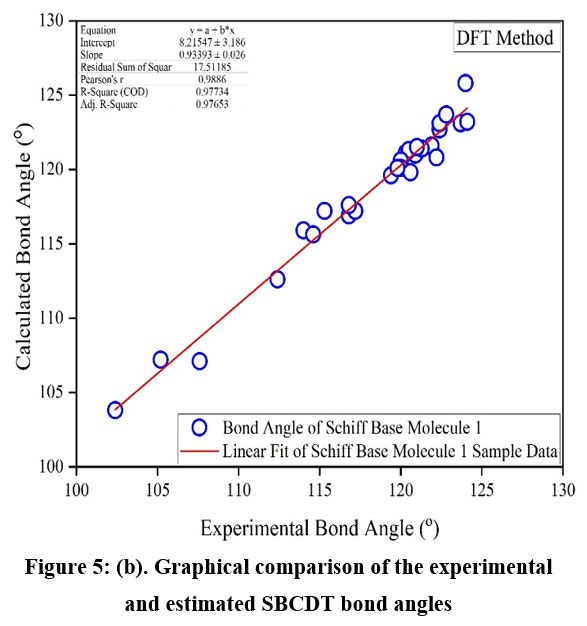 |
Figure 5(b): Graphical comparison of the experimental and estimated SBCDT bond angles.Click here to View Figure |
Vibrational frequencies
The DFT/B3LYP method was employed to calculate the harmonic vibrational frequencies of SBCDT, using the 6-311G(3df,3pd) basis set. Table 2 provides a comparison of selected vibrational frequencies from the infrared (IR) spectra of SBCDT, both experimentally and theoretically determined. Due to the large size and symmetry of the molecules, many vibrations are challenging to interpret, particularly those involving the combined motion of multiple parts or groups. As some of the vibrations observed in the experimental solid-state spectra did not match the simulated spectra, they were excluded from consideration. The differences between computed and observed frequencies can be attributed to factors such as anharmonicity, intermolecular interactions, approximations in accounting for electron correlation effects, and limitations of the basis set. We evaluated the effectiveness of the computational method for infrared prediction by establishing a correlation between the experimental and calculated wavenumbers. This involved plotting and analyzing the correlation coefficients between the experimental and calculated values. The graphical representation of the relationship between the predicted fundamental vibration frequencies and the experimental values is shown in Figure 6. A strong linear correlation was observed between the estimated and experimental vibrational frequencies, with a regression coefficient (r²) value of 0.99272. This high correlation indicates that the DFT/B3LYP method, using the 6-311G(3df,3pd) basis set, provides reliable predictions of vibrational frequencies for the SBCDT molecule, despite the inherent approximations and limitations.
Table 2: Vibrational frequencies of SBCDT
| Experimental Wave no. in cm-1 | Theoretical Wave no. in cm-1 | Vibrational frequency Assignments |
| 3050 | 3213.79 | ν N-H2 vibration |
| 2970 | 3097.20 | ν N-H vibration |
| 2858.3 | 3026.59 | Methyl symmetric stretching vibrations |
| 1604.7 | 1639.21 | C=C aromatic and thioureide C=N stretching vibrations |
| 1558.4 | 1557.50 | C=N stretching vibrations coupled with N-H in a plane |
| 1508.2 | 1522.69 | Aromatic C=C-C stretching vibrations |
| 1423 | 1428.56 | C=S ν, Methyl asymmetric deformation vibrations |
| 1396.4 | 1388.03 | C-N stretching vibrations |
| 1338.5 | 1350.06 | ν Ar C-N, Methyl symmetric deformation vibrations |
| 1253.6 | 1240.92 | N-H out of plane vibrations |
| 1176.5 | 1204.56 | ν C=S stretching vibrations, NCS deformation vibrations, C-S stretching vibrations |
| 1091.6 | 1121.35 | ν C=S , Aromatic in plane C-H bending |
| 1022.2 | 1026.96 | ν N-N stretching vibrations, -CH3 rocking, CSS stretching vibrations |
| 814 | 834.70 | ν C-Cl |
| 779 | 735.92 | Aromatic out of plane C-H bending |
| 714 | 713.85 | Out of plane ring deformation mode |
| 644.2 | 651.43 | ν S-C, Symmetric -CH3 stretching vibrations |
| 520.7 | 637.20 | N-H oop β, out of plane ring deformation vibrations |
| r2 | 0.99272 |
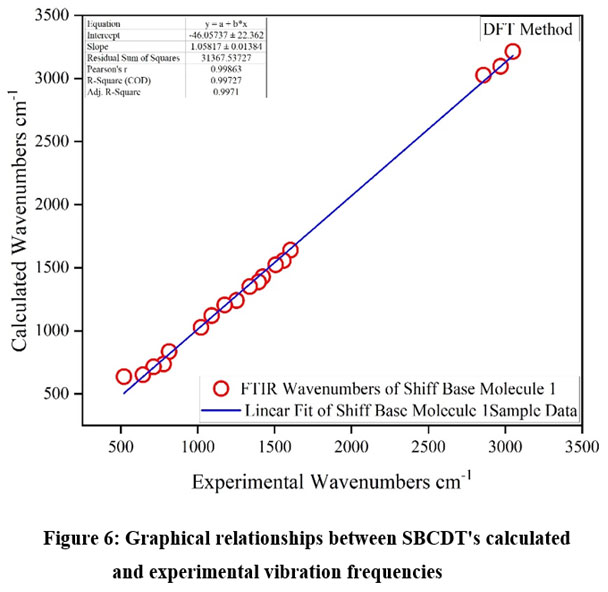 |
Figure 6: Graphical relationships between SBCDT’s calculated and experimental vibration frequencies.Click here to View Figure |
Natural population analysis
Population analysis reveals the charge distribution within a molecule, which influences various molecular properties such as the dipole moment, molecular polarizability, and electronic structure. The natural population analysis of the SBCDT molecule was performed at the 6-311G(3df, 3pd) level using the DFT method. The results are presented in Table 3. Mulliken atomic charges are crucial in quantum chemical computations of molecular systems, as they directly affect the charge distribution and, consequently, the molecular properties mentioned earlier. Based on the DFT calculations, the most negative charges are predicted to reside on the N7 and N28 atoms, while the most positive charge is predicted on the S31 atom. The charge distribution is visually depicted in the histogram for the Natural Population Analysis Charge, shown in Figure 7. The natural population analysis offers valuable insights into the electron density distribution within the SBCDT molecule, highlighting areas of high negative and positive charges. This information is crucial for understanding the molecule’s reactive sites, intermolecular interactions, and other properties that are influenced by the charge distribution.
It is important to note that the accuracy of the predicted charges depends on the level of theory and the basis set used in the calculations. Nonetheless, the natural population analysis serves as a valuable tool for gaining insights into the electronic structure and chemical behavior of the SBCDT molecule.
Table 3: Population analysis results of BCBHC for DFT/6-311G(2d,2p) method calculation
| Atom | Electron Population | Natural minimal basis Population | Natural Population Analysis Charge |
| C1 | 6.14568 | 6.12875 | -0.14568 |
| C2 | 6.26413 | 6.24795 | -0.26413 |
| C3 | 5.79833 | 5.77800 | 0.20167 |
| C4 | 6.25470 | 6.23895 | -0.25470 |
| C5 | 6.13757 | 6.12037 | -0.13757 |
| C6 | 6.12953 | 6.11124 | -0.12953 |
| N7 | 7.45959 | 7.44362 | -0.45959 |
| C8 | 6.19027 | 6.16632 | -0.19027 |
| C9 | 6.32190 | 6.30254 | -0.32190 |
| Cl13 | 17.08063 | 17.06076 | -0.08063 |
| C15 | 6.19066 | 6.16669 | -0.19066 |
| C16 | 6.32179 | 6.30253 | -0.32179 |
| Cl20 | 17.0802 | 17.06031 | -0.08020 |
| C26 | 5.91993 | 5.89182 | 0.08007 |
| N27 | 7.28178 | 7.25009 | -0.28178 |
| N28 | 7.39499 | 7.36917 | -0.39499 |
| C29 | 6.10320 | 6.05803 | -0.10320 |
| S30 | 16.15274 | 16.11291 | -0.15274 |
| S31 | 15.68253 | 15.62985 | 0.31747 |
| C32 | 6.48641 | 6.46593 | -0.48641 |
| C33 | 6.05498 | 6.03650 | -0.05498 |
| C36 | 6.18947 | 6.17098 | -0.18947 |
| C37 | 6.18786 | 6.17041 | -0.18786 |
| C38 | 6.19346 | 6.17602 | -0.19346 |
| C39 | 6.18908 | 6.17156 | -0.18908 |
| C40 | 6.19495 | 6.17670 | -0.19495 |
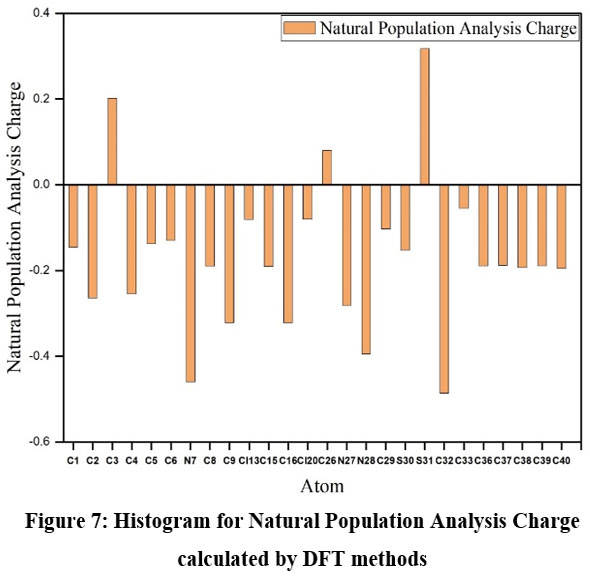 |
Figure 7: Histogram for Natural Population Analysis Charge calculated by DFT methods.Click here to View Figure |
Molecular electrostatic potential (MEP) surface analysis
The molecular electrostatic potential (MEP) surface is an essential tool for visualizing the distribution of electronic density within a molecule. It provides valuable information about regions prone to electrophilic attacks, nucleophilic reactions, and hydrogen-bonding interactions, helping to identify reactive sites17,18. In this study, we calculated the molecular electrostatic potential (MEP) of SBCDT using density functional theory (DFT). The optimized structure was obtained at the B3LYP/6-311G(3df,3pd) level of theory. Figure 8 presents the 3D isosurface plot of the MEP for SBCDT. In this representation, red areas highlight regions susceptible to electrophilic attack, while blue areas indicate regions prone to nucleophilic attack. The MEP surface of SBCDT shows negative potential regions primarily located on the nitrogen, sulfur, and chlorine atoms. In the SBCDT molecule, the electrophilic potential of the sulfur and chlorine atoms is lower than that of the nitrogen atom, indicating that the nitrogen atom is more vulnerable to electrophilic attack. The MEP analysis offers valuable insights into the reactivity and potential intermolecular interactions of the SBCDT molecule. By identifying regions of high and low electrostatic potential, it enables the prediction of sites most likely to engage in various chemical reactions and non-covalent interactions, such as hydrogen bonding or electrostatic interactions.
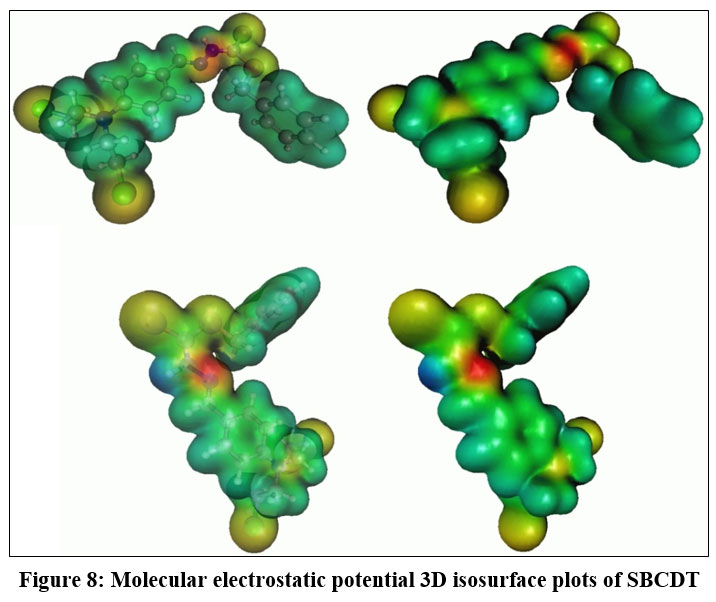 |
Figure 8: Molecular electrostatic potential 3D isosurface plots of SBCDT.Click here to View Figure |
Conclusion
The SBCDT compound was thoroughly characterized using a combination of spectroscopic techniques and computational methods. The molecular geometry of SBCDT was optimized using density functional theory (DFT) at the B3LYP/6-311G(3df,3pd) level. Experimental analysis was performed using Fourier-transform infrared (FT-IR) spectroscopy, and the recorded wavenumbers showed strong agreement with the calculated IR frequencies from the theoretical data. 1H-NMR and IR spectroscopy studies indicate that in the solid state, the thione tautomer predominates, while in solution, an equilibrium exists between the thione and thiol tautomers. Molecular electrostatic potential (MEP) surface analysis, based on the optimized molecular structure, provides valuable insights into the reactive sites of the SBCDT molecule. The MEP analysis identified the N27-N28 atom pair as a potential site vulnerable to electrophilic attack. This combined experimental and computational approach allowed for a comprehensive understanding of the structural, spectroscopic, and electronic properties of the SBCDT compound. The complementary information obtained from various techniques and theoretical calculations enabled the elucidation of the tautomeric behavior, vibrational modes, and reactive sites within the molecule. The study demonstrates the power of integrating experimental methods with computational tools in unraveling the intricate details of molecular systems, paving the way for potential applications in areas such as drug design, material science, and catalysis.
Acknowlegement
This research was carried out with the financial support of the MPCST. Bhopal India.
Funding Sources
The author(s) received no financial support for the research, authorship, and/or publication of this article.
Conflict of Interest
The author(s) do not have any conflict of interest.
Data Availability Statement
This statement does not apply to this article.
Ethics Statement
This research did not involve human participants, animal subjects, or any material that requires ethical approval.
Reference
- Ali M. A.; Mirza A. H.; Butcher R. J.; Bernhardt P. V. Polyhedron2011, 30, 1478–1486.
CrossRef - Li M. X.; Zhang L. Z.; Chen C. L.; Niu J. Y.; Ji B. S. J. Biochem.2012, 106, 117–125.
CrossRef - Ali M. A.; Mirza A. H.; Ting W. Y.; Hamid M. H. S. A.; Bernhardt P. V.; Butcher R. J. Polyhedron2012, 48, 167–173.
CrossRef - Ali M. A.; Mirza A. H.; Mei C. C.; Bernhardt P. V.; Karim M. R. Polyhedron2013, 49, 277–283.
CrossRef - Dani R. K.; Bharty M. K.; Kushawaha S. K.; Prakash O.; Sharma V. K.; Kharwar R. N.; Singh R. K.; Singh N. K. Polyhedron2014, 81, 261–272.
CrossRef - Hamid M. H. S. A ; Said A. N. A. H.; Mirza A. H.; Karim M. R.; Arifuzzaman M.; Ali M. A.; Bernhardt P. V. Chim. Acta.2016, 453, 742–750.
CrossRef - Low M. L.; Maigre L.; Tahir M. I. M.; Teikink E. R. T.; Dorlet P.; Guillot R.; Ravoof T. B.; Rasoli R.; Pages J. M.; Policar C.; Delsuc N.; Crouse K. A. J. Med. Chem.2016, 120, 1–12.
CrossRef - Rakshit S.; Palit D.; Hazari S. K. S.; Rabi S.; Roy T. G.; Olbrich F.; Rehder D. Polyhedron2016, 117, 224–230.
CrossRef - Pavan F. R. J. Med. Chem.2010, 45, 1898.
CrossRef - Ahmed Boshaalaa ;Bohari M. Yaminb; Younis O. Ben Amer a; Ghaith S.H. Ghaithc; Abdulla Ali Almughery d; AbdelkaderZarrouke ; Ismail Waradf Mole. Struct.2021, 1224, 129207.
CrossRef - Hazari S. K. S.; Kopf J.; Palit D.; Rakshit S.; Rehder D. Chim. Acta. 2009, 362, 1343.
CrossRef - Yazdanbakhsh M.; Takjoo R. Chem.2008, 19, 895.
CrossRef - Nunez-Montenegro A.; Carballo R.; Vazquez-Lopez E. M. Polyhedron2008, 27, 2867.
CrossRef - Mayer, R., 1967. Organosulphur Chemistry (Edited by Janssen, M.J.), 21, Interscience, New York, 42, 17.
- Fun, H.K., Sivakumar, K., Yip, B.C., Duan, Y.C., Lu, Z.L., You, Y.Z., 1995. Benzyl 3-(4-dimethylaminobenzylidene)dithiocarbazate. ActaCrystallogr., C 51, 2080.
CrossRef - L. A.Sankaraperumal, J.Karthikeyan, A.N.Shetty, CCDC 817418 Exp. Cryst. Struct. Determ. 2013 (n.d.).
- Fallah, Kh. Gholivand, M. Yousefi, P.A. Azar. J. Mol. Struct. 1173 (2018) 801–813.
CrossRef - Scrocco E., Tomasi J. Advances in Quantum Chemistry1978, Volume 11, Elsevier. Boursas , F. Berrah, N. Kanagathara, G. Anbalagan, S. Bouacida. J.Mol.Struct. 1180 (2019) 532-541
CrossRef
Accepted on: 22 Mar 2025
Second Review by: Dr. Vetriselvi Vedamanickam
Final Approval by: Dr. Ravindra M Kumbhare


![]()


