Stability Indicating Assay Method Development and Validation of Capmatinib by RP-HPLC and Characterization of its Degradation Product by LC-MS
 and Sandeep S. Sonawane
Department of Pharmaceutical Chemistry, MET’s Institute of Pharmacy, Adgaon, Nashik, Maharashtra, India.
Corresponding Author E-mail:bedadurgeajay@gmail.com
DOI : http://dx.doi.org/10.13005/ojc/410223
Download this article as:
![]()
This research creates a basic precision method to measure drug compounds of Capmatinib used for non-small cell lung cancer therapy by following International Conference on Harmonization’s (ICH) standards. This research provides a full stability indicating RP-HPLC analytical method to determine Capmatinib substance concentrations. Different stress conditions were used to test Capmatinib's stability levels. The drug substance Capmatinib reacted negatively to acid solutions and basic solutions together with peroxide exposure. The structure confirmation of decomposition products occurred using LC-MS as the analytical technique. The separation sequence of Capmatinib with its degradation products succeeded through operation of the Enable C18 Kromasil (250 × 4.6 mm; 5μ) column while using isocratic conditions. Using a mobile phase composed of Methanol and water solution (70:30% v/v) the analysis of Capmatinib ran for 3.75 minutes at 1.0 mL/min flow rate under UV detection at 233 nm during temperature regulation at 40°C. The measurement of Capmatinib required an LOD value set at 1.321 µg/ml while achieving an LOQ value of 4.002 µg/ml. The proposed method achieved testing accuracy through recovery tests which yielded results within 98.0% to 102.0%. The %RSD values for Capmatinib determination in repeatability tests satisfied the established requirements thus ensuring accurate measurement outcomes. The validation of this procedure followed all requirements from ICH Q2 (R1). The proposed system demonstrates accuracy while being reliable and time-efficient without producing high operational costs.
KEYWORDS:Capmatinib; Forced degradation; LC-MS; Non-small Cell Lung Cancer; RP-HPLC; Validation
Introduction
NSCLC represents the primary lung cancer type among all cases at approximately 85% and doctors detect this malignancy mainly when it reaches an advanced stage 1. Two aspects such as advanced diagnostic technologies including low dose computerized tomography screening and public education about symptoms could lead to earlier detection of NSCLC. NSCLC contains two primary cell types within its histological breakdown which consist of adenocarcinoma and large-cell carcinoma while squamous cell carcinoma and NSCLC not otherwise specified fit into these categories as well.2
Capmatinib (INC280) works as an orally administered powerful selective MET-trajectory blocking medication that demonstrates its effectiveness at stopping MET signaling in laboratory testing and animal testing [2]. The pharmaceutical agent Capmatinib shows promising potential as a new therapeutic choice for patients who have NSCL that is affected by MET dysregulation3
The nationwide United States gave its first worldwide authorization for oral Capmatinib as NSCLC treatment during metastatic stages in adults The drug works for patients whose cancer cells demonstrate MET exon 14 skipping mutations based on a diagnostic assessment approved by the FDA in May 2020.4
The pharmaceutical compound Capmatinib presents itself as C23H17FN6O in chemical form. The medical compound calcium dobesilate adopts the IUPAC name N-Methyl-2-fluoro-4-[7-(quinolin-6-ylmethyl) imidazo[1,2-b][1,2,4]triazin-2-yl]benzamide.5
 |
Figure 1: Structure of Capmatinib |
The RP-HPLC method was developed by Dhone, S. et al. to estimate Capmatinib through forced degradation tests. Here, CMT was exposed to oxidative, photolytic, alkaline, acidic, and thermal environments; under each of these, it was observed to degrade. However, the degradants were not characterized.6
Bhangare et al used ultra-high-performance liquid chromatography to analyse Capmatinib degradation subjected to acid, base, photolytic stress with stability in thermal and peroxide environments.7
According to our thorough literature review, no mass studies on the degradation products of Capmatinib have been carried out, nor have any RP-HPLC methodologies been described for the medication in API or bulk form. Therefore, in accordance with ICH requirements, the present work introduces a new method that provides sensitive, straightforward and accurate measurements for Capmatinib in API utilizing RP-HPLC isocratic conditions. The degradation product is identified and described using LC-MS.8
Material and Methods
Experimental
The Jasco UV 550 UV-visible spectrophotometer operated with Spectra Manager software served for testing purposes. An Agilent 1260 Infinity II combined with OpenLab EZ Chrome software and Rheodyne 7725I installed the injector (20 µL loop) to build the HPLC system. A Thermo Fisher Lab Discovery Quantum Max LC system paired with its 410 auto-sampler and 500 MS Ion trap detector performed analysis by scanning m/z values from 50–2000. The Aczet CY224C weighing process utilized an analytical balance with a range of 10mg to 220gm under the control of LC-Quan Quadra pole technique chromatography software. The smooth dissolution required the use of Bio-technic 13.5ltr Ultra-Sonicator.
Chemicals and Reagents
For laboratory purposes the research acquired HPLC-grade water and methanol from Merck Mumbai India. The purest form of deionized water from Siddhi Lab reached HPLC grade purity standards.
Methods
Knowing the drug’s solubility, absorptivity, and wavelength maximum are among its many physicochemical characteristics is usually crucial before beginning method development.9
Selection of solvent
Determination of solubility
The solubility was determined in Water and methanol at a concentration of 3mg/mL as follows
Water: Weighed about 30 mg of Campatinib and sonicated for 5-10 minutes to dissolve in 10 ml of Water.
Methanol
Weighed about 30 mg of Campatinib and sonicated for 5-10 minutes to dissolve in 10 ml of Methanol.
The investigation demonstrated that Capmatinib shows solubility in methanol while manifesting insolubility in water so researchers utilized methanol as the diluent for preparing stock solution.
Selection of wavelength
Methanol functioned as the diluent for stock solution preparation until the standard solution received 10 mg Campatinib HCl which dissolved in 20 mL methanol (500 PPM Campatinib HCl). A Pipette extracted 0.2 mL stock solution out of the Campatinib HCl solution which received subsequent dilution to 20 mL with methanol to create a 5 PPM Campatinib HCl solution. A spectral analysis of both the methanol blank and the Campatinib drug solution took place between 800 nm and 200 nm. The absorption peaks of Campatinib HCl reached maximum values at 382 nm, 317 nm and 233 nm and 205 nm. The absorbance values at 382 and 317 nm stand significantly lower than the values measured at 233 nm. Due to the solvent’s cut off wavelength limit, 205 nm proves unsuitable for selection. Therefore, 233 nm became the chosen analytical wavelength for continued analysis.
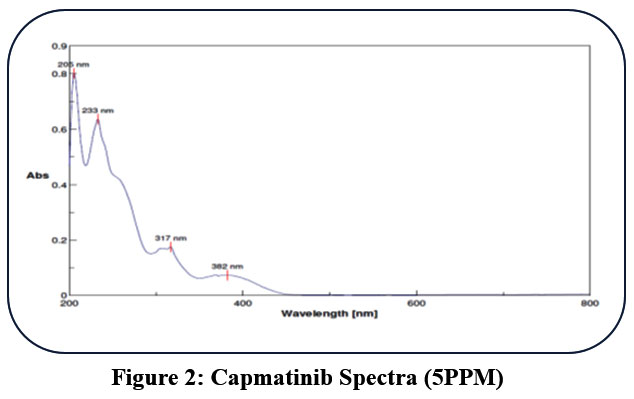 |
Figure 2: Capmatinib Spectra (5PPM). |
Chromatographic Conditions
A Phenomenex ChromClone C18 column (250 mm × 4.6 mm, 5 µm) completed the entire run of Campatinib HCl within 3.88 minutes at a 1.0 mL/min flow rate through its contact with a static mobile phase of 70:30 methanol to water ratio v/v. Under optimization conditions at 40 degrees Celsius the column delivered a symmetric peak with 1.22 value and 9,176 theoretical plates as well as a clear peak result. The detection operated through 233.0 nm during the injection process of 20 µL per injection (Figure 3).
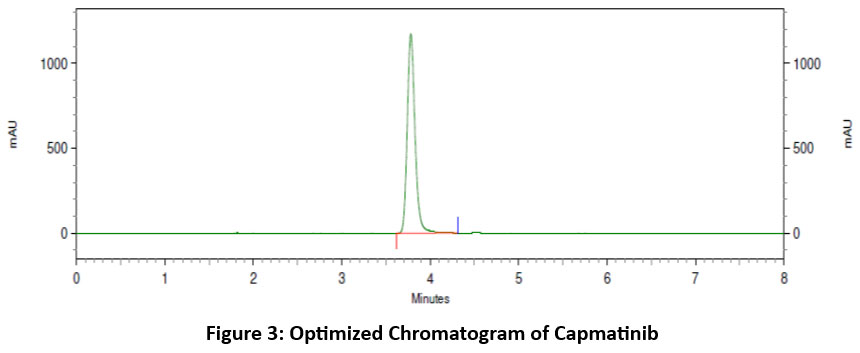 |
Figure 3: Optimized Chromatogram of Capmatinib. |
Forced degradation studies
The analyses followed ICH guidelines (8) to perform required stress tests under acid, base, oxidative, photolytic and thermal condition. The normal procedure in degradation tests sets API test concentration to 0.1 mg/mL at 100 ppm concentrations.10,11
Acid hydrolysis
About 20 mg of Campatinib API received weight measurement before the transfer into a 20 mL volumetric flask. The solution required sonication for dissolving the complete amount of API after adding 15 mL methanol. Added 2 mL of 5 N HCl. The sample solution rested on the bench for thirty minutes. The reaction received 2 mL of 5 N NaOH solution as a neutralization agent after the 30-minute reaction period. The solution was adjusted to the mark using methanol as the volume expander. (About 1000 ppm of stock). The prepared stock solution received 1 mL dilution with mobile phase until reaching a volume of 10 mL (equivalent to 100 ppm Campatinib).
Base hydrolysis
The Campatinib API required 20 mg measurement from experienced researchers before the transfer to the 20 mL volumetric flask. The combination of 15mL methanol with the API under sonication treatment led to adequate solution mixing. Added 2 mL of 5 N NaOH. The experts left the sample to sit on the bench for one continuous hour duration. The reaction became neutralized through adding 2 mL 5 N HCl solution after one hour passed. A volumetric mark was reached by adding the solution with methanol. (About 1000 ppm of stock). Gritdin Paranoia diluted its stock solution using mobile phase until reaching a 10 mL final volume which yielded 100 ppm drug concentration (About 100 ppm of Campatinib).
Oxidative studies
A 20 mg quantity of Campatinib API was placed within a 20 mL volumetric flask. The mixture of 15 mL methanol dissolved the API under sonication to achieve complete blending. Added 2 mL of 5 N NaOH. After one hour the scientists left the sample to sit on the bench. Scientists brought the solution to volume by using methanol during the 24-hour period. (About 1000 ppm of stock). A mobile phase solution diluted 1 mL of stock solution to 10 mL for preparing a sample containing 100 ppm Campatinib..
Thermal stress testing
After adding sufficient API we covered the petri dish with aluminium foil before making holes in the film using a pointed instrument. The API experienced heat treatment within hot air oven at 105º C for a duration of 72 hrs. The procedure for preparing the API involved the sample remaining in the desiccator until the room temperature returned. Twenty milligrams of Campatinib thermal treated API received weight measurement before adding it into a twenty-milliliter volumetric flask. The API became completely dissolved after adding 15 mL methanol while sonication. The solution received volume adjustment through addition of methanol. (About 1000 ppm of stock). A 1ml amount of stock solution underwent dilution to a final volume of 10ml using mobile phase solution (the concentration reached 100ppm of Campatinib)
Photo-stability
Subsequently API filling of sufficient amount was added to a petri dish which received aluminium foil coverage followed by pointed object usage to create perforations in the aluminium foil. Kept in sun light for 7 days. The testing of the sample started with its transfer to the bench top where it needed to achieve room temperature prior to the API screening procedure. A volumetric flask received 20 mg of the thermal treated Campatinib API followed by addition of 20 mL. A mixture of 15 mL methanol together with sonication led to complete dissolution of the API. The desired volume reached its mark by using methanol as the final diluting agent. (About 1000 ppm of stock). We prepared 1 mL of the stock solution by adding mobile phase to make volume reach 10 mL (resulting in 100 ppm of Campatinib concentration).
Result and Discussion
Degradation of Capmatinib in various stress conditions
Drug testing for capmatinib followed ICH guidelines through various threatening conditions including acidic and basic solutions as well as peroxide and thermal and photoactive factors (8).
Table 1: Forced degradation summary
| Sample Name | Treatment | Trial No. | Exposure condition | % Assay | % Degradation | Degradation Remark |
| API | Sample as such | Trial No. 1 | NA | 100.00 | NA | NA |
| Thermal | Trial No. 1 | 105°C for 72 Hours | 98.88 | 1.12 | Nil | |
| Photolytic | Trial No. 1 | Sunlight for 7 days | 99.4 | 0.6 | Nil | |
| Acid | Trial No. 1 | 2 mL of 5 N HCl for 24 Hours at R.T. | 24.69 | 75.31 | Degradation found | |
| Trial No. 2 | 2 mL of 5 N HCl for 30 minutes at R.T. | 89.24 | 10.76 | Degradation found | ||
| Base | Trial No. 1 | 2 mL of 5 N NaOH for 24 Hour at R.T. | 52.39 | 47.61 | Degradation found | |
| Trial No. 2 | 2 mL of 5 N NaOH for 1 Hour at R.T. | 88.83 | 11.17 | Degradation found | ||
| Peroxide | Trial No. 1 | 2 mL of 30% H2O2 for 24 hr at R.T. | 90.36 | 9.64 | Degradation found |
For acid stress condition Capmatinib was treated with 5N HCl and kept for 30 min at room temperature. percentage degradation was 10.76% with degradation peaks at retention time (R.T.) 3.75 as shown in figure
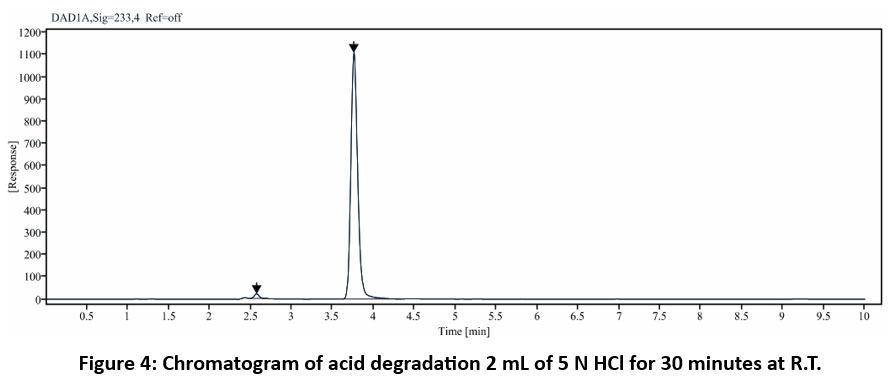 |
Figure 4: Chromatogram of acid degradation 2 mL of 5 N HCl for 30 minutes at R.T. |
Capmatinib was combined with 5N NaOH solution then left at room temperature for one hour to obtain base stress degradation data showing 11.17% degradation at R.T. 2.58 as depicted in the figure.
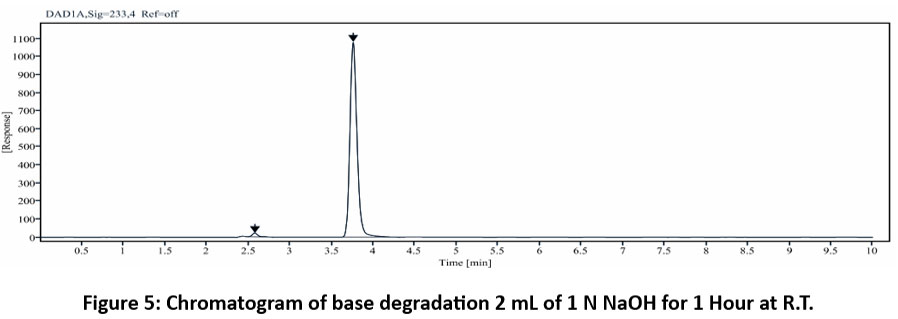 |
Figure 5 : Chromatogram of base degradation 2 mL of 1 N NaOH for 1 Hour at R.T. |
For Peroxide stress condition Capmatinib was treated with 2 mL of 30% H2O2 for 24 hours at room temperature. percentage degradation was 9.64% with two degradation peaks at R.T. 1.69 & 5.80,respectively as shown in figure .
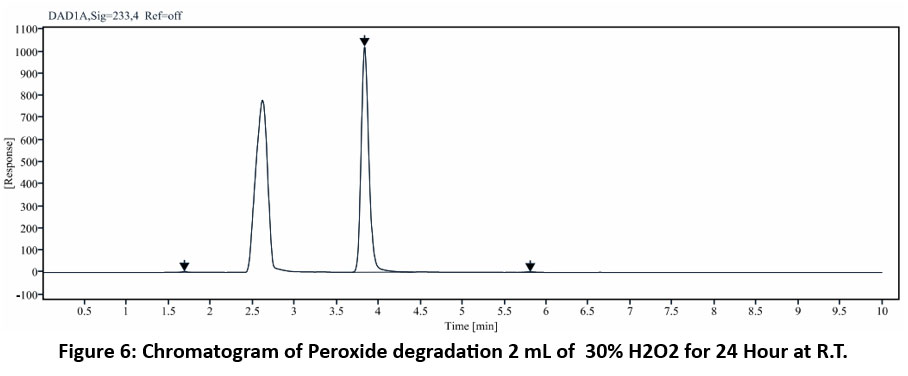 |
Figure 6: Chromatogram of Peroxide degradation 2 mL of 30% H2O2 for 24 Hour at R.T. |
The experimental procedure included placing sufficient API amount in petri dishes followed by aluminum foil placement and creating holes by using a sharp object. The setup experienced temperature-dependent stress during 72 hours at 105º C inside the hot air oven. The experimental sample underwent seventy-two hours at 105º C through treatment in a hot air oven. Percentage degradation was 1.12%.
The photolysis test involved using a petri dish to hold sufficient API while making holes with a pointed object through foil covering to expose it for seven days which led to 0.6% degradation.
hence Up to 2% degradation. Categorizing it as a variation rather than degradation since various factors which include analyst expertise alongside sample preparation practices, instrumental variability and more lead to these changes (9).
The percentage degradation was calculated by formula:
| % Assay of degraded sample = | FD Sample area | X | Sample as such wt (mg) | X | 100 |
| Sample as such Area | FD Sample wt (mg) |
봐 Capmatinib showed vulnerability to Acid, base and Peroxide stress conditions but stability under thermal and photolytic stress conditions.
Characterization of degradation Product by LC-MS
For mass spectral analysis, the column eluates were identified and studied by using LC-MS
Table 2: Data of forced degradation study by LC-MS.
| Condition | Treatment | % Assay | % Degradation | Analyte/Degradants | RT | M/Z |
| NA | NA | NA | NA | Capmatinib (Reported mass: 412.42) | NA | 413.07 |
| Acid treated | 2 mL of 5 N HCl (10% of total volume) for 30 minutes at R.T. | 89.24 | 10.76 | DP-1 | 2.57 | 338.39 |
| Base treated | 2 mL of 5 N NaOH (10% of total volume) for 1 hour at R.T. | 88.83 | 11.17 | DP-1 | 2.58 | 317.81 |
| Peroxide treated | 2 mL of 30% H2O2 (10% of total volume) for 24 hours at R.T. | 90.36 | 9.64 | DP-1 | 1.69 | 374.99 |
| DP-2 | 5.80 | 382.97 |
Acid degradation
Capmatinib showed one degradation peak during acid stress condition. Scientists identified the molecular ion peak of Capmatinib DP-1 at m/z 338.39, using the MS method for the acid-degradant sample. DP-1 also showed fragments around 397.60 (C22H15FN6O) and 373.87 (C21H14FN5O). Mass spectra of the ADP-1, are shown in figure. Structure of ADP-1 shown in figure
 |
Figure 7: Capmatinib acid degradation product 1(ADP-1) mass spectra. |
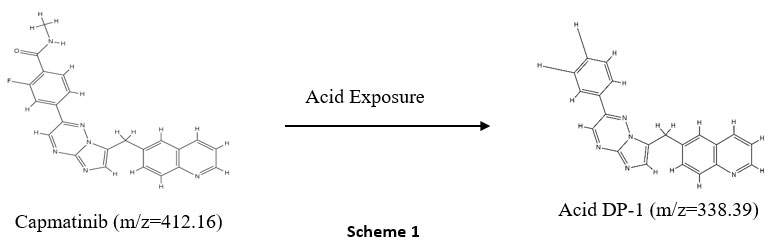 |
Scheme 1 |
Base degradation
Capmatinib showed one degradation peak during base stress condition. The molecular ion peak for Capmatinib base DP-1 was discovered at m/z 317.81, using the MS method for the base-degradant sample. Base DP-1 also showed fragments around 382.90 (C22H14FN5O), and 315.85 (C19H17N5). Mass spectra of the base DP-1, are shown in figure. Structure of base DP-1 shown in figure
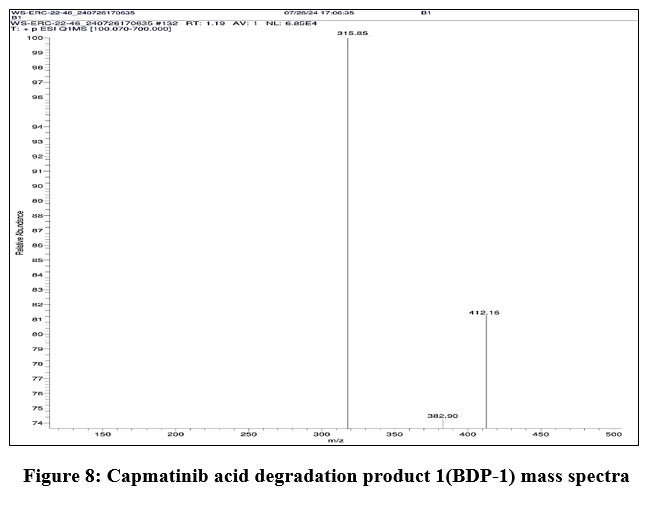 |
Figure 8: Capmatinib acid degradation product 1(BDP-1) mass spectra |
 |
Scheme 2 |
Peroxide degradation
Capmatinib showed two degradation peaks during peroxide stress condition. Laboratory MS studies identified Capmatinib peroxide DP-1 and peroxide DP-2 respectively at m/z 374.99 and 382.97 in the peroxide-degradant sample. Peroxide DP-1 also showed fragments around 396.90 (C22H15FN6O), 374.15 (C21H19FN5+), and 365.96 (C22H16N5O+). Peroxide DP-2 also showed fragments around 397.82 (C22H14FN5O2), 376.88 (C23H16N5O+), 342.31 (C22H21N5) and 339.86 (C21H15N5). Mass spectra of the peroxide DP-1 and peroxide DP-2, are shown in figure. Structure of Peroxide DP-1 and Peroxide DP-2 are shown in figure
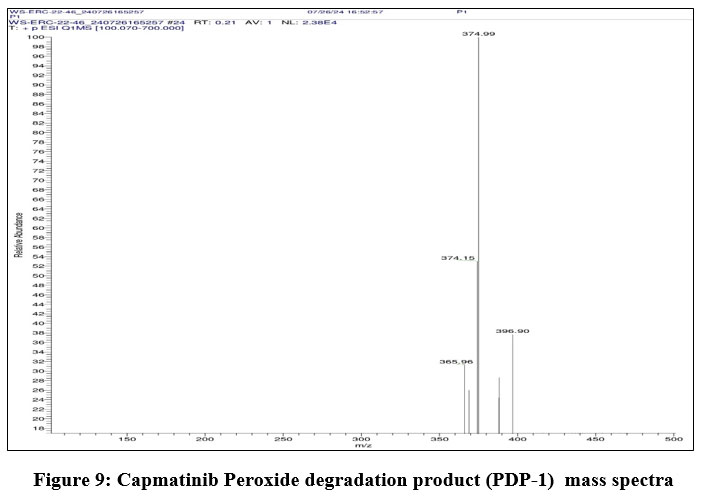 |
Figure 9: Capmatinib Peroxide degradation product (PDP-1) mass spectra |
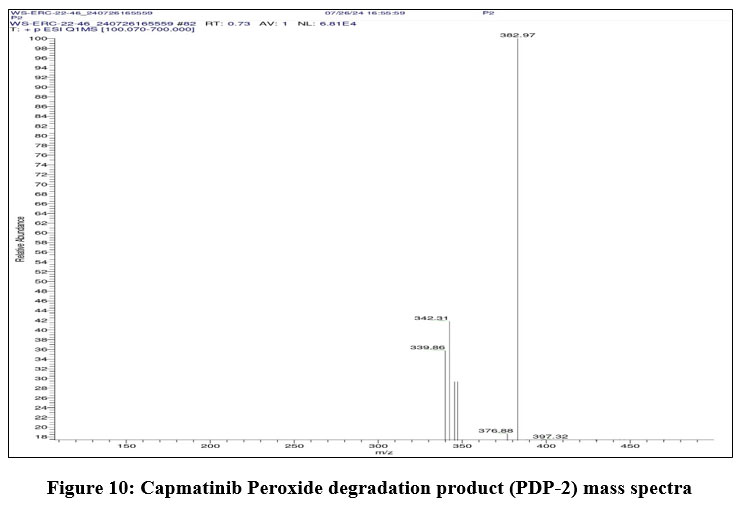 |
Figure 10: Capmatinib Peroxide degradation product (PDP-2) mass spectra. |
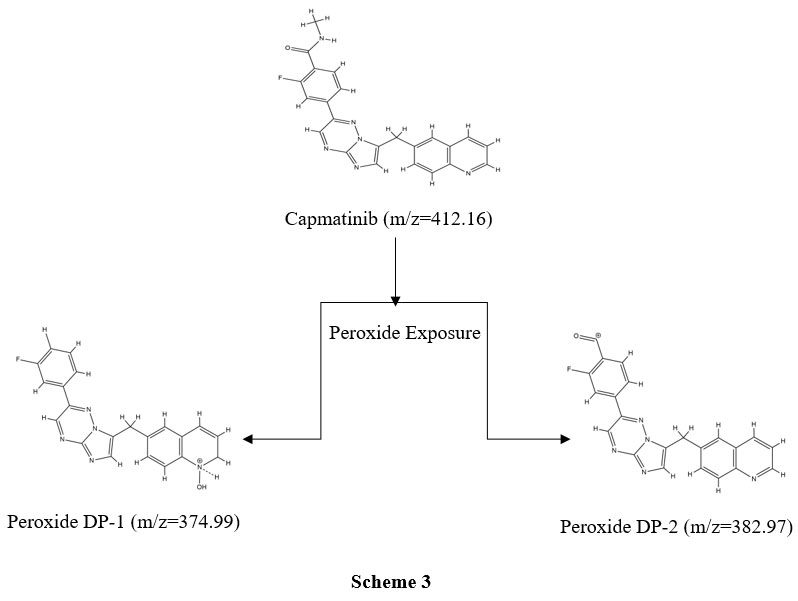 |
Scheme 3 |
Method Validation
System Suitability
Place 20 mg of Campatinib into a 20 mL volumetric flask while dissolving the substance with 15 mL of methanol using sonication. Finally, adjust the flask volume to the mark with methanol before diluting 1 mL solution with 10 mL of mobile phase. Add additional methanol into the volumetric flask to reach the mark and then mix 1mL solution with 10mL of the mobile phase. Add 15 mL of methanol sonicate as a dissolving agent while increasing the volume to the mark using methanol before preparing 10 mL of mobile phase dilution from 1 mL of solution. The system suitability parameters approved the acceptance test when applied to 5 replicates of standard solution due to % RSD values below 2.0 and theoretical plates exceeding 2000 along with symmetrical values surpassing 2.0.
Solution stability
The standard solution received injections for the initial time, 12 Hours and another time at 24 Hours. The generated initial area serves as the basis for percent absolute difference determination. The standard solution maintained stability for 24 hours according to the 2.0 % absolute difference criterion thus making the prepared solution usable within a 24-hour period.
Specificity
The peak purity assessment required both standard and sample solutions in addition to blank solution ran tests. Any potential interferences do not appear within the retention period of Capmatinib during the blank sample assessment. The developed chromatographic technique successfully fulfilled the test of specificity during evaluation. The method fulfilled the requirements of ICH guidelines which made it specific as per their standards (8).
Linearity
The research group made experimental solutions of Level 5 by diluting it between 80% and 120% of its initial working concentration. Each level injected in triplicate. Rephrase this concept using the relationship between Mean Area and Conc measured through the Linearity graph. The analysis found the intercept value and slope value along with regression coefficient. The research data indicates an exceptional relationship between drug peak area measurements and concentration levels from 80-120 µg/ml that appears in Table no. 5 and Figure no. 11. The established correlation coefficients for Capmatinib analysis reached 0.9996 with intercept -1055103.4 and slope 1216434. Thus the regression coefficient demonstrated an accepted value higher than 0.98 thus proving the analytical method had linear characteristics within 80 to 120 µg/ml.
Table 3: Data of linearity
| Level | Conc (µg/mL) | Area | Mean | STD DEV | % RSD |
| 80% | 80 | 96255841 | 96310466 | 66493.291 | 0.069 |
| 96291052 | |||||
| 96384506 | |||||
| 90% | 90 | 108365888 | 108514370 | 140494.683 | 0.129 |
| 108532012 | |||||
| 108645211 | |||||
| 100% | 100 | 120894104 | 120756512 | 126488.056 | 0.105 |
| 120645283 | |||||
| 120730149 | |||||
| 110% | 110 | 132062583 | 131941766 | 111734.298 | 0.085 |
| 131920562 | |||||
| 131842153 | |||||
| 120% | 120 | 145248640 | 145418479 | 152232.830 | 0.105 |
| 145464143 | |||||
| 145542653 |
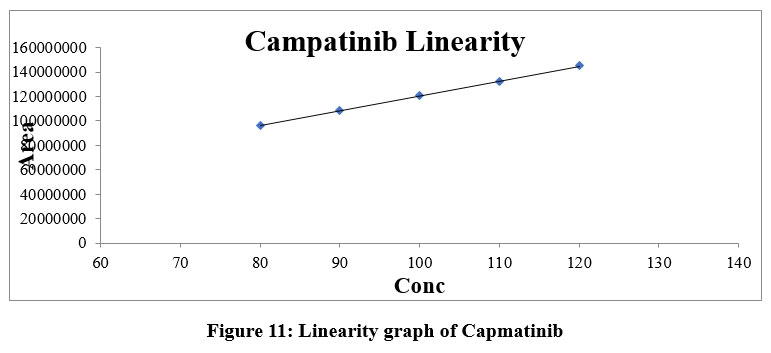 |
Figure 11: Linearity graph of Capmatinib |
LOD and LOQ
The standard deviation calculation method for calibration curve slope and intercept enabled researchers to determine both the detection limit (LOD) and quantification limit (LOQ) of the test system.
LOD = 3.3x Sigma /Slope so, LOD= 1.321 µg/ml
LOQ=10x Sigma /Slope so, LOQ=4.002 µg/ml
Accuracy
The recovery tests employed three different solution percentages through the preparation of 80%, 100% and 120% level respective solutions. Each Level prepared in triplicate.
A recovery test involved clean and dried 9 volumetric flasks with a measurement of 20 mL. The weight measurements of Capmatinib HCl API at accuracy levels were conducted in advance for pouring the API into 15 ml water solution through the same volumetric flask with continuous sonication for ten minutes. The study team utilized water solution as the volume-making agent up to the indicated mark. difículting 1 mL of analytical volume with the mobile phase solution to create a 10mL volume. The recovery percentage obtained through comparison of added and recovered concentrations fell between 98.0 to 102.0 percent in the acceptable range. The % Recovery measurements obtained at all three levels corresponded to their respective acceptance ranges.
Table 4: Data of Accuracy
| Level (%) | Area | Recovered conc. | Added conc. | % Recovery | Mean Recovery | % RSD | Overall Recovery | % RSD for overall recovery |
| 80 | 96450264 | 79.811 | 80.000 | 99.76 | 99.56 | 0.647 | 99.70 | 0.718 |
| 96755862 | 80.064 | 81.000 | 98.84 | |||||
| 97365483 | 80.568 | 80.500 | 100.08 | |||||
| 100 | 120956425 | 100.089 | 101.000 | 99.10 | 99.30 | 0.701 | ||
| 121096539 | 100.205 | 101.500 | 98.72 | |||||
| 121542368 | 100.574 | 100.500 | 100.07 | |||||
| 120 | 145685482 | 120.552 | 120.500 | 100.04 | 100.24 | 0.657 | ||
| 145832964 | 120.674 | 119.500 | 100.98 | |||||
| 144596385 | 119.651 | 120.000 | 99.71 |
Precision
Repeatability
The precision testing included preparing six test samples where % Assay measurements were between 98% to 102% while percent RSD stayed below 2%. The determination of Precision shows no variation between test samples because we prepared six samples. Results were good reproducible.
Table 5: Data of Repeatability
| Sample | Area | % Assay |
| Sample 1 | 121856429 | 99.84 |
| Sample 2 | 120936482 | 98.59 |
| Sample 3 | 121652216 | 98.69 |
| Sample 4 | 122656841 | 100.99 |
| Sample 5 | 118836559 | 99.33 |
| Sample 6 | 118652942 | 98.68 |
| Mean | 99.35 | |
| STD DEV | 0.937244 | |
| % RSD | 0.943 | |
Intermediate Precision
Six further samples were made in preparation for the investigation on intermediate precision. The computation of the percentage of assay, the RSD for twelve readings (six precision readings plus six intermediate precision readings) yielded the percentage of assay, the RSD for six readings, and the overall precision. The results were determined to be within acceptable limits, with 98.0 to 102.0% and NMT 2.0, respectively.
Table 6: Data of Intermediate precision
| Sample | Area | % Assay |
| Sample 1 | 121929451 | 98.43 |
| Sample 2 | 122195429 | 100.61 |
| Sample 3 | 117640196 | 99.33 |
| Sample 4 | 121652973 | 98.69 |
| Sample 5 | 121056631 | 99.67 |
| Sample 6 | 123956884 | 101.06 |
| Mean | 99.63 | |
| STD DEV | 1.0412 | |
| % RSD | 1.045 | |
| Precision plus intermediate precision | Mean | 99.493 |
| STD DEV | 0.9556 | |
| % RSD | 0.960 | |
Robustness
The analysis maintains robust performance under purposeful method parameter adjustments because scanning wavelength adjustment by plus or minus 2 nm and flow rate changes within ±10% and column temperature modifications by ±2◦C do not impact analysis reliability. The analytical method showed resistance to wavelength changes and flow rate and column oven temperature adjustments since Chromatography performance stayed steady. Good %RSD values, Theoretical plates not less than 2000, Asymmetry not more than 2.0
Conclusion
The analytical method for Capmatinib measurement meets all requirements specified in ICH guidelines and demonstrates high speed and financial efficiency. The attractive features of this method included its short retention time of 3.88 minutes as well as its low mobile phase flow rate of 1 mL/min because these aspects cut down both expenses and analysis duration. Studies on Capmatinib forced degradation under various stress condition were conducted. Only dry heat and photolytic stress did not affect the stability of Capmatinib but it proved susceptible to acid, basic and peroxide stress conditions. The degradation product produced during the forced degradation studies was characterized using mass spectrometry. To put it briefly, this approach is quick, sensitive, repeatable, and selective for capmatinib in bulk. The accuracy and precision are within acceptance criteria, the Limit of quantification is 4.002 µg/ml and finally analytical method is reliable and robust.
Acknowledgement
The authors are thankful to the principal, Dr. S.J. Kshirsagar, MET’s Institute of Pharmacy, Adgaon, Nashik, and Professor Dr. Sandeep S. Sonawane, for their continuous support as well as assistance from colleagues in analytical research and the department.
Funding Sources
The author(s) received no financial support for the research, authorship, and/or publication of this article.
Conflict of Interest
The author(s) do not have any conflict of interest.
Data Availability Statement
This statement does not apply to this article.
Ethics Statement
This research did not involve human participants, animal subjects, or any material that requires ethical approval.
References
- Vansteenkiste, J.F., Van De Kerkhove, C., Wauters, E. and Van Mol, P., Capmatinib for the treatment of non-small cell lung cancer. Expert review of anticancer therapy, 19(8), 659-671 (2019).
CrossRef - Baltschukat, S., Engstler, B.S., Huang, A., Hao, H.X., Tam, A., Wang, H.Q., Liang, J., DiMare, M.T., Bhang, H.E.C., Wang, Y. and Furet, P., Capmatinib is active against models of non–small cell lung cancer and other cancer types with defined mechanisms of MET activation. Clinical Cancer Research, 25(10),3164-3175, (2019).
CrossRef - Ettinger, D.S., Wood, D.E., Aisner, D.L., Akerley, W., Bauman, J., Chirieac, L.R., D’Amico, T.A., DeCamp, M.M., Dilling, T.J., Dobelbower, M. and Doebele, R.C., Non–small cell lung cancer, clinical practice guidelines in oncology. Journal of the National Comprehensive Cancer Network, 15(4), 504-535, (2017).
CrossRef - Dhillon, S., Capmatinib: first approval. Drugs, 80(11), 1125-1131, (2020).
CrossRef - Capmatinib | C23H17FN6O | CID 25145656 – PubChem (nih.gov)
- Dhone, S., Parjane, S.K. and Bhosale, M., Stability indicating RP-HPLC method development and validation of Capmatinib in bulk and tablet dosage form. International Journal of Current Research and Innovations in pharma sciences, 1(1), 29-36. (2022).
- Bhangare, D., Rajput, N., Jadav, T., Sahu, A.K. and Sengupta, P., Mechanism of capmatinib degradation in stress conditions including degradation product characterization using ultra‐high‐performance liquid chromatography‐quadrupole‐time of flight mass spectrometry and stability‐indicating analytical method development. Rapid Communications in Mass Spectrometry, 37(1), 9417-27, (2023).
CrossRef - International Conference on Harmonization of Technical Requirements for Registration of Pharmaceuticals for Human use. Validation of Analytical Procedures: Text and Methodology ICH Q2 (R1). (2000)
- Bakshi, M. and Singh, S., Development of validated stability-indicating assay methods—critical review. Journal of pharmaceutical and biomedical analysis, 28(6), 1011-1040. (2002).
CrossRef - Alsante KM, Ando A, Brown R, Ensing J, Hatajik TD, Kong W, Tsuda Y. The role of degradant profiling in active pharmaceutical ingredients and drug products. Advanced drug delivery reviews. 10;59(1):29-37, (2007).
CrossRef - Blessy MR, Patel RD, Prajapati PN, Agrawal YK. Development of forced degradation and stability indicating studies of drugs—A review. Journal of pharmaceutical analysis. 1;4(3):159-650, (2014).
CrossRef
Accepted on: 24 Mar 2025
Second Review by: Dr. Asif Khan
Final Approval by: Dr. Pounraj Thanasekaran


![]()


