Extraction of Bioactive Compounds from Pepper (Piper Nigrum) in Vietnam Using Response Surface Methodology and the Piperine Purification Process

Department of Natural Products, Faculty of Chemical Engineering and Food Technology, Nong Lam University, Ho Chi Minh City, Vietnam.
Corresponding Author E-mail: maihuynhcang@hcmuaf.edu.vn
DOI : http://dx.doi.org/10.13005/ojc/410201
Download this article as:
![]()
This study aimed to investigate the optimal parameters for the extraction and purification of bioactive compounds from pepper (Piper Nigrum). In this study, surveyed parameters include material: solvent ratio (1:3, 1:4, and 1:5 g/mL), extraction temperature (30⁰C, 40⁰C, and 50⁰C), extraction time (60 min, 90 min, 120 min), and extraction solvents (distilled water, ethanol 50%, ethanol 70%, and ethanol 96%). Additionally, the process of purifying piperine (the main active compound in pepper) from the extract was studied with crystallization time varying from 10h, 24h, 48h, and 72h. As a results, the optimal conditions for the piperine extraction were determined including ethanol 96%, material: solvent ratio as 1:3.9 (g/mL), extraction time as 104 min, and extraction temperature as 37⁰C. With the above parameters, the obtained piperine content was 8.083 mg/g dry matter. Furthermore, after purification, the obtained mass of piperine was 0.4954 g/g of extract. This research is crucial for optimizing the extraction and purification of piperine, which can enhance its applications in pharmaceuticals, functional foods, and the spice industry by improving yield and efficiency.
KEYWORDS:Extraction; Pepper; Piperine; Piper nigrum
Introduction
Pepper, with its scientific name Piper nigrum, originated in India, especially on the Malabar coast of Kerala state 1. Piper nigrum is a woody climbing plant (5 m tall or more) with a long stem that clings to other trees with roots, grown mainly to harvest seeds used as a spice2. The seeds are spherical in shape, green and orange-red when ripe, located close together on the flower stalk with about 20 – 30 seeds. Pepper is widely grown in tropical countries such as India, Indonesia, Thailand, Cambodia, and Vietnam. Scientific studies show that the main compound obtained from pepper seeds is piperine, which has medicinal effects3. Black pepper contains four isomers of piperine: trans-trans isomer (piperine), cis-trans isomer (isopiperine), cis-cis isomer (chavicine), and trans-cis isomer (isochavicine) chavicine accounts for 2.2 – 6%. Besides isomers of piperine, studies also identified several other alkaloids contained in black pepper extract, such as piperanine, pipettin, piperylin A, piperolein B, and pipericine, which all have antibacterial properties. Pepper Seeds contain 0.4 – 7% essential oil, protein (11 – 14%), fiber (47 – 53%), starch (10 – 13.5%), and alkaloids piperine and piperidine, accounting for 5 – 9%4.
Some studies have reported that pepper had a high antibacterial ability (75% antibacterial activity) to fight infections in the respiratory tract and oral cavity, had helped improve mood, and had battled depression, reducing stress and fatigue due to substances that had caused the body to increase serotonin production5. Piperine, found in black pepper, has the chemical formula C17H19NO3, belonging to the alkaloid, characterized by its mild alkaline nature and yellow crystalline structure, showing strong solubility in ethanol and chloroform. Piperine has been identified as possessing anti-inflammatory, anti-arthritic, and anti-aging properties, and it has been tested in arthritis models. It also shows potential as an anti-allergic agent in allergic rhinitis and a xenobiotic agent for clinical applications. Additionally, piperine exhibits promise as an antiepileptic and antidepressant and may be beneficial in various neurodegenerative disorders [4]. A sequential microwave-assisted ultrasonic extraction method for isolating piperine from black Pepper (Piper nigrum) has been studied by Gorgani et al. (2017). The effects of various factors such as extraction solvent, pepper size, solvent-to-solid ratio, microwave time and power, temperature, and ultrasound time on the extraction yield of piperine have been investigated. The maximum extraction efficiency of 46.6 mg piperine/g pepper was obtained using ethanol at a particle size of 0.15 mm, solvent-to-solid ratio of 20/1, microwave power of 100 W for 1 min, and ultrasonic temperature of 50°C for 30 min. This extraction efficiency was higher than that obtained by Soxhlet (39.1 mg/g), microwave-assisted extraction (38.8 mg/g), and ultrasound-assisted extraction (37.0 mg/g)6. Olalere et al. (2018) reported a yield of 5.64% (w/w) under microwave with water as solvent using Taguchi optimization method (Olalere et al., 2018). The crystallization method, dependent on the varying solubility of solid substances with temperature fluctuations, results in the precipitation of excess solute from a solution when its concentration surpasses the saturation point, thereby yielding pure crystals. The isolation of piperine from Piper nirgum was studied by Alyaseen et al. (2018), and the results showed that 100 g of Black Pepper yielded 0.8 g of piperine7. Pepper contains many bioactive compounds, which were determined to have many benefits for human health. Still, there has not been much research on optimizing the piperine extraction and purification process to improve its value. Therefore, this study aimed to find optimal parameters such as solvent type, material/solvent ratio, extraction time, and temperature for the piperine from the Pepper extraction process. In addition, the piperine crystallization time was also studied to obtain the most effective mass of crystallized piperine products with high purity.
Materials and Methods
Materials
“Pepper” was harvested in Binh Phuoc province, Vietnam, aged 7 – 8 months. Chemicals used include standard piperine (purity 97%), Vitamin C (99%), 2,2-diphenyl-1-picrylhydrazyl, Folin – Ciocalteu, purchased from Sigma Aldrich (Singapore). Other chemicals, including ethanol (96% purity), n-hexane (99% purity), ethyl acetate (99% purity), acetone (99% purity), Gallic acid (98%), Sodium Carbonate, and Potassium Hydroxide, were bought from Xilong (China).
Process for extracting biologically active compounds from Pepper
Pepper was dried and finely ground after undergoing preliminary processing to remove impurities. Using the reflux extraction method, the pepper particles, approximately 4.5-5.5 mm in size, were used at a mass of 20 grams per experiment. Pepper was extracted with solvents including distilled water, ethanol 50%, ethanol 70%, and ethanol 96% at temperatures of 30⁰C, 40⁰C, 50⁰C, and 60⁰C. Material-to-solvent ratios of 1:3, 1:4, 1:5, and 1:6 (w/w) were employed, with extraction times varying between 30, 60, 90, and 120 min. The extracts were analyzed for piperine content, polyphenol content, and antioxidant activity to determine the most suitable conditions of time, solvent, ratio, and temperature for optimizing the extraction yield. Piperine content was evaluated according to the extraction time, temperature, and solvent ratio. Subsequently, the solution was filtered and evaporated to obtain a concentrated pepper extract. This extract (5 g) was then dissolved in ethanol and crystallized for 10, 24, 48, and 72h at cold temperatures (-5⁰C, 1 atm).
Optimization of piperine extraction process from Pepper
During the survey, three factors were identified that affected the piperine content: time, temperature, and material-solvent ratio. Next, the RSM response surface method was applied to optimize the conditions affecting the extraction of piperine from Piper nigrum seeds. Based on the research results using Central Composite Design (CCD), a second-order model was employed to describe the relationship between the three design factors, each at three different levels. Experimental conditions and coding of rate, temperature, and time variables into A, B, and C are shown in Table 1.
Table 1: Experimental conditions for optimizing the extraction of piperine from Piper nigrum
| Factors | Code | Level | ||
| -1 | 0 | +1 | ||
| Raw material – solvent ratio (g/mL) | A | 3 | 4 | 5 |
| Time (min) | B | 60 | 90 | 120 |
| Temperature (oC) | C | 30 | 40 | 50 |
Piperine purification process from Pepper extract
5 grams of extract (using the optimal extraction parameters) were dissolved in 50 milliliters of ethanol 96%, a solution to which 10 milliliters of 20% KOH was added (prepared by mixing 2 grams of KOH with 10 milliliters of 96% ethanol) was added and left for 1h. Afterward, the solution was filtered, and 250 milliliters of distilled water was added to the flask. The resulting solution was then stored at 20°C for 50 – 60 h and subsequently filtered to collect the solid part, known as crude piperine. This crude piperine was dissolved in ethanol and stored at a temperature -5°C for varying durations (10, 24, 48, and 72h). Afterward, piperine was filtered and dried, and the resulting piperine crystals were utilized to determine their maximum mass and find the appropriate crystallization time; the sample was recrystallized twice to increase the purity of the piperine crystals. The second and third crystallizations followed the same procedure as the initial sample.
Determination of ash content
The ash content was determined based on the principle of Ahmed et al. (2022) 8. A 5g sample was placed into a ceramic bowl and heated at 550 – 600°C until the ash turned completely white. The ash was taken out, cooled in a desiccator, and weighed again. The ash content (% ash) was determined using the formula Eq. (1).
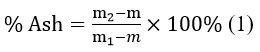
In there, m: the weight of the cup (g),
m1: the weight of the cup and sample before heating (g),
m2: the weight of cup and sample after heating (g).
Determination of piperine content
The piperine content was determined according to the method of Cahyono et al. (2019) with some modifications.9
The piperine content of solid samples was determined as follows: 1 gram of the extracted material sample was prepared with 9 mL of 80% ethanol, and the solution was further diluted to the appropriate concentration. The optical absorbance at 343 nm was then measured using a UV – Vis spectrophotometer. Ethanol 80% was used as the standard. The piperine content was expressed as milligrams of piperine equivalent per 1 g of dry matter (mg piperine/g dry matter), according to formula (2).
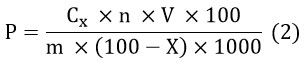
In there: P: the piperine content (mg piperine/g dry matter),
Cx: the piperine concentration determined from the standard curve (ppm) according to
y = 0.1741x + 0.0027 with R² = 0.9996
n: the dilution from stock extract,
V: volume of original extract,
X: the sample moisture (%),
m: the sample mass (g).
Determination of polyphenol content
The total polyphenol content was determined according to the method of Martins et al. (2021) with some modifications10.
Determination of polyphenol content with solid samples. Prepare 1 gram of extracted material sample with 9 mL of 80% ethanol within 30 min under light conditions. After 30 min of filtering to remove the solid part, continue using a micropipette to suck up 1 mL of the filtrate and dilute the solution to the appropriate concentration. Then, pipet 0.2 mL of the diluted sample solution into the test tube. Add 1 mL of 10% Folin-Ciocalteu solution and let the solution react for 5 min. Add 0.8 mL of 7.5% Na2CO3 solution, and shake well. Leave the solution at room temperature in the dark for 40 min. Then, the optical absorbance at wavelength 765 nm was measured on a UV – Vis spectrophotometer. Gallic acid was used as a standard. Polyphenol content is expressed as milligrams of gallic acid equivalent to 1 g of dry matter (mgGAE/g dry matter), according to formula (3).
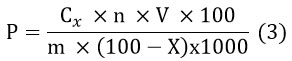
In there: P: the total polyphenol content (mg GAE/g dry matter),
Cx: the gallic acid concentration determined from the standard curve (µg/mL) according to the equation: y = 0.0084x – 0.0287 with R² = 0.9995
n: the dilution from the stock extract,
V: the volume of the original extract,
X: sample moisture (%),
m: the sample mass (g).
Determination of antioxidant activity
The antioxidant activity content was determined according to the method of Lee et al. (2016) with some modifications.11
The antioxidant activity content with solid samples was determined. 1 gram of the extracted material sample was prepared with 9 mL of 80% ethanol and was left for 30 min under light conditions. After 30 min, the mixture was filtered, and the solid part was removed to obtain the filtrate. A micropipette was used to draw up 0.1 mL of the diluted sample solution to react with 2 mL DPPH reagent solution. The mixture was shaken well and left to stand in the dark at room temperature for 30 min. The optical absorbance was then measured at 517 nm on a UV – Vis spectrophotometer. 80% Ethanol was used as the blank. Vitamin C was used as a control for this experiment. The ability to eliminate DPPH free radicals was determined using formula (4).
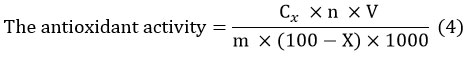
In there: antioxidant activity (mg ascorbic acid equivalent/g dry matter)
Cx: the concentration determined from the standard curve (µg/mL) y = -0.0059x + 0.8274 with R² = 0.9998
n: the dilution from the stock extract,
V: the volume of the original extract,
X: sample moisture (%),
m: the sample mass (g).
Statistical analysis
Data were processed and graphed in Microsoft Excel. Data are presented as mean ±SD. ANOVA and LSD analyses were conducted to compare differences between treatments using Statgraphics Centurion XV software (Statgraphics Technologies, Inc, USA), with 95% confidence. Design Expert 11 was used to optimize the experimental process and draw correlation charts for the effects of factors.
Results
Determine the initial properties of raw materials
The moisture content of fresh ingredients was too high 84.37 ± 0.071%, which made it challenging to preserve and created conditions for microorganisms to grow, affecting the composition content of biologically active substances. After drying, the “Pepper” residue had a moisture content of 7.61 ± 0.266%, which could be well preserved to avoid affecting the active ingredients in the research.12
Table 2: The initial properties of raw materials
|
Parameters |
Results |
| Moisture content (%) | Raw materials: 84.37 ± 0.071Pepper powder after drying: 7.61 ± 0.266 |
| Ash content (%) | 5.925 ± 0.188 |
| Total Polyphenol content (mg GAE/g dry matter) |
5.231 ± 0.080 |
| The antioxidant activity (mg acid ascorbic/g dry matter) | 2.369 ± 0.025 |
| Piperine content (mg/g dry matter) | 46.941 ± 0.946 |
Effect of extraction time
The experiment was designed to evaluate the effect of extraction time using ethanol 70% as the solvent, a temperature of 40°C, and a raw material-to-solvent ratio of 1/4 g/mL.
Extraction time is required for a substance or several substances in the raw material to diffuse into the solvent. Therefore, the biologically active ingredient extraction process was carried out at 30 min, 60 min, 90 min, and 120 min. Experimental results are shown in Figure 1. ANOVA analysis shows that extraction time has a statistically significant effect on the value of polyphenol content, antioxidant activity, and piperine content (P < 0.05). The LSD comparison test table shows that the total polyphenol content, piperine content, and antioxidant activity at the 90 min extraction time differ from the 30 min, 60 min, and 120 min extraction times (P < 0.05).
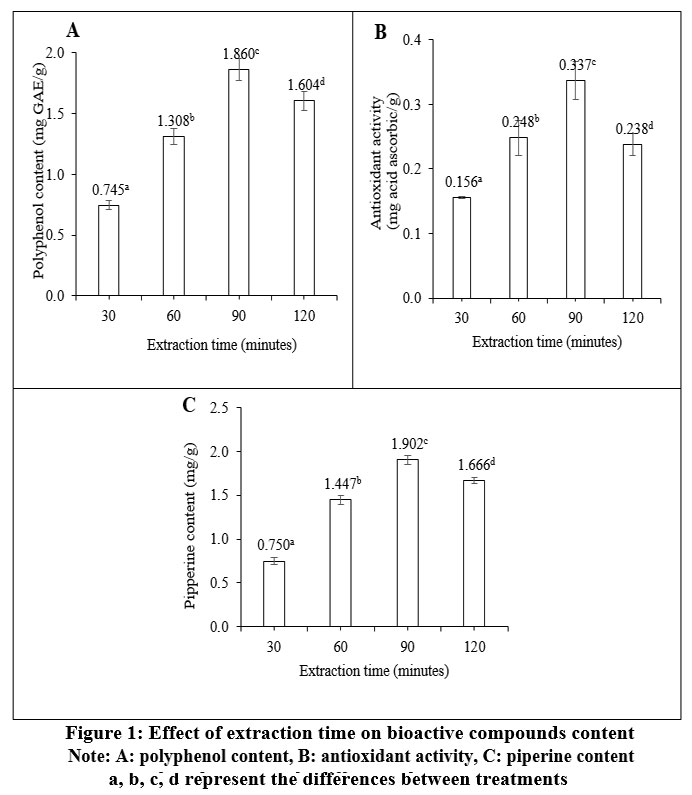 |
Figure 1: Effect of extraction time on bioactive compounds contentClick here to View Figure |
Figure 1 shows the effect of extraction time on active ingredient content. With a time of 30 min, the active ingredient content obtained was relatively low, with polyphenol content of 0.745 ± 0.028 mg GAE/g dry matter, antioxidant activity of 0.156 ± 0.001 mg ascorbic acid/g dry matter, and piperine content of 0.751 ± 0.038 mg/g dry matter. This could be explained by insufficient time for the solvent to diffuse into the material and dissolve the biological active ingredients, so the active ingredients could not be extracted entirely 13. At an extraction time of 90 min, the polyphenol content (1.860 ± 0.034 mg GAE/g dry matter), antioxidant activity (0.337 ± 0.03 mg ascorbic acid/g dry matter) and piperine content (1.902 ± 0.054 mg/g dry matter) were obtained as the highest.
Effect of raw material: extraction solvent ratio
The experiment was designed to assess the effect of the raw material-to-solvent ratio. The fixed conditions included an extraction time of 90 min, a temperature of 40°C, and ethanol 70% as the solvent.
The ratio of raw materials and solvents was a factor that affected extraction efficiency. The solvent had to penetrate the material’s surface to ensure effective extraction. Therefore, the material/solvent ratio was investigated at 1:3, 1:4, 1:5, and 1:6 (w/v). Experimental results are shown in Figure 2. ANOVA analysis showed that the raw material/solvent ratio significantly affected the biological active ingredient content with 95% confidence (P < 0.05). In addition, the LSD comparison test also confirmed that the active ingredient content was different at different raw material/solvent ratios.
 |
Figure 2: Effect of raw material – solvent ratio on bioactive compounds content. |
Figure 2A depicts the polyphenol content according to the raw material- solvent ratio. The ratio was investigated from 1/3 to 1/6, in which the ratio of 1/3 was the lowest possible for the experiment. When the raw material – solvent ratio was increased, the polyphenol concentration specifically decreased from 1/3 (2.120 ± 0.091 mg GAE/g dry matter) to a ratio of 1/5 (0.578 ± 0.030 mg GAE/g dry matter). Figure 2B showed no difference in the antioxidant activity content at the ratios 1/3 and 1/4; however, the value reduced when the raw material-solvent ratio increased to 1/5 and 1/6. The highest antioxidant activity value obtained at the 1/4 ratio was 0.329 ± 0.018 mg ascorbic acid/g dry matter. Figure 2C shows the effect of the material-solvent ratio on the piperine function obtained during the extraction process. A ratio of 1/4 was the appropriate amount of solvent to extract piperine from raw materials. In this study, the ratio selection was based on piperine content. Therefore, the appropriate ratio to extract biological active ingredients was 1/4.
Effect of temperature on the extraction process
The experiment was conducted in 90 min, using ethanol 70%. The material to solvent ratio was fixed at 1:4 g/mL.
The effect of temperature on the extraction of biologically active ingredients from Pepper is shown in Figure 3. ANOVA analysis showed that temperature significantly affected the content of biologically active ingredients (P < 0.05). In addition, the LSD comparison test showed that the total polyphenol content, antioxidant activity, and piperine content at the extraction temperature of 40°C were different compared to the three temperatures of 30°C, 50°C, 60°C.
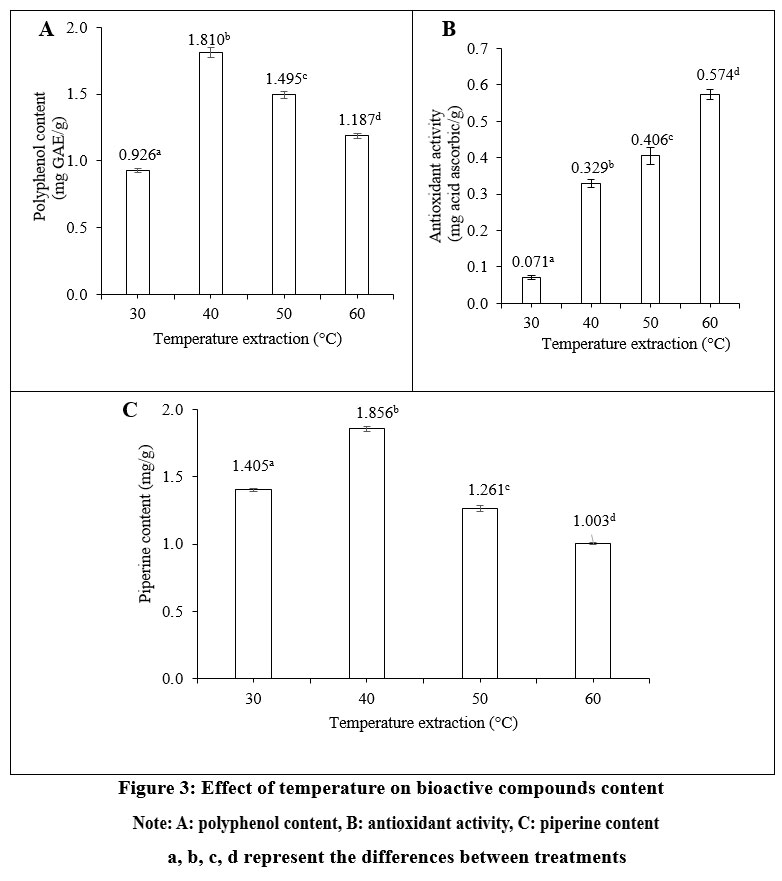 |
Figure 3: Effect of temperature on bioactive compounds content. |
When the temperature increased from 30 – 40°C, the content of biologically active ingredients increased due to the increased vibration of the solvent molecules. This helped the solvent to diffuse into the raw material cells to extract biological compounds quickly. From 30 – 40°C, the polyphenol content increased from 0.926 ± 0.015 mg GAE/g dry matter to 1.810 ± 0.035 mg GAE/g dry matter, the antioxidant activity value increased from 0.071 ± 0.006 mg ascorbic acid/g dry matter to 0.329 ± 0.011 mg ascorbic acid/g dry matter and piperine content from 1.405 ± 0.011 mg/g dry matter to 1.856 ± 0.018 mg/g dry matter. Figures 3A and 3C showed that when the temperature increased from 50 – 60°C, part of the active ingredients polyphenol and piperine were decomposed due to exposure to high temperatures for a long time. Therefore, the appropriate temperature to extract biological active ingredients was 40°C.
Effect of extraction solvent
The experiment was conducted for 90 min, with an extraction temperature of 40°C. The material-to-solvent ratio was fixed at 1:4 g/mL.
The extraction efficiency of biological active ingredients depended on the type of solvent used, especially the polarity of the solvent. Therefore, the biological active ingredient extraction process used distilled water, ethanol 50%, ethanol 70%, and ethanol 96%. Experimental results are shown in Figure 4. ANOVA analysis showed that the solvent type significantly affected polyphenol content, antioxidant activity, and piperine content (P < 0.05). The LSD grading test showed that the total polyphenol content, antioxidant activity, and piperine content when using ethanol 96% differed from the extraction solvents of distilled water, ethanol 50%, and ethanol 70%.
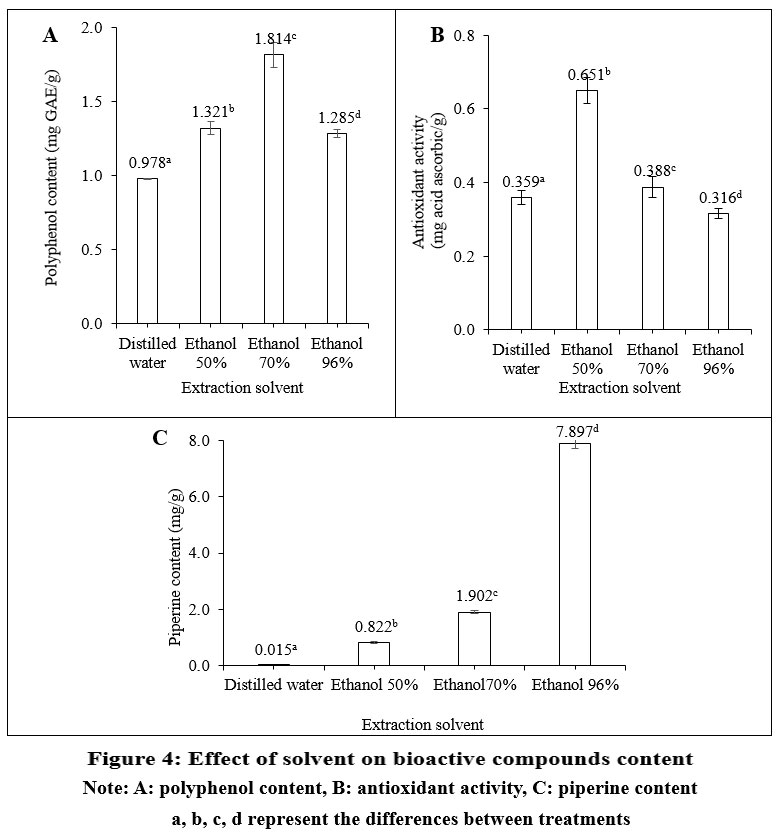 |
Figure 4: Effect of solvent on bioactive compounds content. |
Based on Figure 4A, the total polyphenol content increased when the solvent was changed from distilled water (0.978 ± 0.005 mg GAE/g dry matter) to ethanol 70% (1.814 ± 0.085 mg GAE/g dry matter). Figure 4B shows the effect of solution type medium on antioxidant activity function. Piper nigrum contains compounds with antioxidant activity that dissolve well in water and alcohol, so use a ethanol 50% environment system to make the active ingredients dissolve well 14. Figure 4C shows the effect of the type of medium increasing the piperine content. Therefore, the appropriate solvent used to extract biologically active substances from Piper nigrum was ethanol 96%.
Optimization of Piperine extraction conditions from Piper nigrum using response surface method
During the survey, three factors were identified that affected the piperine content: time, temperature, and material-solvent ratio. The type of solvent was due to the significant difference in piperine content when extracting with 96% ethanol compared to other solvents such as distilled water, ethanol 50%, and ethanol 70%. The respective piperine contents were as follows: 7.897 mg/g dry matter, 0.115 mg/g dry matter, 0.822 mg/g dry matter, 1.902 mg/g dry matter. Thus, the effect of the solvent on the extraction process was fixed at the 96% ethanol condition. Piperine content depended closely on the raw material-solvent ratio, temperature, and extraction time. The experimental results of 20 experiments and the predictions of Design Expert 11 (DX11) software are shown in Table 3. The values included in Table 3 showed that the experimental values did not deviate from the model’s predicted values. Besides, it could be seen that the piperine content obtained in experiment 19 was the highest at 7.962 mg/g dry matter under a raw material – solvent ratio of 1/4 (g/mL), extraction time of 90 min, and temperature of 40°C.
Table 3: Matrix of experimental and predicted values for 20 RSM experiments
| Std | Run | A (g/mL) | B (min) | C (oC) | RSM | ||
| Actual Value | Predicted Value | Residual | |||||
| 1 | 7 | 3 | 60 | 30 | 5.925 | 1 | 7 |
| 2 | 12 | 5 | 60 | 30 | 5.722 | 2 | 12 |
| 3 | 10 | 3 | 120 | 30 | 7.181 | 3 | 10 |
| 4 | 17 | 5 | 120 | 30 | 6.198 | 4 | 17 |
| 5 | 19 | 3 | 60 | 50 | 5.524 | 5 | 19 |
| 6 | 18 | 5 | 60 | 50 | 5.434 | 6 | 18 |
| 7 | 1 | 3 | 120 | 50 | 5.739 | 7 | 1 |
| 8 | 16 | 5 | 120 | 50 | 5.657 | 8 | 16 |
| 9 | 3 | 3 | 90 | 40 | 6.964 | 9 | 3 |
| 10 | 8 | 5 | 90 | 40 | 6.464 | 10 | 8 |
| 11 | 15 | 4 | 60 | 40 | 6.985 | 11 | 15 |
| 12 | 13 | 4 | 120 | 40 | 7.548 | 12 | 13 |
| 13 | 20 | 4 | 90 | 30 | 7.159 | 13 | 20 |
| 14 | 2 | 4 | 90 | 50 | 6.954 | 14 | 2 |
| 15 | 14 | 4 | 90 | 40 | 7.731 | 15 | 14 |
| 16 | 6 | 4 | 90 | 40 | 7.665 | 16 | 6 |
| 17 | 11 | 4 | 90 | 40 | 7.928 | 17 | 11 |
| 18 | 5 | 4 | 90 | 40 | 7.856 | 18 | 5 |
| 19 | 4 | 4 | 90 | 40 | 7.962 | 19 | 4 |
| 20 | 9 | 4 | 90 | 40 | 7.948 | 20 | 9 |
To determine the significance of each coefficient, the F value and “Pro.> F” (P-value) were calculated through Design Expert 11 software to process ANOVA data. Table 3 shows the ANOVA results of the model and the statistical result values of each factor. Data was analyzed through Design Expert 11 statistical software.
The model gave an F – value of 43.25, showing that the RSM design model was statistically significant (Table 4). With a P-value < 0.0001, the model showed only a 0.01% chance that the F value could cause noise (Table 4).
Table 4: ANOVA analysis for the regression model
| Source | Sum of Squares | Mean Square | F–value | P-value | Fit Statistics |
| Model | 15.51 | 1.72 | 43.25 | < 0.0001* | SD= 0.1996 |
| A-Tile | 0.3452 | 0.3452 | 8.67 | 0.0147* | Mean= 6.83 |
| B-Thoigian | 0.7469 | 0.7469 | 18.75 | 0.0015* | CV (%)= 2.92 |
| C-Nhietdo | 0.8277 | 0.8277 | 20.78 | 0.0010* | R2= 0.975 |
| AB | 0.0745 | 0.0745 | 1.87 | 0.2014 | R2(adj.)= 0.9552 |
| AC | 0.1285 | 0.1285 | 3.23 | 0.1027 | AP= 16.3648 |
| BC | 0.2093 | 0.2093 | 5.25 | 0.0448* | |
| A² | 2.34 | 2.34 | 58.76 | < 0.0001* | |
| B² | 0.3768 | 0.3768 | 9.46 | 0.0117* | |
| C² | 0.9255 | 0.9255 | 23.23 | 0.0007* | |
| Residual | 0.3984 | 0.0398 | |||
| * Represents factors with a statistically significant P-value | |||||
P-values < 0.05 represented factors statistically significantly influencing the model results. If the model had many values with P-values > 0.05, it would reduce the reliability of the model. The statistical table above showed that factors A, B, C, A2, B2, BC and C2 all had P-values < 0.05, so changing these factors would statistically affect the piperine content during the extraction process.
The regression coefficient (R2) reached 0.975, showing that 97.5% of the experimental data was compatible with the model-predicted data (Table 4). Besides, the RSM model had appropriate accuracy with Adequate Precision (AP) = 16.3648 The Adequate Precision value was used to guide the design space, if greater than 4.0 this model could be used. The CV value (%) of the essential oil extraction efficiency in 20 RSM experiments was 2.92% < 10%, so the dispersion of this RSM result was acceptable. In this study, we aim to develop a predictive equation that incorporates all parameters in the proposed ANOVA table, without excluding factors that may have negligible influence. Although the results may exhibit minor variations, we believe that the findings remain valid to a reasonable extent. The relationship between piperine content and independent variables A, B, and C from Design Expert 11 software was expressed in the actual equation (Final Equation in Terms of Actual Factors) as follows:
Piperine content (mg/g dry matter) = – 19.60884 + 6.97779A + 0.117571B + 0.433164C – 0.003217AB + 0.012675AC – 0.000539BC – 0.922636A² – 0.000411B² – 0.005801C²
 |
Figure 5: Three-dimensional response surface graph showing the relationship between performance and three pairs of factors: (A) Time – Ratio, (B) Temperature – Ratio, (C) Temperature – Time. |
Figure 5 displayed a 3D response surface plot generated by fixing one factor at zero while two other factors were varied within the probe range. These 3D plots depicted the interactive effects of factors on piperine content. Figure 5A shows the effects of extraction time and solvent material ratio (g/mL) on the resulting piperine content. The optimal raw material-solvent ratio was from 1/3 to 1/4.5 at 75 to 120 min of extraction time. Figure 5 indicated that piperine content decreased when the solvent ratio (g/mL) was above 1/4.5. Figure 5B shows the effects of temperature and material-solvent ratio affecting the piperine content obtained after extraction. Taking the solvent ratio of 1/4 (g/mL), when the temperature was increased from 30°C to 45°C, the piperine content obtained increased and reached the highest value at a temperature of 40°C with the piperine content obtained being 7.962 mg/g dry matter. The optimal extraction temperature of piperine was from 30°C – 45°C with a material-solvent ratio from 1:3.3 to 1:4.5 (g/mL). Figure 5C shows the interaction between temperature and piperine extraction time. High piperine content was obtained during the extraction process in the temperature range from 30°C to 45°C at extraction times from 75 to 120 min. According to the ANOVA analysis, temperature and time were identified as the primary factors significantly influencing the resulting piperine content, while the raw material-to-solvent ratio had minimal impact on piperine levels. The results are shown in Table 5.
Table 5: Piperine extraction results under optimal conditions
| Number of repetitions | Solvent raw material ratio (g/mL) | Time (min) | Temperature (°C) | Piperine content (mg/g dry matter) | |
| Experiment | 1 | 1/3.9 | 104 | 37 | 8.048 |
| 2 | 1/3.9 | 104 | 37 | 8.064 | |
| 3 | 1/3.9 | 104 | 37 | 7.995 | |
| Average | 1/3.9 | 104 | 37 | 8.036 | |
| Forecast | 1/3.853 | 103.836 | 36.716 | 7.887 | |
| Desirability = 0.970 | Error = 1.9% | ||||
An error of less than 5% and a desirability level of 0.97 proved that the model conditions were consistent with the experimental values. The above paragraph was put in the past passive tense.
The RSM response surface method and ANOVA analysis of Design Expert 11 software were used. Based on the average results from experiments after extracting piperine from Piper nigrum three times, as shown in Table 5, the predicted value of the model was that the piperine content obtained would be 7.887 mg/g dry matter. In contrast, the actual value obtained was only 1.9% different. The average piperine content obtained after three extractions was 8.036 mg/g dry matter. This result further proved that the optimized conditions from the model were entirely dependent on reality and had practical significance. With the above research results of the project, the optimal parameters of the piperine extraction process were determined: the material-solvent ratio was 1/3.9 (g/mL), the extraction time was 104 min, and the temperature was 37°C. A piperine content of 8.036 mg/g dry matter was obtained at these conditions.
Effect of time on the crystallization process
The effect of time on piperine crystallization is presented in Figure 6. It was shown by ANOVA analysis that crystallization times significantly affected piperine mass with 95% confidence. Based on Figure 6, it was found that the piperine content obtained after crystallization for 48h differed from the remaining time levels (based on statistical analysis results with P < 0.05). The piperine content was obtained when it was crystallized for 48h with a mass of 2.477 g.
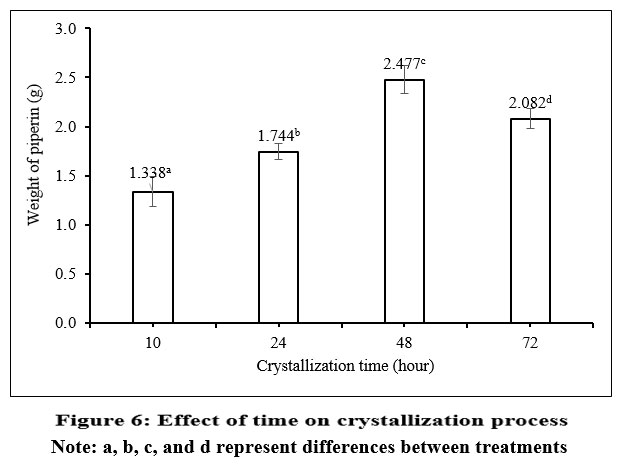 |
Figure 6: Effect of time on crystallization process. |
The most enormous mass of piperine was obtained at this stage (2.477 g at 48h). Based on the above results, the mass of piperine reached the highest value (2.477 g) when the sample was crystallized for 48h.
The purity of the crystallized piperine product was checked, as shown in Figure 7; it was crystallized three times at 48h, and thin-plate chromatography was conducted. Crystallized piperine and standard piperine samples were completely dissolved in 96% ethanol and were placed on a thin board. TLC was performed in solvent systems: n-hexane – ethyl acetate (7:3), showing that the piperine sample crystallized for the first time was relatively pure, as shown in Figure 7.
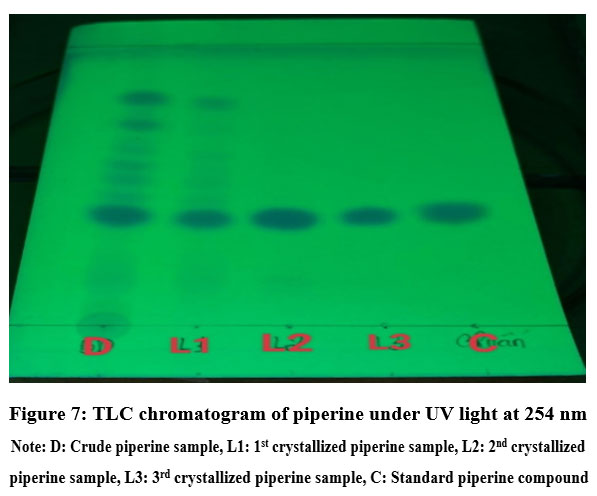 |
Figure 7: TLC chromatogram of piperine under UV light at 254 nm. |
Note: D: Crude piperine sample, L1: 1st crystallized piperine sample, L2: 2nd crystallized piperine sample, L3: 3rd crystallized piperine sample, C: Standard piperine compound
Discussion
Determine the initial properties of raw materials
According to the Vietnam Pharmacopoeia V, the appropriate moisture content for good preservation of medicinal herbs was usually below 12% to help deactivate enzymes and avoid decomposition, oxidation, and hydrolysis of compounds in herbal plants 15. Based on Table 2, the ash content of the raw material was 5.925 ± 0.188%. Therefore, it could be seen that the content of inorganic substances and heavy metals in raw materials was low; this ingredient had a high use value 16. In addition, this ash value complied with the requirements of the Vietnam Pharmacopoeia (not exceeding 8%) (Ministry of Health of Vietnam., 2017). The piperine content obtained from raw materials was 46.941 ± 0.946 mg/g dry matter, equivalent to 4.69%. This was similar to the study of Ashokkumar et al (2021), where the authors obtained a piperine content of 2.62 – 5.5% when extracted by conventional methods 17.
Effect of extraction time
Increasing the extraction time from 30 to 90 min meant expanding the time for the solvent to diffuse into the raw material cells, thereby attracting biologically active ingredients, such as polyphenol and piperine, to dissolve into the solvent. When the solvent reached equilibrium, the extraction process did not continue. Prolonged extraction time at high temperatures would cause oxidation and denaturation, reducing the active ingredient content. Therefore, after 90 min, polyphenol content, antioxidant activity, and piperine tended to decrease6. Olalere et al. (2018) optimized the piperine extraction time for 90 min to obtain a concentration of 5.64 w/w, which was higher than in this study. In this study, the author used microwave-assisted reflux extraction of piperine from Piper nigrum to increase extraction efficiency 18. Therefore, 90 min was chosen to extract biological activities from Piper nigrum.
Effect of raw material: extraction solvent ratio
Polyphenols of Pepper were mainly located in the cell walls, so extraction could happen quickly when a small amount of solvent was used. A material-solvent ratio of 1/3 would yield the highest polyphenol content. The lowest 1:3 material-solvent ratio could be extracted, and high temperatures during the extraction process swelled starch and resin because pepper contained 10 – 13.5% starch, which hindered the diffusion of the solvent into the cell walls of the raw materials. When increased to a ratio of 1/5, 1/6, the concentration of piperine in the extracted solution decreased due to dilution solvent19. The above results showed that the 1/4 ratio yielded the highest piperine content (1.884 ± 0.029 mg/g dry matter), polyphenol content (1.894 ± 0.014 mg GAE/g dry matter), and antioxidant activity (0.329 ± 0.018 mg acidic acid/ g dry matter) was different from the study of Yu et al (2020); the appropriate material-solvent ratio for the author’s analysis was 1/6 (g/mL). This could be explained by the fact that in this study, the author added an enzyme system such as 8 mg of cellulase, 10 mg of neutral protease, and 40 mg of sodium stearyl lactylate (SSL) with high substrate concentration, and diffusion of the product. Enzymatic degradation products and enzyme transport were limited to low rates20.
Effect of temperature on the extraction process
Ali et al. (2018) research showed that 60°C was suitable for extracting many compounds with antioxidant activity from Piper nigrum so when the temperature increased from 30 – 60°C, the antioxidant activity value increased Figure 3B. The above results were similar to those of the research. Upadhya et al (2014) used a temperature of 40°C to extract the active ingredient piperine from Pepper with the resulting content of 4.1351 g/100g 21.
Effect of extraction solvent
According to Zarai et al (2013), it has been proven that pepper contains many polyphenol groups that are soluble in alcohol and some groups that are well soluble in water22. Therefore, ethanol 70% for high polyphenol extraction efficiency can be explained by the fact that ethanol 70% can dissolve both water-soluble organic substances and ethanol23. Because piperine is an insoluble substance that is highly soluble in water but well soluble in ethanol. When the solvent was changed from distilled water to ethanol 96%, the piperine content increased from 0.015 ± 0.002 mg/g dry matter to 7.897 ± 0.162 mg/g dry matter. The results are similar to those of Zarai et al.’s study. (2013), which shows the effectiveness of ethanol 96% in extracting piperine from Piper nigrum23.
Optimization of Piperine extraction conditions from Piper nigrum using response surface method
Based on the expected function model, with optimal conditions, the experiment was performed with three repetitions according to the optimal parameters. According to the prediction model, with optimal conditions, a piperine content of 7.887 mg/g dry matter was expected to be obtained under the following conditions: material – solvent ratio was 1/3.852 (g/mL), extraction time was 103.825 min, and temperature was 36.716°C. However, to suit actual conditions, it was necessary to verify the model with the adjusted values of the following three factors: material – solvent ratio of 1/3.9 (g/mL), extraction time of 104 min, and temperature of 37°C. The highest value of piperine content was 8.036 ± 0.036 mg/g dry matter, showing that the extraction process was entirely consistent with the optimized model run value because the model error was 1.9% and the expected level was 0.970. As previously noted in the preliminary experiments, when the extraction duration exceeded 90 minutes, there was a noticeable decline in piperine content. Consequently, we hypothesize that increasing the extraction time to 120 minutes may not enhance the piperine yield. This hypothesis is grounded in the observation that extended extraction times could result in the degradation of the piperine compound. For clarification, Gorgani et al. (2017) employed a sequential microwave-assisted ultrasonic extraction method to isolate piperine from black pepper (Piper nigrum), which may account for the higher piperine content (46.6-80 mg/g) observed in their study. Due to financial and equipment limitations, we utilized only the reflux method in our research, which likely explains the lower piperine content (8.083 mg/g dry matter) reported in our study compared to their findings. One more reason, in the study of Gorgani et al. (2017), the author calculated the value of piperine content as mg piperine/g pepper and this value in our manuscript as mg piperine/g dry matter6.
Effect of time on the crystallization process
The amount of piperine obtained from the refining process also varied over time. The crystallization process occurred when the solution reached a supersaturated state; this process only occurred and lasted for a certain period 24. When the supersaturation state exceeded a specific limit, the natural crystallization process appeared; crystal nuclei were formed, grew in size, and reached the critical value of the nucleus [4]. As the crystallization time continued to increase, the mass obtained decreased because the crystal, after reaching the critical value, the liquid around the seed gradually diluted beyond the saturation value, so the amount of crystal seed crystals decreased25, thereby directly reducing the weight of piperine (2.082 g at 72h). The chromatographic samples did not appear colored on the thin plate when observed with the naked eye but only became colored under a 254 nm UV lamp, as shown in Figure 8. When the thin plate of the first crystallization sample (L1) was observed compared to the initial sample (D), it was shown that sample L1 had been partially purified because the number of color streaks was reduced. The number of color streaks gradually decreased as crystallization times increased. The 3rd crystallization sample (L3) had a color streak similar to the standard piperine sample (C), proving that recrystallizing piperine three times resulted in a product with higher purity.
Conclusion
The optimal conditions for pepper extraction were determined, including using 96% ethanol as a solvent and a material: solvent ratio (g/mL) of 1:3.9. The extraction was performed for 104 min at 37⁰C. Under these conditions, the highest piperine content obtained was 8.036 mg/g dry matter. Additionally, piperine was purified from the concentrated extract by crystallization with ethanol for 48h at a cold temperature (below 0⁰C), resulting in a piperine mass of 0.4954 g/gram of concentrated extract. The extraction and purification of piperine have shown great application potential and commercial viability when carried out on a large scale. Piperine had high purity and was suitable for producing products in the pharmaceutical and food industries.
Acknowledgement
This study was supported by Nong Lam University, Ho Chi Minh City, Vietnam. We want to thank UKT Farm for supporting the source of raw materials.
Funding Sources
The author(s) received no financial support for the research, authorship, and/or publication of this article.
Conflict of Interest
The author(s) do not have any conflict of interest.
Data Availability Statement
This statement does not apply to this article.
Ethics Statement
This research did not involve human participants, animal subjects, or any material that requires ethical approval.
References
- Zhang, C.; Zhao, J.; Famous, E.; Pan, S.; Peng, X.; Tian, J. Food Chemistry. 2021, 346, 128845.
CrossRef - Nahak, G.; Sahu, R. K.J App Pharm Sci. 2011, 153–157.
- Trung N. Q.; Minh B. Q.; Anh L. V.; Minh T. N.Journal of Analytical Chemistry, Physics and Biology. 2021, 3A, 12-17.
- Takiyama, H. Powder Technol. 2012, 23(3), 273–278.
CrossRef - Mujumdar, A. M.; Dhuley, J. N.; Deshmukh, V. K.; Raman, P. H.; Naik, S. R. Japanese Journal of Medical Science and Biology. 1990, 43(3), 95–100.
CrossRef - Gorgani, L.; Mohammadi, M.; Najafpour, G. D.; Nikzad, M. Food Bioprocess Technol. 2017, 10(12), 2199–2207.
CrossRef - Alyaseen, F. F.; Hassan, B. A.; Abdulhussein, H. S. Plant Archives. 2018, 18(2), 2171-2176.
- Ahmed, I.; Jan, K.; Fatma, S.; Dawood, M. A. O. Anim. Physiol. Anim. Nutr. 2022, 106(3), 690–719.
CrossRef - Cahyono, B.; Hasanah, E. F.; Judiono, Suzery, M.; Widayat. IOP Conf. Ser.: Mater. Sci. Eng. 2019, 509(1), 012025.
CrossRef - Martins, G. R.; Monteiro, A. F.; do Amaral, F. R. L.; da Silva, A. S. J Food Sci Technol. 2021, 58(12), 4693–4702.
CrossRef - Lee, S. H.; Oh, S. H.; Hwang, I. G.; Kim, H. Y.; Woo, K. S.; Woo, S. H.; Kim, H. S.; Lee, J.; Jeong, H. S. Prev Nutr Food Sci. 2016, 21(2), 110–116.
CrossRef - Sharma, S.; Dhalsamant, K.; Tripathy, P. P.; Manepally, R. K. LWT. 2021, 138, 110687.
CrossRef - Gorgani, L.; Mohammadi, M.; Najafpour, G. D.; Nikzad, M. Rev. Food Sci. Food Saf. 2017, 16(1), 124–140.
CrossRef - Ibrahim, M. A.; Mohamad Asri, N. A. A. Agr. Bio. 2020, 1(1), 01–03.
CrossRef - Ministry of Health of Vietnam. – Vietnam Pharmaceutical Codex V. Ha Noi City, Vietnam: Medical Publishing House (2017). https://duocdienvietnam.com/
- Bhardwaj, A. K.; Kashyap, K.; Hait, M.; Bera, S. K.; Dewangan, H. ES Food & Agroforestry. 2023, 11(0), 813.
- Ashokkumar, K.; Murugan, M.; Dhanya, M. K.; Pandian, A.; Warkentin, T. D. Clin Phytosci. 2021, 7(1), 52.
CrossRef - Olalere, O. A.; Abdurahman, N. H.; Yunus, R. M.; Alara, O. R.; Akbari, S. Beni-Suef Univ. J. Basic Appl. Sci. 2018, 7(4), 626–631.
CrossRef - Rathod, S. S.; Rathod, V. K. Crops Prod. 2014, 58, 259–264.
CrossRef - Yu, Y.; Hu, S.; Fu, D.; Zhang, X.; Liu, H.; Xu, B.; Huang, M. J. Food Prop. 2020, 23(1), 52–62.
CrossRef - Upadhya, V.; Pai, S. R.; Sharma, A. K.; Hegde, H. V.; Kholkute, S. D.; Joshi, R. K. Anal. Methods Chem. 2014, e932036.
CrossRef - Zarai, Z.; Boujelbene, E.; Ben Salem, N.; Gargouri, Y.; Sayari, A. LWT. 2013, 50(2), 634–641.
CrossRef - Gu, F.; Huang, F.; Wu, G.; Zhu, H. Molecules. 2018, 23(2), 370.
CrossRef - Grove, C. S.; Jelinek, R. V.; Schoen, H. M. Crystallization from Solution, in Drew, T. B.; Hoopes, J. W.; Vermeulen, T. (Eds.), Advances in Chemical Engineering, Academic Press, 1962, 1–60.
CrossRef - Giulietti, M.; Seckler, M. M.; Derenzo, S.; Ré, M. I.; Cekinski, E. J. Chem. Eng. 2001, 18, 423–440.
CrossRef
Accepted on: 11 Apr 2025


![]()


