Application of Waste Egg Shell for Adsorption of Cd(II) and Pb(II) Ions to Protect Environment: Equilibrium, Kinetic and Adsorption Studies
Vijay Laxman Gurav* and Rajesh Ashok Samant
Department of Chemistry, K. C. College, Mumbai - 400020, (Maharashtra) India.
Corresponding Author E-mail: vlgurav83@gmail.com
DOI : http://dx.doi.org/10.13005/ojc/370117
Article Received on : 21-Jan-2021
Article Accepted on :
Article Published : 09 Feb 2021
In the present work, we studied the impact of adsorption parameters on adsorption of M (II) [Cadmium and Lead] using calcinated chicken egg shell as biomaterial. The characterization of biomaterial reveals; crystallite size by Scherrer formula is 66.58 nm and 9.80 m2/g BET surface area. The adsorption of cadmium and lead on calcinated egg shell was found to be dependent on equilibrium adsorption parameters. The adsorption kinetic models and adsorption isotherm were successfully applied. The removal method was validated with anodic stripping voltametric technique. For standard aqueous sample of M (II), maximum removals were obtained at pH 5 and 200 mg of adsorbent and 120 minutes of contact time. The kinetic model followed pseudo second order kinetics at equilibrium contact time of 120 minute. The amounts of M (II) adsorbed per unit mass of calcinated egg shell increases with initial concentration up to 50 mg/L followed by deviation in results were observed. The Freundlich’s adsorption isotherm model is better fitted for M (II) adsorption with R2 closed to unity i.e0.9998 for Cadmium and 0.9983 for Lead. For real samples, adsorbed M (II) also recovered with 98 + 0.5 % recovery using 10 ml of 1.0 M HCl with flow rate of 2 ml per minute.
KEYWORDS:Adsorption; Anodic stripping Voltammetry; Heavy Metals; Waste eggshells
Download this article as:| Copy the following to cite this article: Gurav V. L, Samant R. A. Application of Waste Egg Shell for Adsorption of Cd(II) and Pb(II) Ions to Protect Environment: Equilibrium, Kinetic and Adsorption Studies. Orient J Chem 2021;37(1). |
| Copy the following to cite this URL: Gurav V. L, Samant R. A. Application of Waste Egg Shell for Adsorption of Cd(II) and Pb(II) Ions to Protect Environment: Equilibrium, Kinetic and Adsorption Studies. Orient J Chem 2021;37(1). Available from: https://bit.ly/3qbyuAw |
Introduction
Water pollution becomes major environmental issue because of some anthropogenic resources such as industrialization, unplanned urbanization[1] etc. The main sources of heavy metal pollution are fast growing industrial civilization in a field of mining, metallurgical, refining, chemical, petrochemical etc. The review on sources of heavy metal pollution was reveals that, nearly 70-80 % heavy metals like cadmium lead mercury, chromium etc. spread in the environment caused by industrial effluents. The majority of lead and cadmium found in the effluents from metallurgical and welding industries with concentration range from 2 – 400 PPM[2-4]. Industrial wastewater mostly contaminated with heavy metals such as Lead and Cadmium, are hazardous due to non-biodegradable nature as well as its toxicity[5-8]. They have damaging effects on plant as well as animals[9]. The accumulation of Lead and Cadmium metals has been linked to nutritional deficiency and related issues[10]. The maximum permissible limit for Lead is 50 ppb and that of Cadmium is 3 ppb[11].
For removal of Cadmium and Lead, several methods have been reported such as ion exchange method[12], solvent extraction technique[13], chemical precipitation method[14], coagulation[15], evaporation, filtration[16] and membrane techniques[17]. However, due to its high installation and operating cost, their utilization is not common and confined to special treatment.
Researchers preferred bioadsorption process for removal of heavy metals ions because of its simple design, low initial cost and effective for treatment of industrial wastewater for both organic and inorganic pollutants[8,18-19]. For bioadsorption mostly preferred bioadsorbents are agricultural waste[20–23] and marine waste[14–26].
India is leading country in poultry farm in all over the world. Approximately 40–50% part of egg consists of shells. Among the bio-waste chicken egg shell has capacity to remove heavy metals, as it mainly composed of calcium carbonate (CaCO3)[27]. The review on literature reveals that, the adsorption capacity of egg shell was improved by calcinations at 7000C[28] and hence used for different purposes[29-41].
For analysis of heavy metals, several spectroscopic and electro analytical techniques have been used. In present work we preferred Anodic Stripping Voltammetry for quantitative analysis. Anodic Stripping Voltammetry consists of two parts first is pre-concentration of the metal ions (present generally in very low concentration) are accumulated on the electrode surface by applying a negative potential to the electrode and in second step the polarity of the electrode is reversed and the concentrated metal ions on the electrode surface are stripped back into the solution. The current generated in the stripping step is plotted against the applied potential to get the voltammogram[42-47].
The present study is aimed to study 1) bioadsorption of Cadmium and Lead onto calcinated egg shell. 2) Optimization of the adsorption conditions such as pH, adsorbent dose, contact time and effect of initial concentration of Cadmium and Lead. 3) Validation of adsorption data for Langmuir and Freundlich adsorption isotherm. 4) Kinetic model for bioadsorption of Cadmium and Lead on calcinated egg shell. 5) The application of our adsorbent to real wastewater sample.
Materials and Methods
Adsorbate
Stock solution containing 1000 PPM of Cadmium (II) and Lead (II) was prepared by using appropriate amount of Cadmium Chloride (CdCl2) and Lead Nitrate Pb(NO3)2 (Himedia, India) respectively, in slightly acidified double-distilled water. The working standard containing 50 mg/L was prepared by appropriate dilution and verified by Atomic absorption spectrometer (AAS). The solution of 0.1M HCland 0.1M NaOH were used for pH adjustment.
Adsorbent
Waste egg shells were collected from local market and households uses. It was washed with de-ionized water, dried in sunlight, then in oven at 500C. It was crushed in mortar pestle and calcine in muffle furnace at 700˚C with heating rate of 50C min-1. The calcinated egg shell powder was stored in airtight container and used as adsorbent. Several instrumental techniques have been used to study the surface morphology and chemical composition of adsorbent. The surface area was determined by BET instrument operated in liquid N2 at 77 K using a BET Lab-India apparatus. Fourier Transform Infrared (FTIR) Bruker Alpha in a range of 400-4000cm-1 was used for Infrared (IR) Spectra. Crystallite size of adsorbent was determined by Bruker-D2 phaser X- Ray diffraction (XRD) spectrometer. Scanning Electron Microscope JEOL-JSM-6360A Japan was used for SEM image.
Analysis
Adsorption of M (II) on calcinated egg shell was conducted in batch mode. The glass column (10 mm diameter x 150 mm length) having about 15 to 20 mm glass wool bed was used as filtration media[48]. At optimum adsorption conditions, the concentrations of metal ions in filtrate were measured by anodic stripping voltammeter (Metrohm 797 VA Computrace-Switzerland).
Adsorption Experiment and Equilibrium Study.
50 ml of 50 mg/L working standard solutions were used to study % removal at optimum adsorption parameters. In order to know the optimum adsorption parameters of Cadmium and Lead, percentage of metal removal was examined separately by changing the pH, adsorbent dose, contact time and initial M (II) concentration. The effect of pH on adsorption was investigated in a pH range from 2 – 7 for M (II) while adsorbent dose was optimized from range of 50 mg to 250 mg. The contact time was investigated by rotatory shaking flask containing M (II) for 30 – 150 min at optimum adsorbent dose and pH. Under optimum conditions, effect of initial concentration was studied in range of 5 – 80 mg/L. The percentage of heavy metal removal[49] and amount of metal ions adsorbed per unit mass of adsorbent (qt) was calculated as follows:-
Heavy metal removal (%) =
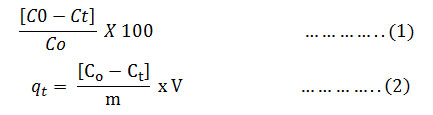
Where, C0 – initial concentration of metal ions, Ct – concentrations of metal ions at time t, V – initial volume of metal ion solution (50 ml) and m- mass of adsorbent (mg)[50].
Adsorption Kinetic
The kinetics models were used to investigate adsorption kinetics. The Lagergren’s equation for pseudo first order kinetics is represented as;
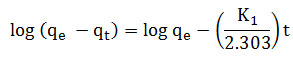
Where, qt– amount of metal adsorbed at any time (mg/g), qe – Amount of metal adsorbed at equilibrium time (mg/g), K1 – Pseudo first order rate constant (min-1)
The Ho equation for pseudo second order kinetic is represented as[51];
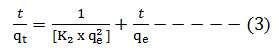
Where, K2 = Pseudo second order rate constant (g/mg min)
Adsorption Isotherm
Adsorption isotherm was expressed by Langmuir and Freundlich adsorption isotherm models[51].
The Langmuir model can be expressed as;
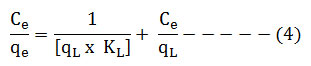
Where, qL(mg/g) – Langmuir monolayer adsorption capacity of adsorbent, KL (L/mg) – Langmuir adsorption constant. qe – amount of metal ions added per mass of adsorbent (mg/g) at equilibrium time te. Ce – Equilibrium concentration which is difference between initial concentration (Ci) and concentration of removal metal ions (Ct).
The Freundlich isotherm have represented as;
Where, KF– Freundlich constant, 1/n – heterogeneity factor.
Results and Discussions
Characterization of bioadsorbent
The surface morphology of the calcinated waste egg shell was studied using SEM analysis. The large and well developed pores suitable for adsorption were found in SEM image (Figure 1) of calcinated egg shell. BET technique was applied for surface areas measurement of calcinated egg shell and it was found to be 9.80 m2/g.
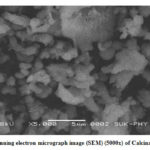 |
Figure 1: Scanning electron micrograph image (SEM) (5000x) of Calcinated Egg shell. Click here to View figure |
The Figure 2 shows XRD spectrum of calcinated egg shell.Main peak appeared at 2θ = 32.50and 37.400 shows closed agreement with the standard JCPDS NO. 037- 1497[27], the peaks were well matched with that of Calcium oxide. The crystallite size of Calcinated egg shell was calculated using Scherrer formula: D = k λ/ (β cos θ). Where D is the crystallinity size (nm), λ is X-ray wavelength in nm, β is the full width at half maximum in radian (FWHM), θ is Bragg diffraction angle in radian, k is constant (0.9). The crystallite size of Calcinated egg shell was found to be 66.58 nm.
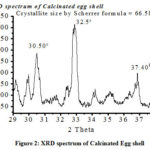 |
Figure 2: XRD spectrum of Calcinated Egg shell Click here to View figure |
Figure 3 illustrates FTIR Spectrum of calcinated egg shell (a) and egg shell (b). The existence of peak at 1404 cm-1 in both spectrums is due to stretching due to CaCO3. The FTIR spectrum of calcinated egg shell sample has one additional peak at 1523cm-1 due to CaO. The peak at 869 cm-1 and 706 cm-1 due to Out – plane deformation of C = O and in-Plane deformation of C = O[27] respectively.
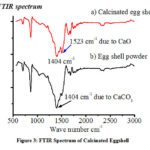 |
Figure 3: FTIR Spectrum of Calcinated Eggshell. |
Effect of pH
The effect of pH on adsorption was studied from pH 2.0 to 7.0 using calcinated egg shell as an adsorbent.Experimental data reveals proportionality between amount of M (II) adsorbed per unit mass of adsorbent (qe) and pH. This is due to as pH increases, surface area covered by H+ ions decreases thus interaction between M (II) and adsorbent sites by electrostatic forces increases[50]. At pH 5 and above there is constant value of (qe) indicate surface site are covered by adsorbent[52]. Thus pH 5 is optimum condition (Figure 4).
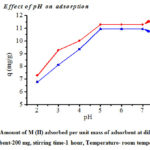 |
Figure 4: Amount of M (II) adsorbed per unit mass of adsorbent at different pH. [Adsorbent-200 mg, stirring time-1 hour, Temperature- room temperature] |
Amount of Adsorbent
As the amount of calcinated egg shell increases from 50 to 250 mg, % removal also increases and it was found to be maximum at 200 mg. For 50 mg and 100 mg, the recovery was less than 60% and around 80% respectively, while from 200 mg and above the recovery is almost constant at 90.5% to 92.5%. The increase in the adsorption efficiency with increasing the amount of adsorbent is due to the increase in the number of active site at the adsorbent surface[18] (figure 5).
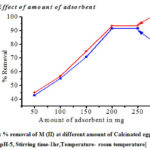 |
Figure 5: % removal of M (II) at different amount of Calcinated egg shell. [pH-5, Stirring time-1hr,Temperature- room temperature] |
Contact Time and Adsorption Kinetics
As shown in a figure 6, the adsorption was very rapid at the first stage, due to well-aligned sites available for binding of M (II) ions, and then the adsorption slows down because all binding sites have been saturated. The adsorption equilibrium occurs within 120 min of contact time.
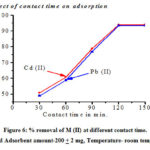 |
Figure 6: % removal of M (II) at different contact time. [pH-5 and Adsorbent amount-200 + 2 mg, Temperature- room temperature] |
The adsorption kinetics was analyzed using two common kinetics models. The validity of adsorption kinetic models could be checked by the fitness of the correlation coefficients (R2) values[50]. It shows that, kinetics of M (II) is better described by the pseudo-second-order kinetic model because calculated qe values are very close to experimental qe valued and correlation coefficient R2 are closed to unity (R2>0.92)[51] (Table 1). In pseudo first order kinetics model, calculated qe values differ appreciably from experimental qe values and coefficient R2 are very small as compared to unity. The graphical representation is given in Figure 7 and 8.
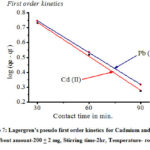 |
Figure 7: Lagergren’s pseudo first order kinetics for Cadmium and Lead. [pH-5 and Adsorbent amount-200 + 2 mg, Stirring time-2hr, Temperature- room temperature] |
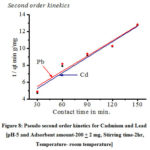 |
Figure 8: Pseudo second order kinetics for Cadmium and Lead [pH-5 and Adsorbent amount-200 + 2 mg, Stirring time-2hr, Temperature- room temperature] |
Table 1: Comparative data of pseudo first order and pseudo second order kinetics.
|
Kinetics |
qe (cal.) mg/g |
qe (exp.) mg/g |
K1 min-1 |
K2 mg-1 min-1 |
R2 |
|
First order Kinetics |
|||||
|
Cd (II) |
11.746 |
9.916 |
0.0175 |
– |
0.8436 |
|
Pb (II) |
11.688 |
9.878 |
0.0165 |
– |
0.8507 |
|
Second order kinetics |
|||||
|
Cd (II) |
11.746 |
16.265 |
– |
0.0011 |
0.9508 |
|
Pb (II) |
11.688 |
16.683 |
– |
0.0009 |
0.9374 |
Acceptable limit for correlation coefficient: 0.92 < R2 < 1[51]
Effect of initial metal concentration of metal ions and Adsorption Isotherm
Bioadsorption experiments were conducted for M (II) by varying initial metal ion concentrations form 5 mg/L to 80 mg/L. The equilibrium data reveals that, the amount of M (II) adsorbed per unit mass of calcinated egg shell increases linearly upto 50 mg/L followed by deviates from linearity.
Isotherm for adsorption of M (II) onto the calcinated egg shell was analyzed by two common adsorption isotherms described above. Both of them confirm to fit data of adsorption but observing figures 9 and 10 and table 2, it is clarified that, Freundlich’s model can better predict metal ion adsorption by calcinated egg shell[51-53] because correlation coefficient R2 equal to unity (R2>0.92)[51] and the value of 1/n within limit 0.1 < 1/n < 1[50]. In Langmuir adsorption isotherm model, correlation coefficient R2 is very small as compared to unity.
Table 2: Langmuir and Freundlich isotherm parameters for the bioadsorption of M (II) onto calcinated egg shell.
|
Metalions |
Langmuir adsorption isotherm |
Freundlich adsorption isotherm |
||||
|
qL(mg/g) |
KL (L/mg) |
R2 |
1/n |
KF(L/mg) |
R2 |
|
|
Cadmium |
66.006 |
0.0932 |
0.8626 |
0.8846 |
5.357 |
0.9998 |
|
Lead |
29.603 |
0.2202 |
0.9072 |
0.7189 |
4.724 |
0.9983 |
Acceptable limit for correlation coefficient: 0.92<R2<1[51]
Real Sample Analysis
Each sample was tested for Pb2+ and Cd2+ in filtrate using the ASV under optimal parameters. The adsorbed M (II) also recovered with 10 ml of 1.0 M HCl at flow rate of 2 ml per minute and quantitatively determined using Atomic absorption spectrometer (AAS) (Table 3).
Table 3: Application of Calcinated egg shell to industrial effluent samples.
|
Metal |
Initial concentration (PPM) |
Concentration in Filtrate (PPM) |
Concentration PPM (Recovery) |
|
By AAS |
By ASV |
By AAS |
|
|
Sample-1 |
|||
|
Cd (II) |
300.12 |
6.00 |
289.04 (98.27%) |
|
Pb (II) |
492.11 |
8.04 |
478.15 (98.78%) |
|
Sample-2 |
|||
|
Cd (II) |
185.01 |
4.11 |
178.22 (98.52%) |
|
Pb (II) |
340.04 |
6.01 |
329.01 (98.49%) |
|
Sample-3 |
|||
|
Cd (II) |
398.03 |
7.20 |
385.30 (98.59%) |
|
Pb (II) |
523.04 |
5.02 |
507.02 (97.88%) |
Comparison of Calcinated egg shell with other adsorbents
The adsorption capacity of Cadmium and Lead onto calcinated egg shell was compared with other adsorbents reported in literature and shown in Table 4. It is observed that, some of the adsorbent has high adsorption capacity but high initial concentration and large amount of adsorbent is reported. On the other hand, results of calcinated egg shell reveals 97-98 % removal capacity at only 200 mg adsorbent and 50 mg/L initial concentration.
Table 4: Adsorption capacity of different adsorbents for Cadmium and Lead adsorption.
|
Name of Adsorbent |
% removal |
C0 mg/L |
Am. (g) |
Ref. |
|
|
Cd (II) |
Pb (II) |
||||
|
Vinyl acetate-shoe material |
86.16 |
– |
402 |
1.2 |
[5] |
|
Marine brown macroalgaHydroclathrusclathratus |
96.4 |
– |
100 |
0.05 |
[6] |
|
Brown RumexdentatusL. plant |
98.6 |
– |
100 |
0.05 |
[7] |
|
calcium carbonate from eggshells |
73 |
– |
150 |
0.75 |
[34] |
|
Chitosan immobilized silica |
95.4 |
94.4 |
50 |
0.35 |
[46] |
|
Chitosan impregnated on polyurethane foam |
92.6 |
91.8 |
50 |
0.30 |
[47] |
|
Penicilliumchrysogenum on silica |
– |
92.8 |
23.88 |
0.5 |
[48] |
|
Chitin |
86.72 |
84.52 |
50 |
0.6 |
[50] |
|
Brown macroalgaPadinagymnospora (RPG) |
96.2 |
– |
100 |
50 |
[52] |
|
Calcinated egg shell |
97.5 |
98.0 |
50 |
0.2 |
present study |
C0 (mg/L): Initial concentration of metal ion, Am (g): Amount of adsorbent.
Conclusion
Calcinated egg shell as an adsorbent offers a simple, efficient, environment friendly and cost-effective method for removal of cadmium and Lead. Under the optimized adsorption conditions these metals were quantitatively adsorbed at pH-5, 200 mg adsorbent. The pseudo second order kinetics and Freundlich adsorption isotherm model was verified at 120 min. contact time. The amount of M (II) absorbed per unit weight of adsorbent (qe) increases with increase in initial concentration upto 50 mg/L followed by deviates from linearity. Thebest recovery results up to 98 + 0.5% were observed for devised procedure applied for determination of Cd (II) and Pb (II) in real samples.
Acknowledgement
Authorsconvey gratitude to Ratnagiri Sub-Campus University of Mumbai (India), K.C. College Mumbai (India), GogateJogalekar College, Ratnagiri (M.S.) India, Shivaji University Kolhapur (M.S.) India for providing instrumental facility.
References
- Vardhan K. H.; Kumar P. S.; Panda R. C. J Molecu Liquid, 2019, 290, 1-22.
CrossRef - Sun Z.; Xie X.; Wang P.; Hu Y.; Cheng H. Sci Total Envin, 2018 ,639, 217–227
CrossRef - Singh R.; Kumar N. K. A.; Tiwari J.; Pathak J. In J Res in AppliNatur and Social Sci, 2018, 1, 1-22.
- Dheri G. S.; Brar M. S. Comm in Soil Sci and Plant Anal, 2007, 38, 1353–1370,
CrossRef - Iqbal M.; Iqbal N.; Bhatti I. J.; Ahmad N.; Zahid M. Eco Eng, 2016, 88 265–275,
CrossRef - Soliman N. K.; Mohamed H. S.; Ahmed S. A.; Sayed F. H.; Elghandour A. H.; Ahmed S. A. Env Tech &Innov, 2019, 15, 100365,
CrossRef - Soliman N. K.; Mohamed H. S.; Elsayed R. H.; Elmedny N. M.; Elghandour A. H.; Ahmed S. A., Desali and Water Treat, 2019,149, 181–193
CrossRef - Solimana N. K.; Moustafa A. F., J mater resear and techno, 2020, 9 (5) 10235–10253.
CrossRef - Jaishankar M.; Tseten T.; Anbalagan N.; Mathew B. B.; Beeregowda K. N. Interdis Toxicol. 2014, 7(2) 60–72
CrossRef - Enuneku A.; Omoruyi O.; Tongo I.; Ogbomida E.; Ogbeide O. Appli Water Sci, 2018, 8:224.
CrossRef - Palisoc S. T.; Estioko L. C. D.; Natividad M. T.; Mater. Res. Express, 2018, 5, 025-035
CrossRef - Bashir A.; Malik L. A.; Ahad S.; Manzoor T.; Bhat M. A.; Dar G .N. ; Pandith A. H., Environ Chem Lett ,2018, 1, 1-26
- Anuar M.; Norli K.; Umi I.; Osman N.; Alrozi R. Appl Water Sci, 2019, 9:141, 11-21.
- Esmaeili A.; Mobini M.; Eslami H., Appl Water Sci, 2019, 9(4), 1–6.
CrossRef - Hargreaves A. J.; Vale P.; Whelan J.; Alibardi L.; Constantino C.; Dotro G.; Cartmell E.; Campo P., Clean Technol Environ Policy, 2018, 20(2), 393–402.
CrossRef - Ates N.; Uzal N., Environ Scie and PolluResear, 2018, 1, 1-14.
- Khulbe K. C.; Matsuura T., Appl Water Sci 2018, 8(1), 1–30.
CrossRef - Mohamed H. S.; Soliman N.K.; Moustafa A.F.; Abdel- Gawad O. F.; Taha R. R. ; Ahmed S. A. , Inter J Environ Ana Chem, 2019, 1, 1-28
CrossRef - Soliman N. K; Moustafab A. F; Aboudc A. A; Abdel Halimd K. S; J materiresear and techno, 2018, 1, 1-11
- Hegazi H. A., HBRC J. 2013,9(3), 276–282.
CrossRef - Pawan Kumar G. V. S. R.; Mala K. A.; Yetra B. ; Rao K. S., Appl Water Sci, 2019, 9(44), 1–9.
CrossRef - Martín-Lara M. A.; Blázquez G.; Ronda A.; Pérez A.; Calero M., Ind. Eng. Chem. Res. 2013, 52, 10809−10819
CrossRef - Özsin G.; Kiliç M.; Apaydın E.; Ayşe V. ;Pütün E. Appl Water Sci2019, 9(3), 1–14.
CrossRef - Lee M. G.; Lim J. H.; Kam S. K., Korean J Chem Eng. 2002, 19(2), 277–284
CrossRef - RinaudoM. ,ProgPolym. Sci. 2006, 31(7), 603–632
CrossRef - Younes I., Rinaudo M., Mar Drugs, 2015, 13(3), 1133–1174
CrossRef - Tsai W. T.; Yang J. M.; Lai C. W.; Cheng Y. H.; Lin C. C.; Yeh C. W. Bioresour Technol. 2006, 97(3), 488–93.
CrossRef - Borhade A. V., Kale A. S., Appl Water Sci. 2017, 7(8), 4255–68.
CrossRef - Safatian F.; Doago Z.; Torabbeigi M.; Rahmani H.; Nastaran S. Appl Water Sci. 2019, 9(4), 1–6.
CrossRef - Chattoraj S.; Kumar N.; Kamalesh M. Appl Water Sci, 2018, 8(6), 1–9.
CrossRef - Shoji R.; Miyazaki T.; Niinou T.; Kato M.; Ishii H. J Mater Cycles Waste Manag, 2004, 6, 142–146,
CrossRef - Anantha R. K., 3 Biotech.2016, 6(83), 1–16.
CrossRef - Guijarro-aldaco A.; Hern V.; Bonilla-petriciolet A.; Montes-mor M. A.; Mendoza-castillo D. I. Ind. Eng. Chem. Res. 2011, 50, 9354–9362.
CrossRef - Tizo M. S.; Blanco L. A. V.; Cagas A. C. Q.; Dela Cruz B. R. B.; Encoy J. C.; Gunting J. V.; Arazo R. O.; Mabayo V. I. F., Sustain Environ Res, 2018, 28(6), 326–330.
CrossRef - El-kemary M. A.; El-mehasseb I. M.; Rizq K., El-shafey S.E.; El-shafey O.I.; Aljihani A. H.; Fouad R. R. ; J Dispers Sci Technol 2018, 39(6), 911–921.
CrossRef - Pettinato M.; Chakraborty S.; Arafat H. ; Calabro V., Ecotoxicol Environ Saf, 2015, 1, 1–6.
- Daraei H.; Mittal A.; Mittal J.; Noorisepehr M., Desali and Water Treatment, 2017, 1-7.
- Ahmad R.; Kumar R.; Haseeb S., Arab J Chem 2012, 5(3), 353–359.
CrossRef - Park H. J.; Jeong S. W.; Yang J. K.; Kim B. G.; Lee S. M. J Environ Sci. 2007, 19(12), 1436–1441.
CrossRef - Ahmad M.; Usman A. R. A.; Lee S. S.; Kim S.; Joo J- H; Yang J. E; Ok Y. S., J Indust and EnginChem, 2012, 18, 198–204
CrossRef - Daraei H.; Mittal A.; Mittal J.; Kamali H., Desali and Water Treat, 2014, 52, 1307-1315.
CrossRef - Kowalska J., Krasnodêbska-Ostrêga B., Golimowski J., Anal BioanalChem, 2002, 373, 116–118
CrossRef - Khandekar R. N., Mishra U. C.; Fresenius Z. Anal Chem, 1984, 319, 577- 580
CrossRef - Yang G.; Qu X.; Shen M.; Wang C.; Qu Q. ; Hu X. MicrochimActa, 2008, 160, 275–281
CrossRef - Tufa L. T.; Siraj K.; Soreta T. R., Russi J Electrochem, 2013, 49(1), 59–66.
CrossRef - Gurav V. L., Samant R. A., Water ConserSci and Engin, 2020, 5 (1-2), 15-21.
CrossRef - Gurav V. L., Samant R. A. Intern J Resear in AppliSci&EnginTechnol, 2020, 8(1), 144-149
- Karve M.; Choudhary B. Int J Environ Sci Technol. 2016; 14(5), 1-6.
CrossRef - Khedr M. H;, Abdel Halim K. S.; Soliman N. K.; MateriLett, 2009, 63 598–601
CrossRef - Boulaiche W.; Hamdi B.; Trari M., Appl Water Sci, 2019, 9:39, 1-10
CrossRef - Seyedmohammadi .J; Motavassel M.; Maddahi M. H. ;Nikmanesh S., Model. Earth Syst. Environ. 2016, 2:165, 1-12
CrossRef - Mohamed H. S.; Soliman N. K.; Abdelrheem D. A.; Ramadan A. A.; Elghandour A. H.; Ahmed S. A. Heliyon5, 2019, 01287, 1-32
CrossRef - Karthikeyan T.; Rajgopal S.; Miranda L. R. J HazarMateri, 2005, B124 192–199.
CrossRef

This work is licensed under a Creative Commons Attribution 4.0 International License.
About The Author
![]()
A New Edition of Web of Science
Journal Impact Factor
2022: 0.5
Five Year: 0.8
Journal is Indexed in

Cabells Whitelist
![]()


