Analytical Method Development and Validation for Estimation of Ranitidine in Solid Dosage Form by UV-Spectrophotometric Method
1Department of Pharmacy, University of Rajshahi, Rajshahi-6205, Bangladesh.
2Department of Pharmacy, University of Asia Pacific, Dhaka-1205, Bangladesh.
3Department of Applied Chemistry and Chemical Engineering, University of Rajshahi, Rajshahi-6205, Bangladesh.
4Department of Pharmacy, Faculty of Life and Earth Sciences, Jagannath University, Dhaka-1100, Bangladesh.
5Department of Chemistry, Rajshahi University of Engineering and Technology, Rajshahi-6204, Bangladesh.
6Department of Pharmacy, Faculty of Allied Health Science, Daffodil International University, Dhaka-1207, Bangladesh.
7Department of Pharmacy, Jahangirnagar University, Savar, Dhaka-1342, Bangladesh.
8Department of Food Technology and Nutrition Science, Noakhali Science and Technology University, Noakhali-3814, Bangladesh.
9Department of Biochemistry and Molecular Biology, Noakhali Science and Technology University, Noakhali-3814, Bangladesh.
Corresponding Author E-mail: shwetabio1992@gmail.com
DOI : http://dx.doi.org/10.13005/ojc/360621
Download this article as:
![]()
Ranitidine is a histamine-2 receptor blocker and it is effective against peptic ulcer, gastroesophageal reflux disease and heart burn. The main objective of this study was to develop and validate an easy, affordable and cost-effective method for the determination of ranitidine in tablet dosage form. The development and validation study was performed under the guidance of ICH and USP. Results showed that the proposed validated method has good accuracy with % RSD of 0.60. Repeatability and intermediate precision suggested good precision whereas the value of correlation coefficient 0.9999 confirmed about the linearity of the method. The system suitability data and similarity factors were also found within the permissible range. The specificity study revealed that there was no placebo and diluent effect on the absorbance. Further, stability study of analytical solutions as well as estimation of drug content from market products were also performed.
KEYWORDS:Accuracy; Linearity; Method Validation; Ranitidine; Uv-Spectrophotometer
Introduction
Ranitidine or (Z)-N-{2-[({5-[(dimethylamino)methyl]furan-2-yl}methyl)sulfanyl]ethyl}-N‘-methyl-2-nitroethene-1,1-diamine (Fig. 1) was one of the earliest H2 histamine receptors antagonist approved for clinical use1. Soon after its discovery ranitidine was indicated against a variety of pathologies associated to gastric hyper-secretory conditions, for example, gastric ulcer, reflux acidity and heartburn2,3,4. In the late 1970’s the water solubility of ranitidine had been improved with its salt form ranitidine hydrochloride and soon it became the world’s best-selling drug5. It was among the top-selling pharmaceutical products before Food and Drugs Administration (FDA) found a carcinogenic impurity named N-nitrosodimethylamine (NDMA) above limit in some of the products in 2019 and subsequently recalled it from the market6,7. However, FDA is still investigating on the impurity issue and once this issue is resolved, the production may or may not resume7.
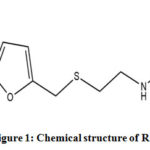 |
Figure 1: Chemical structure of Ranitidine. Click here to View figure |
Ranitidine hydrochloride, however, has a good physicochemical property. It has a high-water solubility and solutions are slightly acidic in nature8. There are different analytical methods that had been studied to determine the potency and impurities of ranitidine hydrochloride. Reverse phase high performance liquid chromatography (RP-HPLC) and UV-visible spectrophotometry had been studied to quantitatively analyze the drug from solid dosage forms9,10,11,12. Among them UV-spectrophotometric method had been found as the simplest and most cost-effective method of analysis8,13. At the same time, many authors had recommended the method for routine analysis of many drugs in the commercial settings13,14,15. Stability is another issue with ranitidine hydrochloride. Previously RP-HPLC and thin layer chromatography were used to the stability study and by-products of the drug16,17,18. UV-spectrophotometric methods were also addressed in the stability studies for the drug before19,20.
Analytical method validation techniques can check the repeatability of analytical methods. The current study was designed to establish and validate a routine analytical method regarding potency and stability of ranitidine hydrochloride using UV-visible spectrophotometry. Water was chosen as the diluent as it is suitable and cost-effective for the analysis of the drug21. The method was validated according to ICH and USP guidelines22,23.
Materials and Methods
Instrumentation and Reagents
UV-Visible spectrophotometer (3600 plus, Shimadzu, Japan) was used for the development and validation of the method. Sartorius analytical balance was used to measure the weight of standard and sample. Centrifugation of solution was performed by using Centrifuge EBA-20 (Sandberg). Ranitidine hydrochloride tablet and ranitidine hydrochloride USP reference standard were used for this experiment. Purified water was prepared in the laboratory.
Preparation of standard 1 and standard 2
20.10 mg Ranitidine hydrochloride RS (equivalent to18 mg of Ranitidine) was transferred into a 50 ml amber volumetric flask. Water was used as a diluent to obtain the volume about 30 ml. Afterward, the solution was sonicated for 15 minutes and cooled down. Again, diluent (water) was applied to make the volume up to mark. Further, 1 ml of this solution was withdrawn to another 50 ml volumetric flask and the same solvent was added for attaining the final volume. The resulting solution has a concentration of 0.072 mg/ml. For the preparation of standard 2, the process was repeated and the similarity factor was determined by applying the following equation:
Sample Preparation
20 tablets were weighed and crushed to make fine powder. Powder equivalent to 150 mg of ranitidine was poured into a 100 ml amber volumetric flask. After adding 70 ml diluent it was sonicated for 15 minutes. Then, the solution was cooled down and it was made up to the mark by adding diluent. The centrifugation of the solution at 3000 rpm for 10 minutes was carried out. Further, 1 ml was transferred into 50 ml amber volumetric flask and the final volume was filled with diluent. Again 6 ml solution was poured into a 25 ml amber volumetric flask and the volume was filled up to the mark with water to attain the final concentration of 0.0072 mg/ml. Then the absorbance was taken with UV Spectrophotometer at 314 nm and amount of ranitidine/unit dose was calculated using the following equation:

Validation Parameters
The parameters considered for the experiment include accuracy, precision, linearity, specificity, robustness and system suitability.
Accuracy
Accuracy was ascertained by applying of recovery studies. It was done by adding a known amount of standard above and below the label claim of pellets i.e. 80%, 100% & 120%24. Each level was carried out in triple times.
Preparation of sample for 80%, 100% and 120% recovery
Accurately weighed 133.6 mg of ranitidine hydrochloride (equivalent to 120 mg of ranitidine) and 177.4 mg of placebo for 80%, 167 mg of ranitidine hydrochloride (equivalent to 150 mg of ranitidine) and 144 mg of placebo for 100% and 200.94 mg of ranitidine hydrochloride (equivalent to 180 mg of ranitidine) and 110.06 mg of placebo for 120% into a 100 ml volumetric flask. After that, about 70 ml diluent was added and sonicated for 15 minutes. Then the solution was cooled down and diluent was added for making the volume up to the mark. Furthermore, centrifugation was performed at 3000 rpm for 20 minutes. Then, 1 ml of the solution was transferred into a 50 ml amber volumetric flask and same solvent was added to make the volume up to the mark. Again, 6 ml of the solution was taken into 25 ml amber volumetric flask and it was filled up to mark by adding water. The percent of recovery was calculated using the following equation.

Precision
In this experiment, repeatability and intermediate precision experiments was carried out for the evaluation of the precision of the developed method.
The repeatability can be elicited as a part of precision where the same experiment was performed under the same operating conditions over a short interval of time. Repeatability is also named as intra-assay precision and usually elucidated by repeated analysis of a single sample (e.g. use of the analytical procedure within a laboratory on the same day using the same analyst with the same equipment)25.
Intermediate precision expresses within-laboratory variations: different days, different analysts or equipment, etc. Usually, a different analyst repeats the repeatability of the experiment on the same sample on a different day, using different equipment if possible. In this study, for repeatability and intermediate precision, 6 repeated experiments were done and % RSD was calculated to assess the precision of the proposed method.
Linearity
The method is valid for its desired use throughout the specified ranges which can be assured from the linearity of a test result. Incremental concentrations of samples were prepared in the working range.
Preparation of linearity sample
Linearity samples were prepared at concentrations 50%, 80%, 100%, 120% and 150% of the theoretical claim of a single unit26. Accurately weighed 37.5 mg ranitidine was transferred into a 25 ml amber volumetric flask and diluent was added to fill the volume. Then 1 ml of this solution was diluted to make 50 ml with water. This is the mother stock solution with the concentration of 0.03 mg/ml.
For 50% sample, 6 ml of the mother solution was taken into a 50 ml volumetric flask and diluent was added up to the mark. The final concentration will be 0.0036 mg/ml. Again for 80%, 100%, 120% and 150% sample, 5 ml, 6 ml, 7 ml, 9 ml of the mother solution were taken into a 25 ml volumetric flask and required amount of diluent was added to make the volume up to mark. The concentration became 0.006 mg/ml, 0.0072 mg/ml, 0.0084 mg/ml, 0.0108 mg/ml, respectively. The absorbance’s of samples were taken as per the assay method and a graph was plotted of concentration of ranitidine versus the corresponding absorbance.
Robustness
Robustness of the developed method was evaluated by the capability of a method to produce similar result upon tiny thoughtful change of different parameters of the experimental method27. The experiment was carried out in three different wavelengths (312 nm, 314 nm and 316 nm), performed with amber and colorless glassware, with and without centrifuge as well as filtration.
Specificity
The specificity can be defined as the capacity of an analytical method to estimate exactly a particular analyte in the presence of excipient or other impurities28. For the preparation of the placebo sample, accurately weighed and transferred 144 mg of placebo into a 100 ml volumetric flask. Then followed the sample and standard preparation steps which was mentioned earlier. The spectrum of placebo, sample and standard solutions were taken separately for evaluating the specificity of proposed method.
System suitability study
The system suitability of a method refers to the suitability of a method for analysis and an integral part of method development. It refers to the checking of system to ensure the performance of that system. In this study, absorbance of five replicates of standard were taken to assess the system suitability of the method. It was executed before initiating the analysis29.
Stability of Analytical Solutions
Stability of analytical solutions (standard solution and sample solution) were determined by analyzing the solutions at 0 hour and at 72 h in room temperature (30°C).
Results and Discussion
Accuracy
Accuracy of the analytical method was evaluated by estimation of percentage recovery of known amount of standard. The attained percentage of recovery were within the range of 99.22–100.94% with %RDS of 0.60, which supports the compatibility of the method for routine drug analysis (Table 1).
Table 1: Accuracy study for Ranitidine
|
Level |
Weight of Placebo (mg) |
Amount of Std. added (mg) X |
Amount Recovered (mg) Y |
% Recovery (Y/X*100) |
Mean |
% RSD |
|
80% |
177.6 |
133.6 |
133.61 |
100.01 |
– |
– |
|
177.7 |
132.8 |
133.71 |
100.68 |
99.97 |
0.73 |
|
|
177.5 |
134.9 |
133.84 |
99.22 |
– |
– |
|
|
100%
|
143.7 |
171.9 |
171.32 |
99.68 |
– |
– |
|
143.6 |
169.9 |
171.46 |
100.92 |
100.13 |
0.68 |
|
|
143.6 |
171.7 |
171.37 |
99.81 |
– |
– |
|
|
`120% |
110.2 |
213.5 |
215.51 |
100.94 |
– |
– |
|
110.2 |
215.0 |
215.43 |
100.20 |
100.60 |
0.37 |
|
|
111.0 |
214.0 |
215.41 |
100.66 |
– |
– |
|
|
Mean (% recovery) 100.23 |
– |
|||||
|
%RSD 0.60 |
– |
|||||
Acceptance limit: Mean (% recovery) 98.00 % -102.00 % and %RSD must be 2.00%
Precision
A method is precise when under specified conditions, different measurements from the similar sample shows results in a specific and close range.30 In this experiment, intra-assay precision (repeatability) and intermediate precision were executed. Intermediate precision was performed by two different analysts on a different day, different instrument and it was found that the difference between the two results was 0.10 % (acceptance Limit: ± 2.00%). On the other hand, % RSD for repeatability and intermediate precision were 1.07% and 0.68%, respectively which is well below the permissible range, 2.00% (Table 2 & 3).
Table 2: Repeatability study for Ranitidine.
|
Determination No. |
Weight of Sample (mg) |
Weight of Std. (mg) |
Result (mg/Unit Dose) |
Assay (%) |
|
1. |
323.4 |
20.42 |
154.45 |
102.97 |
|
2. |
323.7 |
154.44 |
102.96 |
|
|
3. |
319.9 |
156.01 |
104.01 |
|
|
4. |
321.9 |
155.27 |
103.52 |
|
|
5. |
328.7 |
152.11 |
101.41 |
|
|
6. |
328.9 |
151.98 |
101.32 |
|
|
Mean of % Assay |
102.69 |
|||
|
% RSD |
1.07 |
|||
Acceptance Limit: %RSD must be 2.00%
Table 3: Intermediate precision study for Ranitidine.
|
Analyst 1 (Day 1) |
Analyst 2 (Day 2) |
||||
|
Determination No. |
Weight of sample (mg) |
Assay (%) |
Determination No. |
Weight of sample (mg) |
Assay (%) |
|
1. |
323.4 |
102.97 |
1. |
329.7 |
102.15 |
|
2. |
323.7 |
102.96 |
2. |
328.7 |
102.41 |
|
3. |
319.9 |
104.01 |
3. |
323.9 |
103.98 |
|
4. |
321.9 |
103.52 |
4. |
328.9 |
102.27 |
|
5. |
328.7 |
101.41 |
5. |
327.7 |
102.63 |
|
6. |
328.9 |
101.32 |
6. |
329.5 |
102.11 |
|
Mean Assay (%) % RSD |
102.69 102.59 1.07 0.68 |
||||
Difference between two results: 0.10 %, Acceptance Limit: ± 2.00% difference between two results and %RSD must be 2.00%
Linearity
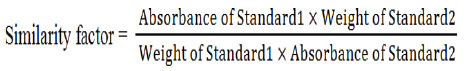
If concentration measurements over a different set of independent variables, such as absorbance, result in a proportional relationship, the method is said to be linear. The linearity of ranitidine was estimated in the concentration range of 0.0036 mg/ml to 0.0108 mg/ml. The line must be linear within the studied concentration range and the correlation coefficient of 0.9999 is generally regarded as acceptable31. Regression analysis deduced a linear equation: y = 46. 295x – 0.0014 (r2 =0.9999), indicating a linear relationship between the concentration of analyte and absorbance (Fig. 2).
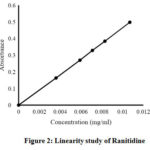 |
Figure 2: Linearity study of Ranitidine. Click here to View figure |
Table 4: Linearity study for Ranitidine.
|
Determination No. |
Concentration (mg/ml) (X Axis) |
Absorbance (Y Axis) |
|
1. |
0.0036 |
0.16302 |
|
2. |
0.0059 |
0.26962 |
|
3. |
0.0071 |
0.32835 |
|
4. |
0.0083 |
0.38574 |
|
5. |
0.0108 |
0.49754 |
Correlation of coefficient (r2) = 0.9999; Acceptance Limit: The value of r² must be > 0.999
Robustness
Robustness study showed that a minor change of method parameters doesn’t influence much on the final results (table 5). Small changes in parameter did not affect much on the percentage of drug content and in every case the percentage RSD was found within the permissible range which support robustness of the proposed method.
Table 5: Robustness study.
|
Parameters |
% Drug Content |
%Target |
% RSD |
|
Filtration: Yes |
97.06 |
100 |
1.49 |
|
Filtration: No |
99.14 |
100 |
|
|
Centrifuge: Yes |
97.88 |
100 |
1.23 |
|
Centrifuge: No |
99.61 |
100 |
|
|
Wavelength 312 nm |
98.83 |
100 |
0.34 |
|
Wavelength 314 nm |
99.25 |
100 |
|
|
Wavelength 316 nm |
98.58 |
100 |
|
|
Amber Glassware |
100.61 |
100 |
1.68 |
|
Colourless Glassware |
98.24 |
100 |
Acceptance Limit: %RSD must be 2.00%
Specificity
The specificity of the method was evaluated by comparing the absorbance of diluent plus placebo solution, standard solution, and sample solution. Fig. 3 demonstrated that there was no effect of diluent and placebo solution.
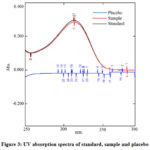 |
Figure 3: UV absorption spectra of standard, sample and placebo. |
System Suitability Study
The system suitability was evaluated by five replicate analyses of the ranitidine reference standard at a 100% level. The results of system suitability are represented in Table 6. Both % RSD and similarity factors for day 1 and day 2 were found within the acceptance limit.
Table 6: System suitability study for Ranitidine.
|
Day- 1 |
Day- 2 |
||||
|
Determination No. |
Absorbance |
Similarity Factor |
Determination No. |
Absorbance |
Similarity Factor |
|
1. |
0.34365 |
– |
1. |
0.34844 |
– |
|
2. |
0.34397 |
– |
2. |
0.34916 |
– |
|
3. |
0.34499 |
0.99 |
3. |
0.34871 |
1.01 |
|
4. |
0.34414 |
– |
4. |
0.34876 |
– |
|
5. |
0.34368 |
– |
5. |
0.34791 |
– |
|
|
% RSD 0.15 |
– |
% RSD 0.13 |
– |
|
Acceptance limit: % RSD ≤2.00%, Similarity Factor: 0.98-1.02
Stability of Analytical Solutions
Ranitidine reference standard and sample solutions showed good stability in diluent (water) over a period of 72 hours when stored at room temperature. Fig.4 suggested no spectrophotometric degradation during this period. The spectrum of analytical solutions after 72 hours was almost similar to the spectrum of freshly prepared solutions.
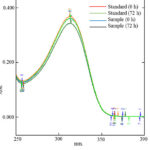 |
Figure 4: Stability of analytical solutions |
Assay of Commercial Dosage Form
Five different brands of ranitidine tablets were randomly purchased from medicine shop of Dhaka, Bangladesh. Then percentage content of ranitidine was determined by the proposed validated spectrophotometric method. Each experiment was performed in three replicates and are summarized in Table 7.
Table 7: Estimation of Ranitidine in commercial formulations
|
Brand |
Labeled amount (mg) |
Obtained amount (mg) |
% Drug content |
|
SP-1 |
150 |
150.39 |
100. 26 |
|
SP-2 |
150 |
148.64 |
99.09 |
|
SP-3 |
150 |
147.36 |
98. 24 |
|
SP-4 |
150 |
153.17 |
102.11 |
|
SP-5 |
150 |
151.23 |
100.82 |
Conclusion
The experiment propounds a new and simpler pattern of analytical method validation of ranitidine in tablet dosage forms with UV-visible spectrophotometer. The use of water as a diluent made it cost-effective too. The method is precise and reproducible as well while the percent recovery data was in agreement with the claims in the label. From the concentration ranging from 0.0036 mg/ml to 0.0108 mg/ml, the results were found having linear relationship. .It is also found robust, that is, small variations of parameters did not affect the method. It is specific and selective, free of any placebo effect. The analytical solutions also found stable for 72 hours. Further, this propounded method were able to determine the content of ranitidine in five different brands of ranitidine tablets. As the proposed method is easy, rapid, affordable with satisfied accuracy, precision, linearity, specificity, robustness and reproducibility, it can be recommended for the determination of the amount of ranitidine in tablet dosage form.
Acknowledgements
The first author, Subrata Paul is grateful to Square Pharmaceuticals Limited, Bangladesh for supplying the Ranitidine (sample) and Ranitidine (standard).
Conflict of Interest
There are no conflict of interest to declare.
References
- Ganellin, C. R. Analogue-Based Drug Discovery., 2006, 71-80.
- Gaginella, T. S.; Bauman, J. H. Drug. Intell. Clin. Pharm., 1983, 17(12), 873-885.
CrossRef - Brogden, R.N.; Heel, R.C.; Speight, T. M.; Avery, G. S. Drugs., 1978, 15(2), 93-131.
CrossRef - Zeldis, J. B.; Friedman, L. S.; Isselbacher, K. J. N. Engl. J. Med., 1983, 309(22), 1368-1373.
CrossRef - Li J. J. Oxford University Press., 2014.
- Aschenbrenner, D. S. Am. J. Nurs., 2020, 120(8), 23.
CrossRef - Wagner, J. A.; Colombo, J. M. Clin. Transl. Sci., 2020.
- Shah, R. B.; Hullahalli, P. R.; Tawakkul, M. A.; Faustino, P. J.; Nguyenpho, A.; Khan, M. A. Clin. Res. Regul. Aff., 2006, 23(1), 35-51.
CrossRef - Haque, A.; Shahriar, M.; Parvin, M. N.; Islam, S. M. Asian. J. Pharm., 2011, 1(3), 59-63.
- Beaulieux, N.; Lacroix, P. M.; Sears, R. W.; Lovering, E. G. J. Pharm. Sci., 1988, 77(10), 889-892.
CrossRef - US pharmacopoeial convention. United States Pharmacopeia. Asian edition, US pharmacopoeial convention, Inc.: US, 2009.
- Charde, M. S.; Walode, S. G.; Tajne, M. R.; Kasture, A. V. Indian J. Pharm. Sci., 2006, 68(5), 658-659.
CrossRef - Haque, T.; Talukder, M. M. U.; Laila, S.; Fatema, K.; Kabir, A. K. L. S. J. Pharm., 2008, 1(1), 18-24.
CrossRef - Paul, S.; Mia, M.A.K.; Sarker, S.; Biswas, S.; Bal, P.; Dey, T.R.; Pal, T.K. Orient. J. Chem., 2020, 36 (5), 908-914.
CrossRef - Behera, S.; Ghanty, S.; Ahmad, F.; Santra, S.; Banerjee, S. J. Anal. Bioanal. Tech., 2012, 3(6), 151-7.
- Vehabovic, M.; Hadzovic, S.; Stambolic, F.; Hadzic, A.; Vranjes, E.; Haracic, E. Int. J. Pharm., 2003, 256(1-2), 109-115.
CrossRef - Evans, M. B.; Haywood, P. A.; Johnson, D.; Martin-Smith, M.; Munro, G.; Wahlich, J. C. J. Pharm. Biomed.,1989, 7(1), 1-22.
CrossRef - Wong, C. F.; Peh, K. K.; Yuen, K. H. J. Chromatogr. B Biomed. Appl., 1998, 718(1), 205-210.
CrossRef - Kelani, K. M.; Aziz, A. M.; Hegazy, M. A.; Abdel Fattah, L. Anal. Lett., 2002, 35(6), 1055-1073.
CrossRef - Orsine, E. M. D. A.; Martins, J. L. S. Anal. Lett., 1993, 26(9), 1933-1941.
CrossRef - Desta, K.; Amare, M. Chem. Int., 2017, 3(3), 288-295.
- ICH Guideline; Validation of Analytical Procedures: Text and Methodology. Topic Q 2 (R1). (2005). Geneva, Switzerland.
- United States Pharmacopoeia (2003) United States Pharmacopeial Convention, 26th Edition, Rockville, MD.
- Dhanwate, S.S.; Pachauri, A.D.; Ghode, P.D.; Khandelwal, K.R. J. Pharm. Sci. & Res., 2019, 11(8), 2886-2890.
- Haque, M.A.; Naznin, A.; Kabir, A.H.; Hossain, M.K.; Islam, S.A. Dhaka Univ. J. Pharm., 2010, 9(2), 131-138.
CrossRef - Chandran, S.; Singh, R.S. Pharmazie., 2007, 62(1), 4-14.
CrossRef - Naseef, H.; Moqadi, R.; Qurt, M. J. Anal. Methods. Chem., 2018, 1902510.
CrossRef - Batrawi, N.; Naseef, H.; Al-Rimawi, F. J. Anal. Methods. Chem., 2017, 1529280.
CrossRef - Sharma, S.; Goyal, S.; Chauhan, K. Int. J. App. Pharm., 2018, 10(6), 8-15.
CrossRef - FDA. (2010). Guidance for Industry: VALIDATION OF ANALYTICAL PROCEDURES: DEFINITION AND TERMINOLOGY.
- Miller, J.N. Analyst., 1991, 116(1), 3-14.
Accepted on: 15-12-2020


![]()


