Stability Indicating RP-HPLC Method Development for Related Substances of Anti-Histamine Promethazine Hydrochloride and its Validation Study.
Nilesh Takale1 , Neelakandan Kaliyaperumal2, Gopal Krishnan1, Mannathusamy2 and Raja Rajan Govindasamy2
1Department of Chemistry, Annamalai University, Annamalai Nagar, Chidambaram, Tamilnadu, India.
2Analytical Research Centre, Emcure Pharmaceuticals Limited, Hinjawadi, Pune-411057, Maharashtra, India.
Corresponding Author E-mail: rajarajang70@gmail.com
DOI : http://dx.doi.org/10.13005/ojc/360513
Download this article as:
![]()
A smooth, specific, precise, and accurate, high-performance reverse phase (RP-HPLC) method for determining related antihistamine substances Promethazine Hydrochloride (PMZ∙HCI) has been recorded. The RP-HPLC system is developed and tested in compliance with recommendations Q2(R1) of the International Council for Harmonization (ICH). Column 5 and reverse step with linear gradient elution is accomplished in Symmetry Shield RP8 (4.6 mm x 150 mm). Mobile phase A is 3.4% in the 7.0 pH water, modified to dilute potassium hydroxide solution. In contrast, the 60:40 mixture of acetonitrile and methanol combination as mobile phase B. The handled phase with a continuous flow rate of 1.0 ml min−1 is provided by choosing the wavelength 254 nm using a PDA / UV detector. The temperature of the column oven and sampler is 25°C and 4°C, respectively. The injection amount chosen is 10.0 μL. The method is linear in the quantitation limit range (LOQ) to 150 percent concerning the specification impurity concentration limit. Both impurities and PMZ have a correlation coefficient of greater than 0.999. The LOQ for all known impurities and PMZs has a specification limit of between 10 to 30%. The relative response factor for all four known impurities is calculated. The unexplained peaks are very different; the effects obtained are similar to the original values. There are no significant improvements to the device suitability parameters, such as tailing factor, theoretical sheets, and RSD rate in Robustness Studies. The forced degradation analysis of PMZ∙HCI was performed. This RP-HPLC is descriptive, accurate, and precise. This further defines the parameters of linearity, consistency, and robustness used for regular quality control analysis.
KEYWORDS:Anti-Histaminic; PMZ•HCI; Quantitative Analysis; RP-UPLC; Stability Indicating
Introduction
Promethazine (PMZ), ), 10 H-Phenothiazine-10-ethanamine, N,N,a-trimethylmonohydrochlorid is a common antihistamine pharmaceutical drug that is sold as hydrochloride salt (PMZ·HCI). (see Fig.1). PMZ is an antihistamine agent of the first generation used to treat allergies, sleep disorders and nausea1. It was approved in the United States for medical use in 1951. PMZ is a derivative of phenothiazine and structurally different from the same but different effects2 of phenothiazine. PMZ is a crystalline powder that is white to faint-yellow odorless. PMZ hydrochloride salt can be freely water soluble and slightly alcohol soluble. It is also a chiral compound, which occurs as an enantiomer mixture3. PMZ is molecular in C17H20N2S.HCI and weight 320.88 g/mol. It is preserved under nitrogen at 25°C in tight, light-resistant containers.
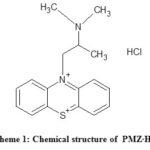 |
Scheme 1: Chemical structure of PMZ∙HCI. Click here to View scheme |
Materials And Methods
The Promethazine (PMZ) sample and its impurities are taken from Emcure Limited Pharmaceutical Center for Analytical Analysis, Hinjawadi, Pune. Potassium phosphate analytic grade, potassium hydroxide, and millet-Q grade purified water. For a mobile phase and diluent preparation, gradient methanol, acetonitrile, and triethylamine are used. The research equilibrium shall be used for the metler toledo and the HPLC waters with UV / PDA detector using the empower two software of data acquisition and calculations.
Mobile Phase A
3.4% of potassium dihydrogen phosphate solution homogeneously in water with 7 pH adjusted in the ratio of 40:40:20 by the dilute potassium hydroxide solution, acetonitrile, and methanol
Mobile Phase B
The homogeneous mixture of acetonitrile and methanol in the ratio of 60:40
Diluent
0.1% solution of triethylamine in methanol
Standard and Test Preparation
Weighed 100 mg standard/test sample of Promethazine, 100 mL volumetric flask was dissolved and diluted with diluent. 5.0 mL pipetted above solution in 100 mL flask and diluted with the diluent amount.
Method Development
The PMZ and its related impurities are polar molecules; hence reverse phase (RP) chromatography is used to establish the associated substances. The fixed phase of chromatography in the reversed-phase is non-polar as C4, C8, C18, and polar as the mobile phase is water, acetonitrile, methanol, or buffer solution. The document shows several HPLC methods for estimating promethazine hydrochloride in bulk medicinal products and formulations4-8. No specific method for determining related substances was reported in the literature. RP-HPLC technique were therefore used for the determination of PMZ∙HCI related materials.
Other parameters such as column temperature, diluents, wavelength, and pH are also crucial in developing an HPLC method and stationary and mobile phases. The stationary phase of the HPLC method screened from specific Hypersil BDS C8, and Symmetry Shield RP8 is both 4.6 mm internal diameter, 150 mm long, and 5μ particle size. Such 150 mm and 250 mm long Hypersil BDS C8 and Symmetry Shield RP8 columns. When the symmetry shield RP8 (4.6 x 150 mm) is added to 5μ, enhanced impurity separation, maximum sharpness, and sufficiently adjustable device parameters, i.e., tailing and theoretical plates, are achieved. The pKa value of the target molecules guides the mobile phase buffer selection. Powdered potassium phosphate buffer is chosen here for the preparation of the mobile phase. It is the homogeneous combination of 3.4% potassium dihydrogen phosphate solution in water at 7.0% pH change of diluted potassium hydroxide solution, acetonitrile and methanol with 40:40:20 ratio used as mobile phase A, in which 60:40 mixed acetonitrile and methanol is mobile phase A. The chromatographic development method for PMZ∙HCI is mentioned in table 1.
Table 1: Chromatographic conditions for the related substances RP-HPLC method of PMZ∙HCI.
|
Instrument |
HPLC equipped with an injector, pump UV/PDA detector and recorder |
|
Column |
Symmetry Shield RP8 (4.6 mm x 150 mm) 5m |
|
Wavelength |
254 nm |
|
Flow rate |
1.0 mL/min |
|
Injection volume |
1.0 µL. |
|
Column oven temperature |
50°C |
|
Auto sampler temperature |
4ºC |
|
Run time |
65 mins |
Also, the HPLC analysis was carried out with the gradient method, as at the beginning, the composition of step A and B was used at 70:30, which is gradually changed to 40:60 and up to 45 minutes. It is adjusted to a ratio of 35:65 up to 50 min. It lasts up to 52 minutes, then it suddenly hits initial values of 70:30 and is sustained for up to 65 minutes throughout the entire course.
Results and Discussion
The analytical method validation study was carried out as per ICH guideline Q2(R1)9-12. The analytical method validation parameters are discussed below.
Specificity
The specificity study conducted by spiking with an adequate level of known impurities (up to 0.15% concentration) into pure substances and demonstrating findings is not affected by the presence of these spike impurities. A blank run shows no intervening PMZ peak and its associated impurities. The PMZ peak is well-differentiated from recognized impurities (Fig . 1). The peak purity angle of PMZ and its related impurities is less than the threshold for standard, non-spiked, and spike test solutions (Table 2). The percent relative deflection (%RSD) of six standard solutions replicates with a mixture of impurities A to D and PMZ∙HCI are 0.60, 0.87 to 1.86, and 0.69 to 4.58 percent. The resolution between the near escape of impurities B and A is 5.72, which indicates a sharp break between these peaks.
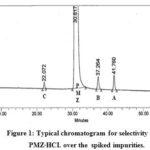 |
Figure 1: Typical chromatogram for selectivity in the PMZ∙HCI. over the spiked impurities. |
Table 2: The selectivity data in the PMZ∙HCI over spiked impurities up to 0.15 % of concentration in test solution.
|
Impurities* |
Retention Time |
Area |
RT ratio |
Tailing factor |
Resolution |
Purity Angle |
Purity threshold |
Peak purity |
|
D |
6.307 |
8388 |
0.20 |
1.09 |
— |
1.599 |
2.058 |
Pass |
|
C |
22.072 |
32206 |
0.72 |
1.07 |
35.61 |
3.205 |
3.889 |
Pass |
|
PMZ |
30.817 |
23713179 |
1.00 |
1.41 |
13.61 |
0.087 |
0.265 |
Pass |
|
B |
37.264 |
85577 |
1.21 |
1.21 |
8.60 |
2.187 |
2.606 |
Pass |
|
A |
41.760 |
83675 |
1.36 |
1.11 |
6.72 |
1.948 |
2.296 |
Pass |
* Impurities are represented by alphabets A to D.
Determination of Limit of Detection and Limit of Quantitation
The detection limit (LOD) is the smallest concentration of an analyte in a solution that can only be detected but quantitatively measured. At the same time, the LOQ is the lowest amount of analyte in a sample solution, which can be quantitatively determined with sufficient precision and accuracy. In this analysis, LOD and LOQ levels are calculated by injecting the various concentrations in the standard solutions (between 10 and 120%) of PMZ·HCI (0.1%) and its maximum concentrations in impurity A to D (0.15%) and calculating the signal-to-noise ratio. The expected LOD and LOQ data in table 3 are shown.
Table 3: The predicted LOD, LOQ concentration and s/n ratio value of LOQ level of PMZ∙HCI and its related impurities A to D.
| Impurites | LOQ in % w.r.t test | S/N of LOQ level | LOD in % w.r.t test |
| D | 0.029 | 21 | 0.010 |
| C | 0.015 | 14 | 0.005 |
| PMZ | 0.019 | 18 | 0.006 |
| B | 0.013 | 14 | 0.004 |
| A | 0.008 | 16 | 0.003 |
Linearity and Range
The linearity was determined by using the standard solutions of impurities and by PMZ∙HCI at the level of LOQ at a 150 percent level (incl.50, 80, 100, and 120 %). The concentrations of LOD and LOQ, correlation coefficient, and linearity data intercept are shown in Table 4 and the corresponding linearity graph. Linearity data are shown in Table 4. The concentration data for the peak areas versus were treated with less square analysis of linear regression and the correlation coefficients obtained for all impurities and PMZ∙HCI are higher than 0.999. The linearity graph reveals that the PMZ∙HCI research sample has variations in A-D impurities. Uncleanness D has a lower reaction, whereas uncleanness A has more significant reaction overall known impurities found in PMZ∙HCI.
Table 4: The concentration of LOQ, LOD, area for the correlation coefficient, slope, intercept as well as RRF of impurites A to D and PMZ∙HCI.
| Impurites | LOQ in % w.r.t test | LOD in % w.r.t test | Area for 0.15 % conc. | Correlation Coefficient | Slope | Intercept | % Y intercept | RRF |
| D | 0.029 | 0.010 | 11187 | 0.99960 | 15336 | 93 | 0.83 | 3.88 |
| C | 0.015 | 0.005 | 42575 | 0.99987 | 56243 | 61 | 0.14 | 1.06 |
| PMZ | 0.019 | 0.006 | 28525 | 0.99951 | 59541 | 1055 | 3.69 | 1.00 |
| B | 0.013 | 0.004 | 83281 | 0.99980 | 64652 | 434 | 0.52 | 0.92 |
| A | 0.008 | 0.003 | 101616 | 0.99967 | 134056 | 300 | 0.30 | 0.44 |
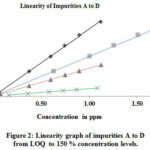 |
Figure 2: Linearity graph of impurities A to D from LOQ to 150 % concentration levels. Click here to View figure |
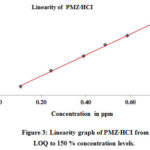 |
Figure 3: Linearity graph of PMZ∙HCI from LOQ to 150 % concentration levels. Click here to View figure |
Relative Response Factor
The RRF is a practical approach for the systematic study of impurities found in drug compounds and their components. The RRF is usually specific for each impurity and is independently calculated. It can not be used to measure the concentration of respective ingredients by other detectors for one particular detector type. The RRF value depends on the response of PMZ∙HCI and its known impurities. The RRF values observed for known impurities A to D range from 0.44 to 3.88 to RRF of PMZ.HCI 1.00 for unknown impurities measurement.
Precision
The precision study is divided into repeatability, intermediate precision, and reproducibility. Six replicates of PMZ.HCI study system precision with a regular mixed impurity solution. The repetitiveness of the relevant compounds was accomplished by injecting six individual test sample solutions with the concentration of identified impurities in the spiking definition stage. The percentage of impurities and the percentage RSD of the solution is determined.
The intermediate precision is measured by multiple observers in the same laboratory on different days with different instruments and tables. Repeatability RSD percentage (n=6) and intermediate precision (n=6) of impurities tests were determined. RSD percent of the six spike test preparations for impurities A to D and overall impurities are 1,68, 1,19, 0,83, 1,66 and 1,06 and RSD for 12 samples ( i.e. six from repeatability and six from intermediate accuracy) are 2.40, 2,59, 1,44 and 1,63 respectively. The reproducibility indicates joint research widely used for technique standardization. Table 5 displays the comparative results for percentage impurities of repetitiveness and moderate accuracy.
Accuracy
The reliability of an analytical procedure is the continuity of the actual value and value observed. A three-fold accuracy impurity analysis was performed at the LOQ level of 50, 100, and 150% of the test solution’s stated impurities concentration. The quality of known impurities has been found well below the admission criterion. The average accuracy of the percent and its standard deviation from its LOQ, 50%, 100%, and 150% of the specification level specified in Table 6.
Table 5: Repeatability Comparative Results (REP) and Medium Precision (IP) at spiked check (0.15% spike of each impurity).
| Tests | Imurities concentration in % | |||||||||
| % of A | % of B | % of C | % of D | % of E | ||||||
| REP | IP | REP | IP | REP | IP | REP | IP | REP | IP | |
| Spiked test- 1 | 0.153 | 0.143 | 0.246 | 0.233 | 0.144 | 0.149 | 0.158 | 0.153 | 0.701 | 0.678 |
| Spiked test- 2 | 0.149 | 0.142 | 0.245 | 0.229 | 0.146 | 0.147 | 0.157 | 0.152 | 0.697 | 0.670 |
| Spiked test- 3 | 0.146 | 0.143 | 0.240 | 0.234 | 0.143 | 0.148 | 0.157 | 0.152 | 0.686 | 0.677 |
| Spiked test-4 | 0.147 | 0.144 | 0.243 | 0.233 | 0.146 | 0.150 | 0.155 | 0.154 | 0.691 | 0.681 |
| Spiked test- 5 | 0.148 | 0.143 | 0.242 | 0.236 | 0.144 | 0.147 | 0.155 | 0.152 | 0.689 | 0.678 |
| Spiked test- 6 | 0.150 | 0.143 | 0.248 | 0.234 | 0.145 | 0.146 | 0.162 | 0.151 | 0.705 | 0.674 |
| Mean (n=6) | 0.149 | 0.143 | 0.244 | 0.233 | 0.145 | 0.148 | 0.157 | 0.152 | 0.695 | 0.676 |
| SD (n=6) | 0.0025 | 0.0006 | 0.0029 | 0.0023 | 0.0012 | 0.0015 | 0.0026 | 0.0010 | 0.0074 | 0.0038 |
| % RSD (n=6) | 1.68 | 0.42 | 1.19 | 0.99 | 0.83 | 1.01 | 1.66 | 0.66 | 1.06 | 0.56 |
| Mean (n=12) | 0.146 | 0.239 | 0.146 | 0.155 | 0.686 | |||||
| SD (n=12) | 0.0035 | 0.0062 | 0.0021 | 0.0032 | 0.0112 | |||||
| %RSD (n=12) | 2.40 | 2.59 | 1.44 | 2.06 | 1.63 |
Table 6: %Accuracy data of known impurities of PMZ∙HCI.
| Impuritess | LOQ level (n=3) | 50 % level (n=3) | 100 % level (n=3) | 150 % level (n=3) |
| A | 104.17 | 96.00 | 95.11 | 95.10 |
| B | 100.00 | 95.12 | 94.59 | 95.66 |
| C | 106.67 | 99.10 | 99.77 | 99.70 |
| D | 89.89 | 98.63 | 96.15 | 96.22 |
Solution Stability
The consistency of the test solution was maintained on a routine basis for up to 3 days at room temperature. The percentage recovery of known impurities for the test solution was determined. All known impurities except impurity B have total RSD percent values under the admission criterion. Cumulative level RSD impurity B values are up to 1 day appropriate. This shows that the test preparation is stable until one day if it is kept at room temperature.
Robustness
In the robustness test, the experimental conditions such as flow rate of the mobile process are intentionally changed, oven column temperature adjustment, and the specific bunch of columns are used. Considering these significant fluid differences as well as the temperature of the column oven. It is determined that a robustness analysis carried out at a flow rate modified by ±10% of the real flow rate shown in the process. The maximum mobile phase flow rate is 1.0 mL/min, between 0.9 mL/min, between 1.1 mL/min. The oven column temperature in the initial system is altered by 30°C to 20°C at a temperature between ±5°C to 25°C. The buffer pH is adjusted by 0.2. The average accuracy measurements are conducted on various column lots that display no differences in the performance. In both cases, the retention periods differ by ±0.2 minutes in contrast with accurate retention. For these intentionally variable chromatographic conditions (flow rate, pH column oven temperature, and multiple column lots), significant improvements for system suitability parameters, such as tailing factor, theoretical plates, and the percent RSD, are not detectable. Such criteria ‘s principles are far beyond reasonable limits. Table 7 gives the total mean and percent RSD of n=8 test preparations (6 from repeatability and 2 from robustness).
Table 7: The overall mean ![]() and % RSD of repeatability and robustness study in spiked test preparations (n=8)*
and % RSD of repeatability and robustness study in spiked test preparations (n=8)*
Forced Degradation Study
The forced degradation study13-15 is useful to pick an overview of stabilization showing conditions. The test of degradation was performed for aqueous, photolytic, thermal, temperature, acidic, necessary, and oxidative stress conditions. PMZ∙HCI is subjected to thermal, photolytic, and humidity stress conditions, while 50 mg of PMZ∙HCI is dissolved in the 5.0 mL dilution sample and is subject to similar stress conditions in acid, alkaline, and oxidation degradation tests. Table 8 displays degradation results under these conditions.
For photolytic degradations, the test samples were subjected to a near-UV light of 200 W•h·m−2 until the energy of 1.2 x 10⁶ lux h. The humidity degradation took place at a relative humidity of 75 percent at 40°C for over 24 hours.
24 h. 24. All of the above samples are prepared using the current analytical process PMZ∙HCI at a similar concentration (1000 ppm). Any physical and chemical modifications were found during the heat, humidity, and photolytic stress analysis. The PMZ∙HCI peak region was constant without a degradation point, which suggests that this molecule is stable at temperature, humidity, and photolytic stress.
The figure illustrates the chromatograms of the degradation from blank-aqueous, test-aqueous, blank-oxidation, and test-oxidation (Fig . 4 to Fig. 7). Both known and decaying impurities are well isolated from the PMZ∙HCI and have the maximum pure requirements. The extra 2.0 mL of 30 percent H2O2 depletion has kept the solution at room temperature for 15 min. The PMZ has been reduced by 11.99 percent, mainly to impurity D. The alkali degradation was achieved by the application of 5.0 mL of 5.0 NaOH to test the solution held for 30 minutes at room temperature, neutralized with HCI and diluted to the limit after the heat was finished. Yet there is no degradation. In acid oxidation, the 5.0 mL 5.0 N HCI sample was exposed to the solution for 30 min at room temperature. It neutralized with NaOH after time had done. However, no declining peak is detected.
Table 8: The stress conditions with % degradation impurities of PMZ∙HCI
| Stress Condition | Exposure period | % degradation impurities | Major degradants |
| Untreated test preparation | – | — | — |
| Humidity degradation | 40°C, 75% RH for 24 h | — | — |
| Thermal degradation | 105°C for 24 h | — | — |
| Photolytic degradation | Light energy of 1.2 million lux hours and near UV 200 watt hrs./m2 | — | — |
| Aqueous degradation | 5.0 mL, 24 h at room temp. | 5.62 | Impurity A |
| Acid Degradation | 5.0 mL 5.0 N HCI kept the solution for 30 min at room temp. | — | — |
| Alkali Degradation | 5.0 mL 5.0 N NaOH kept the solution for 30 min at room temp. | — | — |
| Oxidation degradation | 2.0 mL 30% H2O2 kept the solution for 15 min at room temp. | 11.99 | Impurity-D |
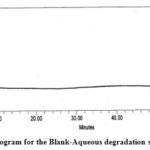 |
Figure 4: Chromatogram for the Blank-Aqueous degradation study of PMZ∙HCI |
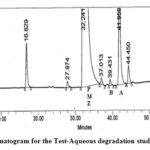 |
Figure 5: Chromatogram for the Test-Aqueous degradation study of PMZ∙HCI |
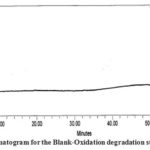 |
Figure 6: Chromatogram for the Blank-Oxidation degradation study of PMZ∙HCI |
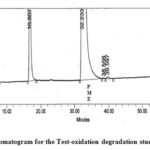 |
Figure 7: Chromatogram for the Test-oxidation degradation study of PMZ∙HCI |
Conclusion
A highly reliable and precise stability system of RP-HPLC is developed and successfully tested in compliance with the ICH Guidelines Q2(R1) for the PMZ·HCI based material analysis of an API. The characteristics demonstrate that the PMZ optimum is well-resolved from both known and unknown impurities. Concerning performance concentration, this approach is linear to the LOQ point of 150 percent and measured correlation coefficient of all identified impurities above 0.999. The robustness analysis showed no significant improvement to device suitability parameters, such as tailing component, theoretical plates, and percent RSD. The humidity, photolytic, and heat stress factors have not revealed changes in the physical appearance of the sample or peak areas of the PMZ·HCI, thereby suggesting their resilience under these stress conditions. No deterioration was found in the acid and alkaline environments. In the case of aqueous and oxidation degradations, the entire established and the impurities, are isolated explicitly from the PMZ∙HCI optimum, and the full pureness requirements have been achieved. This approach is precise, sequential, reliable, descriptive, durable, and stable and can be used for routine quality assurance analysis.
Acknowledgement
Both authors thanked Dr. Mukund Gurjar, Emcure Pharmaceuticals Limited, Analytical Research Centre, Hinjawadi, Pune for their support and allowed this work to be published.
Conflict of Interest
None.
References
- Promethazine Hydrochloride Monograph for Professionals, Drugs.com, American Society of Health-System Pharmacists, Retrieved 24 October 2018.
- Strenkoski-Nix, L.C.;Ermer, J.;DeCleene,S.;Cevallos, W.;Mayer, P.R. Pharmacokinetics of promethazine hydrochloride after administration of rectal suppositories and oral syrup to healthy subjects, Am. J. Health-Syst. Pharm., 2000, 57 (16): 1499–1505.
CrossRef - Rx list, Promethazine description, 2007.
- Dutt,M.C.;Ng,T.L.;Long,L.J. AOAC Intern. 1983,66,1455.
CrossRef - United States Pharmacopoeia USP 24/NF 19, US Pharmacopoeial Convention. Inc., USA, 2000, 2149.
- Thumma, S.; Zhang S.Q.;Repka M.A. Development and validation of a HPLC method for the analysis of promethazine hydrochloride in hot-melt extruded dosage forms. J. Pharm. Biomed. Anal. 2008,63(8), 562-567.
- Kakadiya, j.;Parmar,N.;Shah, N. Development and validation of RP-HPLC method for simulteneous estimation of Promethazine hydrochloride and Paracetamol in combined liquid formulation. Asian journal of research in biological and pharmaceutical sciences., 2014,2(1), 11-26.
- ICH guidelines; Q8 (R2), Harmonised Tripartite Guideline, on Pharmaceutical development. Proceedings of the International Conference on Harmonization, 2009.
- ICH guidelines; Q3A (R2), Impurities in new drug substances, in: International Conference on Harmonization, Geneva, 2006.
- ICH guidelines, Q1A(R2); Stability Testing of New Drug Substances and Products, International Council for Harmonization Geneva.
- (http://wwwichorg/products/guidelines/quality/article/quality-guidelines/html), 2003.
- ICH guidelines, Q2 (R1): Validation of Analytical Procedures: Text and Methodology,International Conference on Harmonization Geneva. (http://wwwichorg/products/guidelines/quality/article/quality-guidelines/html), 2005.
- Reynolds, D. W. Forced degradation of pharmaceuticals. American Pharmaceutical Review, 2004, 7 (3), 56-61.
- Gorge, N. Forced degradation as an integral part of HPLC stability-indicating method development. Drug Deliv. Technol,2010, 10(5), 56-59.
- Blessy, M., Ruchi, P., Prajesh, P., Yadvendra, A. Development of forced degradation and stability indicating studies of drugs-a review. J. Pharm. Anal,2010, 4, 159-165.
CrossRef
Accepted on: 11-09-2020


ISSN Online: 2231-5039

![]()


