Application of Surfactant-Modified Bentonite for Methylene Blue Adsorption from Aqueous Solution
Davoud Balarak1, Maryam Bazzi2, Zaccheus Shehu3 and Kethineni Chandrika4*
1Department of Environmental Health, Health Promotion Research Center, Zahedan University of Medical Sciences, Zahedan, Iran.
2Department of Environmental Health, Student Research Committee, Zahedan University of Medical Sciences, Zahedan, Iran
3Chemistry Department, Faculty of Science Gombe State University, Nigeria
4Department of Petroleum Engineering, KoneruLakshmaiah Education Foundation, Vaddeswaram, Guntur, AP, India–52250
Corresponding Author E-mail: kkchandrika2019@gmail.com
DOI : http://dx.doi.org/10.13005/ojc/360212
Article Received on : 10 Feb 2020
Article Accepted on : 16 Apr 2020
Article Published : 28 Apr 2020
Dye is an important chemical and, recently, its application in the world has boosted; however the skin irritation and cancer are of the detrimental effects of this chemical. Therefore, prior to discharge, the dye-contain effluents, in order to meet the standard values, should be treated. The present work are seeking to appraise the kinetics and isotherms of the Methylene Blue (MB) adsorption onto the surfactant (cetyltrimethylammonium bromide)-modified bentonite (CTAB-MB) in a batch study in a laboratory. The study of the MB adsorption efficiency was accomplished in batch system under different amount of effective parameters including contact time, adsorbent dosages and MB dye concentration. Optimum CTAB-MB dosage and contact time was achieved to be 2.5 g/L and 75 min, respectively. The results of isotherm studies showed the better ability of Langmuir mono-layer isotherm in explanation of the equilibrium data and the highest adsorption capacity, based on this model, was obtained to be 36.19 mg/g. According our obtained results, the CTAB-MB was obtained to be potent and efficient adsorbent to remove the MB from the studied synthetic solutions.
KEYWORDS:Adsorption Behavior; Methylene Blue; Surfactant-Modified Bentonite
Download this article as:| Copy the following to cite this article: Balarak D , Bazzi M, Shehu Z Chandrika K. Application of Surfactant-Modified Bentonite for Methylene Blue Adsorption from Aqueous Solution. Orient J Chem 2020;36(2). |
| Copy the following to cite this URL: Balarak D , Bazzi M, Shehu Z Chandrika K. Application of Surfactant-Modified Bentonite for Methylene Blue Adsorption from Aqueous Solution. Orient J Chem 2020;36(2). Available from: https://bit.ly/2VKm1XL |
Introduction
The water pollution through the toxic substances has mentioned as a desperate issue because it affects various sectors of life cycle 1, 2. The textile industries have been identified as the basic industries in all countries, and the colorful wastewater is the main character of these industries, since the dyes are vastly consumed in these industries 3, 4. These industries remarkably use the synthetic dyes and the classifications of these types of dyes include acidic, reactive, direct, basic dyes, organic and mineral materials 5, 6. Methylene blue (MB) is classified in the thiazine class and is a widely used cationic dye in the industries, e.g., textile, paper, plastics, food industries and medicine 7, 8.
Discharging the dye-contained wastewaters into the aquatic environment have created various obstacles such as aesthetic issues, disrupting the sunlight penetration into the deep layers and photosynthetic performance in aquatic plants; the evidence towards their undeniable role in eutrophication, rising the wastewaters hardness and turbidity, death and destruction of microorganisms in surface waters and gradual poisoning of human has been determined 9-11.
Hence, these kinds of effluents are serious environmental risks which should be eliminated by the best methods prior to discharge into the aquatic media 12, 13. The membrane separation, flocculation- coagulation, electrochemical, reverse osmosis, ozone oxidation, and biological treatments are of the extensively applied techniques to remove the dyes 14, 15. Despite their incredible efficiency and applicability in removing the dyes, the cost and complexity of these methods decreased the tendency to apply these methods 16, 17.
The adsorption is a valuable and economical alternative used for removing the pollutants which it has remarkable efficiency for recycling the adsorbent and adsorbate materials 18, 19. Numerous attempts have broadly conducted on various novel and common adsorbents and the activated carbon has introduced as the propitious adsorbent for elimination of the pollutants, since it has a great performance for this purpose 20, 21. Nevertheless, its large-scale application has the economic limitations, since it is expensive and is associated with high regeneration cost 18.
Therefore, finding the novel and low-priced adsorbents has presently gained nice attention among the scientists 22. In keeping with the reports, the adsorbent with the requisites such as the need for little processing, great abundance and being a by-product or waste of an industry is inexpensive 23. Hence, the attention towards the natural adsorbents to exterminate various contaminants has recently increased 24. The bentonite clay, as anatural adsorbents, is a mineral formed into a layer with one octahedral sheet and two silica sheets and it has a net negative charge because it has the broken bonds around the edges of the silica-alumina units 25-27. This mineral has illustrated the remarkable and successful results in adsorbing the dyes and metal ions 28, 29 and it has identified to be as a strong adsorbent to eliminate the pollutants from the solutions 29.
Conducting the present study was to assess the capability of CTAB-MB in removal of Methylene Blue dye under different values of the studied parameters including the contact time, dye concentration and CTAB-MB dosage on dye removal efficiency and Ultimately, to analyze the kinetic and isotherms of the process.
Experimental
Materials
MB dye (basic blue 9, C.I. 52015; C16H18ClN3S3H2O; MW, 373.90 g/mol) was used as the adsorbate and was purchased from Merck, Darmstadt, Germany. The obtained chemical formula was shown in the Fig. 1.
Preparation of Adsorbate (CTAB-MB)
For preparation of CTAB-MB, the amount of 25 g bentonite is poured in 250 mL of water with 5 g of CTAB and it is stirred at 25°C for 12 h. The resultant is then filtered and washed with distilled water for several times and the CTAB-MB is dried at 110°C for 6 h (25). After preparation of adsorbent, its characteristics was assessed by BET method (Brunauer-Emmet-Teller) using liquid N2 adsorption at 196° K and the scanning electron microscopy (JEOL, model 6400).
Batch Kinetics Experiments
The stock solution used in this study (1000 mg/L) was provided by dissolving the required amount of MB in distilled water and then it was diluted using the deionized water to prepare the solutions with desired concentrations. The volume of dye solution (sample) was 200 mL. To implement the experiments, the batch system using round bottom flasks were utilized. For this purpose, a certain amount and volume of CTAB-MB adsorbent and 100 mL of MB solution with different was poured into 200 mL round bottom flasks and, after capping and placing on a mechanical shaker, they were shaken at 120 rpm at 25°C for desired time. The resultant solutions were filtered using Millipore membrane filter of 0.45µm before analyses. The amount of adsorbed dye ions by CTAB-MB for each gram of adsorbent, adsorption capacity (qe) and removal efficiency (% removal) are identified by Eqs. (1) and (2) 30.
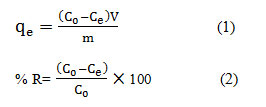
Where qe is the amount of adsorbed dye per mass unit of the adsorbent at equilibrium (mg/g), V is the volume of the solution and W is the weight of the adsorbent. In addition C0 is the initial concentration of the dye (mg/L) and Ce is the dye concentration at the equilibrium (mg/L). All of the tests performed twice and the best results were reported. The measurement of dye concentration of the samples, after conducting the experiments, was carried out by UV-Vis Spectrophotometer (DR 5000) at a λmax of 554 nm.
The adsorption isotherms for the MB removal were studied using various concentrations. For this purpose, the linear forms of Langmuir, Freundlich and Temkin adsorption isotherm models were utilized. The following equations represent these models 31, 32.
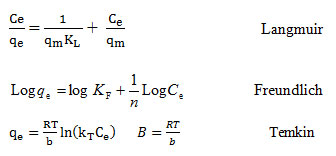
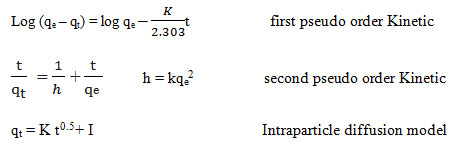
In this study, the kinetic studies of MB adsorption onto the CTAB-MB were done by the pseudo-first order kinetic model, pseudo-second order kinetic model and intra-particle diffusion model. The linear forms of these models are expressed as 33, 34.
 |
Figure 1: Chemical structure of Methylene Blue |
Results and Discussion
The results of characterization of the CTAB-MB illustrated that the specific surface area and pore volume of the adsorbent are 49.8 m2/g and 0.016 mL/g, respectively. Moreover, Figure 2 a and b are related to the SEM images of bentonite and CTAB-MB.
Figure 3 a and b are related to SEM images, applied for determination of surface morphology of bentonite and modified bentonite. These images display that there are few number particles in agglomerates of bentonite compared to modified bentonite. Moreover, the laminar crystalline habit characteristic of phyllosilicates was observed in several particles in both bentonite and modified bentonite show however, these types of particle are greater in CTAB-MB. The domination of relatively great laminar crystallites and agglomerates may also be due to the interaction of surfactant molecules in the interlayer 28.
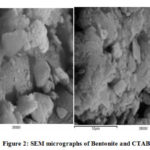 |
Figure 2: SEM micrographs of Bentonite and CTAB-MB |
Effect of Contact Time and Initial MB Concentration
Fig. 3 reveals the effect of contact time and MB initial concentration on the MB removal efficiency. As it is clear, the MB efficiency decreased by increasing MB concentration from 10 to 100 mg/L, but the adsorption capacity increased by increasing the initial MB concentration (Fig 4). Furthermore, considering the Fig.4, the MB removal efficiency was reduced by increasing the contact time from 10 to 150 min.
Based on our results, the MB adsorption process had two stages; so that, in the first stage, the adsorption was carried out rapidly at 30 min and then, in second stage, the MB adsorption process had a slow trend and was performed during time of 30-75 min. in this stage, in comparison with the first stage, the adsorption capacity was decreased. It was identified that, for the contact time higher than 75 min, it has no significant effect on adsorption capacity. It can be remarked that, according to dynamic equilibrium, in this time, the levels of adsorption and desorption are the same. To explain what is happened in the studied process, it can be said that the mass transfer of dye molecules into boundary layer is rapidly occurred 34, 35. But, the releasing of the dye molecules from the boundary layer into the absorbent surface is slowly carried out which is because of the occupation of the active adsorption and dispersing the dyes molecule into the adsorbent pores 36.
Effect of Adsorbent Dosage
Fig 5 depicts the effect of this parameter on MB adsorption efficiency. The adsorption efficiency was raised by increasing the CTAB-MB dosage up to 2.5 g/L and the equilibrium was obtained after this dosage. In spite of increasing the adsorption efficiency, the adsorption amount per g of adsorbent dose (qe) was decreased.
To explicate the effect of CTAB-MB dosage, determination of the MB removal efficiency was also carried out using different dosages of CTAB-MB (0.2 to 4 g/L) and it was found that increasing the adsorbent dosage has positive effect on MB removal efficiency and leads to its increase. Increasing adsorbent dosage may lead to promote the active sites, which it facilitates the MB adsorption efficiency. However, the adsorption capacity was decreased after certain point; this may be described by this fact that the overlapping or aggregation of adsorption sites may decrease the adsorption surface area 37, 38.
Adsorption isotherm and kinetics
Furthermore, based on the results, the adsorption capacity was developed by an increase in MB dye concentration. The increase of MB concentration is resulted in increase of the Mass transfer driving force and, as a result, the reaction between MB molecules and adsorbent is increased, which it is ultimately led to increasing the adsorption capacity 39, 40. Results of Balarak et al and Kumar et al confirm our results 16, 41.
Table 1 represents the parameters of studied isotherm models. The coefficient of determination value of MB adsorption obtained from the Langmuir, Freundlich and Temkin models were 0.996, 0.825 and 0.811, respectively.
Moreover, the parameters of kinetic studied were determined through the linear plot of log (qe-qt) versus t for the pseudo-first-order model (not shown), t/qt versus t for the pseudo-second-order (shown in Fig. 6), and t0.5 versus qt for intraparticle diffusion model (shown in Fig. 7); the values of the parameters were presented in Table 2.
Pseudo-first-order and pseudo-second-order models are considered as important models which, in present study, are employed to predict the mechanism of the adsorption of studied dye onto the CTAB-MB. Based on Table 2
, the obtained data were strongly explained by pseudo-second-order model (R2>0.99). Similar result was obtained by Yagub et al 21.
The Langmuir is an isotherm model which is used to characterize the homogeneous adsorption which has equal sorption activation energy for the adsorption of each adsorbate molecule on to the adsorbent surface. The separation factor (RL, also called equilibrium parameter) is considered as an essential feature of the Langmuir isotherm and is a dimensionless constant and is expressed by the below equation 19:
RL=1/(1+KLC0)
The RL values are indicative of the manner of the performing the adsorption based on following classification: for RL>1, the adsorption is unfavorable; for RL= 1, it is linear; for RL between 0 and 1, it is favorable; and for RL= 0, it is irreversible.
Generally, the heat of adsorption, in adsorption process, decreases by increasing the adsorption. This is properly considered by the Freundlich isotherm. In addition, considering the assumption of this model, the adsorption of the pollutants is performed onto the heterogeneous adsorbent 27. Also, according to assumptions of Temkin isotherm, the decreasing of adsorption heat of the surface molecules is not performed logarithmically and it carried out linearly; a uniform distribution of binding energies at the adsorbent surface specifies the adsorption process; and the adsorbate-adsorbent interaction is considered by this model40.
The (R2) related to the Langmuir isotherm was achieved to be 0.996, (Table 1) and it indicates that this isotherm model has a great aptness for explanation of the equilibrium data and the MB adsorption is a homogeneous. Moreover, the adsorption processes were favorable, since the separation factor (RL) was in the range of 0 and 1(Table 2).
Furthermore, the intra-particle diffusion model was applied to further analyzing the kinetic results. Considering the Fig. 8, three stages for MB adsorption are observed. The highest adsorption is observed in the initial step of the process because of the powerful electrostatic attraction between MB and CTAB-MB. After that, the adsorption is performed gradually due to the intraparticle diffusion of MB molecules by CTAB-MB cavities. In third stage, as the intraparticle diffusion decreases, the final equilibrium stage appears; the high concentration of dye studied is the reason of this event. In addition, since the plots were not linear during the studied time range, it can be concluded that the rate-limiting mechanism in the MB adsorption process is not only the intra-particle diffusion and other mechanisms may play role in this case 34, 37.
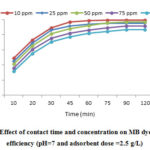 |
Figure 3: Effect of contact time and concentration on MB dye removal |
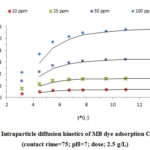 |
Figure 4: Effect of contact time and concentration on adsorption |
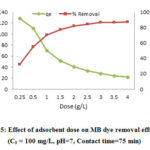 |
Figure 5: Effect of adsorbent dose on MB dye removal efficiency |
Table 1: Isotherms constants for the removal MB onto CTAB-MB
|
Langmuir model |
Freundlich model |
Temkin model |
|||||||
|
qm |
RL |
KL |
R2 |
n |
KF |
R2 |
A |
B |
R2 |
|
36.19 |
0.039 |
0. 725 |
0.996 |
2.95 |
11.94 |
0.825 |
0.272 |
17.95 |
0.811 |
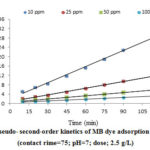 |
Figure 6: Pseudo- second-order kinetics of MB dye adsorption CTAB-MB |
|
Figure 7: Intraparticle diffusion kinetics of MB dye adsorption CTAB-MB |
Table 2: The results of kinetic model studies related to the MB adsorption onto CTAB-MB
|
MB Concentration (mg/L) |
(qe) exp |
Intraparticle diffusion |
Pseudo-first order |
Pseudo-second order |
||||||
|
k |
C |
R2 |
(qe) cal |
K |
R2 |
(qe) cal |
K |
R2 |
||
|
10 |
3.981 |
0.161 |
2.292 |
0.795 |
1.842 |
0.751 |
0.811 |
4.34 |
0.0097 |
0.996 |
|
25 |
9.815 |
0.422 |
5.312 |
0.801 |
4.562 |
0.644 |
0.825 |
10.86 |
0.0095 |
0.998 |
|
50 |
19.38 |
0.944 |
9.175 |
0.756 |
9.145 |
0.425 |
0.796 |
21.75 |
0.0037 |
0.997 |
|
100 |
34.72 |
1.861 |
14.44 |
0.784 |
18.14 |
0.276 |
0.846 |
38.95 |
0.0014 |
0.999 |
Conclusion
This work studied the potency of the surfactant-modified bentonite (CTAB-MB) in removal of MB under different conditions of various parameters, i.e., contact time, initial concentration and CTAB-MB dosage. According to the results, the MB dye removal follows the Langmuir model (R2=0.996). Likewise, the CTAB-MB is a successful and effective adsorbent for MB dye removal from aqueous solutions.
Acknowledgement
The authors are grateful from Student research committee of Zahedan University of Medical Sciences because of supporting of this research.
Conflicting of Interest
There is no conflicting interest in this study.
References
- E.I. Unuabonah, K.O. Adebowale and F.A. Dwodu, J. Hazard. Mater., 2008. 157, 397-409
- B. Zohra, K. Aicha, S. Fatima, B. Nourredin and D. Zoubir, Chem. Eng. J., 2008. 136,295-30
- V. Gómez, M.S. Larrechi and M.P. Callao, Chemosphere, 2007. 69, 1151-1158
- V.K. Gupta, R. Kumar,T.A. Saleh Nayak, and
- E. Bulut, M. Ozcar and I.A. Sengil, J Hazard Mater, 2008. 154, 613-622
- A.S. Ozcan and A. Ozcan,, J Colloid Interf Sci, 2004. 276, 39-46
- B. Acemioðlu, J Colloid Interf Sci, 2004.,274, 371-379.
- M.K. Purkait, A. Maiti, S. Das Gupta and S. De, J Hazard Mater, 2007., 145, 289-295.
- Y.L. Song, J.T. Li and H. Chen, J Chem Technol Biot, 2009. 84, 578-583
- C. Liu, H.H. Ngo and W. K. Guo, Bioresource Technol, 2012. 119, 349-354
- S.V. Yadla, V. Sridevi and M.V.V.C. Lakshmi., Journal of Chemical, Biological and Physical Sciences, 2012. 2, 1585-1593
- F. Gonen, and D.S. Serin., African Journal of Biotechnology, 2012.11, 1250-1258
- M.B. Ibrahim and S. Sani, Open Journal of Physical Chemistry, 2014.,4, 139-146
- M.A.M. Salleh, D.K. Mahmoud, W.A. Karim and A. Idris, Desalination, 2011. 280, 1-13
- N. Sharma, D.P. Tiwari and S.K. Singh, Internat ional Journal of Scientific & Engineering Research, 2012.3, 1-10
- Balarak, D.; Mahdavi, Y.; Bazrafshan, E.; Mahvi, A. H. Fresenius. Environ. Bull. 2016, 25(5), 1321-30.
- Ramachandran, P.; Vairamuthu, R.; Ponnusamy, S. Carbon. 2016. 6 (11): 15-26
- Ayawei, N.; Ekubo, A.T.; Wankasi, D.; Dikio,E.D. Oriental Journal of Chemistry.2015,31(3): 1307-1308.
- Vimonses, V.; Lei, S.; Jin, B.; Chow, C.W.K.and Saint, C. Chemical Engineering Journal, 2009.148(2-3): 354-364.
- Yusra, S and Bhatti, H.N. Desalination, 2011.272(1-3): 313-322
- Yaneva, Z.L. and Georgieva, N.V.InternationalReview of ChemicalEngineering, 2012. 4(2):127-146.
- Shin, E. W.; Rowell, R. M. Chemosphere. 2005, 60, 1054–1061.
- Balarak, D.; Azarpira, H. Int. J. ChemTech. Res. 2016, 9(9), 543-549.
- Balarak, D.; Joghataei, A.; Azarpira, H.; Mostafapour, F. K. Int. J. Pharm. Technol. 2016, 8(3), 15780-88
- Amarasinghe, W. P. K.; Williams, R. A. J. Chem. Eng. 2007, 32, 299–309.
- Yurtsever, M.; Sengil, I. A. J. Hazard. Mater. 2009, 163, 58–64.
- Soylak, M.; Elci, L.; Akkaya, Y.; Dogan, M. Anal. Lett. 2002, 35, 487–499.
- Balarak, D.; Azarpira, H. Int. J. ChemTech. Res. 2016, 9(7), 566-573.
- Eren, E.; Afsin, B.; Onal, Y. J. Hazard. Mater. 2009, 161, 677–85.
- Azarpira, H.; Mahdavi, Y. Pharma. Chem. 2016, 8(12), 61-67.
- Balarak, D.; Azarpira, H.;Mostafapour, F. K. Pharma. Chem. 2016, 8(10), 243-247.
- Zazouli, M. A.;Mahdavi, Y.;Bazrafshan, E. J. Environ. Health. Sci. Eng. 2014,12(66), 1-5.
- Diyanati, R. A.; Cherati, J. Y. J. Mazandaran Univ. Med. Sci. 2013,22(2), 58-64.
- Rozkhash, M.; Eslami, SV. J. Plant Prot. Res.2015, 284,579-588.
- Balarak, D.; Jaafari, J.;Hassani, G.;Mahdavi, Y.;Tyagi, I.; Agarwal, S.; Gupta, V. K. Colloid Interface Sci. Commun.2015,7, 16–19.
- Diyanati, R. A.; Yousefi, Z.; Cherati, J. Y. J. Mazandaran Univ. Med. Sci.2013, 22(2), 13-21.
- Diyanati, R. A.; Yousefi, Z.; Cherati, J. Y.; Balarak, D. J. Mazandaran Univ. Med. Sci. 2013, 23, 17-23.
- Azarpira, H.; Mahdavi, Y.; Khaleghi, O. Pharm. Lett.2016, 8(11), 107-113.
- Fuhrman, H. G.; Mikkelsen, P. S.; Ledin, A. Water. Res. 2007, 41, 591–602.
- Balarak, D, Mostafapour, F. K.; Joghataei, A. Pharma. Chem. 2016, 8(8), 138-145.
- Costodes, V. C. T.; Fauduet, H.; Porte, C.; Delacroix, A. J. Hazard. Mater. 2003, 103, 121–142.
- Ashrafi, S. D.; Rezaei, S.; Forootanfar, H.; Mahvi, A. H.; Faramarzi, M. A. IntBiodeter.Biodegr. 2013, 85,173-181.
- Pandey, K.; Sharma, S. K.; Sambi, S. S. Int. J. Environ. Sci. Tech., 2010, 7(2), 395-404.
- Christoforidis, A. K.; Mitropoulos, A.C. Chem. Eng. J. 2015, 277, 334 – 340.
- Mata, Y. N.; Munoz, J. A. Hazard. Mater. 2009, 166, 612 – 618.
- Luo, D.; Xie, Y. F.; Tan, Z. L.; Li, X. D. Environ. Biol. 2012, 34, 359 – 365.
- Balarak, D.; Azarpira, H.; Mostafapour, F. K. Chem. 2016; 8(10):114-121.
- Li, Y. H.; Di, Z. C.; Wu, D. H.; Luan, Z. K.; Zhu, Y. Q. Res. 2005, 39, 605–609.
- Unlu, N.; Ersoz, M. Hazard. Mater. 2006, 136, 272–280.
- Martins, B. L.; C. V.; Luna, A. S.; Henriques, A. C. Eng. J. 2006, 27, 310-314.
- Balarak, D.; Mahdavi, Y.; Bazrafshan, E.; Mahvi, A. H. Environ. Bull. 2016, 25(5), 1321-30.
- Meng, Y. T.; Zheng, Y. M.; Zhang, L. M.; He, J. Z. Pollut. 2009, 157, 2577–2583.
- Pacheco, S.; Tapia, J.; Medina, M. R.; Rodriguez, R. Non-Cryst. Solids. 2006, 352, 5475–5481.

This work is licensed under a Creative Commons Attribution 4.0 International License.
About The Author
![]()
A New Edition of Web of Science
Journal Impact Factor
2022: 0.5
Five Year: 0.8
Journal is Indexed in

Cabells Whitelist
![]()


