Heavy Metals Contamination of an Aquatic Environment and Health Risks Assessment in Two Fish Species: Case of the Guessabo Lake, Western Côte d'Ivoire
Kouamé Kouakou Benoit1*, Konan Kouakou Séraphin1, Konan Koffi Félix2, Boussou Koffi Charles2 and Kouassi Kouakou Lazare1
1 Laboratory of Environmental Science and Technology, University Jean Lorougnon Guédé, Daloa, Côte d’Ivoire
2 Laboratory of Ecology, Biodiversity and Evolution, University Jean Lorougnon Guédé, Daloa, Côte d’Ivoire
Corresponding Author Email: benoitk322@gmail.com
DOI : http://dx.doi.org/10.13005/ojc/350617
Article Received on : 24-07-2019
Article Accepted on : 06-12-2019
Article Published : 26 Dec 2019
The purpose of this study was to evaluate the contamination by heavy metals and the health risks of the residents of a watershed of the Sassandra river. Water and fish samples were taken from Guessabo Lake during the dry season and the rainy season. The average Hg, Pb, Cd and Zn concentrations in the water samples decreased during the rainy season by 20.51%, 80%, 18, 26% and 61.4%, respectively. In contrast, the average concentrations of As, Cu, Mn and Fe increased by 10%, 84.3%, 48.98% and 11.45%, respectively. The concentrations of heavy metals in water samples follow the trend: Fe> Cu> Mn> Pb> As> Zn> Hg> Cd. All metals except Fe were within permitted limits for drinking water quality at all stations during both seasons. The increase of As, Mn and Fe in water samples during rainy season was inversely proportional to their covalent index. The average heavy metal pollution index (HPI) for each sampling station showed higher pollution at the G2 station. The average Heavy metal evaluation index (HEI) of dry season (28) decreased relatively after the rainy season (21). Pearson's analysis showed that cadmium correlates strongly with HPI (r = 0.896) and HEI (r = 0.95) and iron is also highly correlated with HPI (r = 0.961) and HEI (r = 0.999). The concentration of trace metals obtained in the muscles of Chrysichthys nigrodigitatus (demersal) and Tilapia spp (benthopelagic) showed that Tilapia spp concentrated more non-essential metals (Hg, Cd and As) than Chrysichthys nigrodigitatus. Human health risks of trace metals in fish muscle and water were low, but among the selected metals, As and Hg are the non-essential elements contributing more to the cumulative hazard quotient of HI (0.845) for children and (0.39) for adults.
KEYWORDS:Guessabo Lake; Water Quality; Fish; Heavy Metal Pollution Index; Heavy Metal Evaluation Index; Health Risks
Download this article as:| Copy the following to cite this article: Benoit K. K, Séraphin K. K, Félix K. K, Charles B. K, Lazare K. K, Heavy Metals Contamination of an Aquatic Environment and Health Risks Assessment in Two Fish Species: Case of the Guessabo Lake, Western Côte d'Ivoire. Orient J Chem 2019; 35(6). |
| Copy the following to cite this URL: Benoit K. K, Séraphin K. K, Félix K. K, Charles B. K, Lazare K. K, Heavy Metals Contamination of an Aquatic Environment and Health Risks Assessment in Two Fish Species: Case of the Guessabo Lake, Western Côte d'Ivoire. Orient J Chem 2019; 35(6). Available from: https://bit.ly/378aNiE |
Introduction
The aquatic environment and water quality are considered to be the determining factor in the health and life of all organisms.1 With the current mode of free disposal of agricultural products, industrial, the flow of agricultural land and fishing techniques in Côte d’Ivoire, water bodies are increasingly vulnerable to pollution. Although industrial activities are relatively less important in the study area, environmental pollution, mainly from water sources, is significant because of the multiple sources of heavy metals. Sources of environmental pollution, including aquatic, come from mining effluents, domestic effluents and urban storm runoff. The leaching of heavy metals from rural areas such as those contained in pesticides are also potential sources in the area.2 Ubiquitous and persistent heavy metals accumulate surreptitiously in nature and may be toxic to biota at low concentrations.3,4 The consumption of impacted ecosystem products is a major source of contamination5. Heavy metals are non-biodegradable. Therefore, they cannot be eliminated by the self-cleaning process.
Fish is an important source of protein, vitamins, essential minerals and unsaturated fatty acids for humans. It is also an important source of income.6 According to Fair et al.,7 human health is closely linked to dietary habits and dietary ingredients. The American Heart Society recommends consuming fish twice a week because it helps reduce the risk of heart disease.8 However, a healthy diet should not only contain sufficient amounts of trace elements, vitamins, minerals, but should also be deprived of pollutants. Also, Liu et al.,9 states that vitamin C, iron and other nutrients stored in the body decrease with the consumption of food contaminated with Pb, Cd, As, Hg and other toxic elements. This leads to a decrease in immunity and a deterioration of human functions. The adverse health effects associated with bioaccumulation and biomagnification of heavy metals in the food chain are neurological, cardiovascular and renal disorders 10,11,12. The fact that fish are also an important component of the diet raises serious concerns about health risks. Numerous studies have shown that humans could be significantly affected by the consumption of fish contaminated with heavy metals.13,14 Pollution of fish by heavy metals has become a global concern, not only because of threats to fish, but also because of the public health risks associated with fish consumption.15,16
The analysis of dissolved metals in water is useful for assessing the state of pollution and revealing the degree of contamination17. Guessabo Lake, one of the major lakes in western Côte d’Ivoire that supplies freshwater fish from Upper Sassandra and surrounding areas, is subject to anthropogenic impacts in urban and agricultural areas. Small villages and settlements bordering the watercourse use this water resource without any prior treatment as drinking water. The interest aroused by this study stems not only from the importance of the natural resource but also from its vulnerability related to activities on its watershed. Therefore, this study should enable us to fill the gap of scientific data on this subject and can serve as a tool to help decision-making for development. To overcome the lack of literature in this area, this study describes an approach to determine the degree of risk of pollution. Due to the existence of more than one heavy metal absorption pathway, consideration should be given to the different routes of exposure in the health risk assessment process for residents living near these waters sweet. However, ingestion and dermal absorption are common routes of exposure to water 18. In this work, it will be mainly: (1) to explain the seasonal evolution of the concentrations of Hg, Cd, Pb, Zn, Cu, Fe, As and Mn in surface water and to compare them with the norms drinking water quality, (2) determine the heavy metal content in the muscles of the fish, (3) assess the potential risks to human health.
Materials and Methods
Study Area
Guessabo Lake is located between latitudes 6 ° 57 ‘and 7 ° 2’ N and longitudes 6 ° 45 ‘and 6 ° 46’W. It is the upstream of the Buyo Dam built on the Sassandra River. It covers an area of 27Km2. Its depth oscillates between 0.5m and 20m. The 600-kilometer Sassandra Basin has its source in the Bayla region in Guinea. It receives three major tributaries that are Bafing, N’zo and Lobo. Its catchment area covers an area of 75, 000 km2 19. It is therefore a permanent watercourse. The particularity of the study area is its mountain landscape. There is a fairly rugged land with an average altitude of 300 m20. However, the mountainous area does not cover the entire study area. There are vast and high plateaus, plains and hollows very extensive. The region enjoys a humid tropical climate with a dry season lasting 4 months, from November to February and a rainy season from March to October. The soils are of ferritic type with medium fertility and constitute a broad area for the development of agriculture. There are also soils developed on basic rocks potentially rich in mineral, salts and hydromorphic soils located in the shallows21. It is a forest area largely dedicated to high value-added crops such as cocoa, rubber and coffee. This type of environment, however, is rather “holed” because of human activities and comes in three forms: semi-deciduous forest, dense evergreen forest and mountain forest which is a particularly humid environment. These forests are subject to human aggression in the dry season for extensive agricultural slash and burn practices.
Sampling, pre-treatment and analysis
Sampling
The map of the study area and sampling points is shown in Figure 1. We collected 28 surface water samples seasonally from December 2017 to October 2018. We took care to take the samples at the same place during the four campaigns. The reagent used for sampling and filtration is HNO3 pure quality 48%. The goal is to stabilize the solutions at pH = 2 to minimize precipitation and adsorption on the bottle walls, as required by the standard procedure. The sample bottle is rinsed with a little sample before filling. All samples taken are stored in a cooler and within 24 hours in a refrigerator at 4 ° C. The filtration apparatus is cleaned regularly with HCl 1N and rinsed with water to avoid memory effects on the collected water. The water samples were placed in clean polyethylene bottles. The fish, Tilapia spp and Chrysichthys nigrodigitatus, were chosen because of their socio-economic importance in catches and because of their diet. For this study, 17 Chrysichthys nigrodigitatus and 11 Tilapia spp were dissected. The fish samples were washed several times with deionized water, cut into small pieces in the laboratory. It should be mentioned here that the fish were removed from their skin and the muscles located between the back and the tail were removed for analysis.
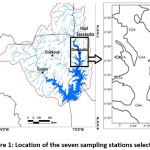 |
Figure 1: Location of the seven sampling stations selected. Click here to View Figure |
Fish Samples Pretreatment
The metals taken into account in this work are two types: non-essential toxic metals (mercury (Hg), lead (Pb), cadmium (Cd)) and essential metals such as iron (Fe) and copper (Cu). After thawing at room temperature, the muscle samples were macerated into small pieces and mixed to obtain a homogeneous mixture. After mixing, approximately 5 g of each sample was quantitatively transferred to a Kjeldahl flask. The digestion of the sample was followed by the addition of 20 ml of concentrated nitric acid (HNO3, pure 48%), followed by heating at a temperature between 210 and 350 ° C for about 10 to 20 minutes. Then 10 ml concentrated sulfuric acid (H2SO4, analytical grade) was added to the sample. Boiling continued until the samples were digested. For portion separation, 5 ml of concentrated nitric acid was added gradually. The clear sample is cooled to room temperature and washed with distilled water. The samples were filtered using Whatman® filter (15 mm) in 50 ml volumetric flask and distilled water was used to adjust the volume. The same procedures were applied to blank samples without tissue. Control samples were prepared from fish tissue homogenate for recovery purposes.
Samples Analysis
Heavy metal concentrations were determined using atomic absorption spectrometry (Perkin-Elmer, 3300/96, MHS-10) with a specific lamp for each particular metal. The heavy metal concentrations Pb, Cd, Fe, Zn, Mn and Cu were analysed by flame atomic absorption spectrometry. Arsenic and mercury were determined by atomic absorption spectrometry with hydride / cold vapor generation. Lead was determined by atomic absorption spectrometry in a graphite furnace. The following wavelengths were used: Pb (283.3 nm), Cd (228.8 nm), Fe (248.3 nm), Zn (213.9 nm), Mn (279.5 nm), Cu (324.8 nm), As (193.7 nm) and Hg (253.7 nm). The detection limits for trace elements and metalloids Mn, Fe, Cu, Zn, As, Cd, Pb and Hg are respectively 0.0002, 0.001, 0.0006, 0.002, 0.005, 0.0003 and 0.0001 mg kg-1. The quality of the analytical data has been ensured through the implementation of quality assurance and laboratory quality control methods, including the use of standard operating procedures, calibration with standards, blank analysis reagents, recovery of known additions and replica analysis. All analyses were performed in triplicate and the results were expressed as an average. In order to minimize the variability among the sample results, we used the same analytical laboratory and this laboratory applied the same method of analysis for each chemical element searched during the study period.
Pollution Index
The interpretation of water quality datasets for pollution assessment is quite difficult because of the simple elemental concentrations 22. On the other hand, quality indices have a great deal of flexibility in analysing data sets for better interpretation of pollution23. In order to evaluate the quality of water by its heavy metal content in Guessabo Lake, two indices were used. The heavy metals pollution index (HPI) and heavy metals evaluation index (HEI) proposed by24 are the ones used. The HPI and HEI methods are introduced to evaluate the overall quality of water by adding to heavy metals. The HPI index takes into account the relative toxicity of each metal by assigning a weighting factor or a rating (Wi) to each chosen parameter. The scoring system is an arbitrary value between 0 and 1 and its choice depends on the importance of individual quality considerations. It can be defined as inversely proportional to the allowed standard value25. In the calculation of HPI in this study, the concentration limits, that is, the allowed standard value (Si) and the highest desirable value (Ii) for each parameter, were extracted from the WHO standards. The Heavy Metals Evaluation Index (HEI) is used to synchronize the criteria for different pollution indices26. The HEI criteria for surface water samples are thus classified as low (HEI<40), medium (HEI = 40–80), and high (HEI>80). Different authors define for HPI a critical limit value 100 for water intended for consumption beyond which water is considered to be of poor quality. Thus, these different indices can be expressed by the following equations.
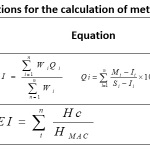 |
Table 1: Equations for the calculation of metal quality indices Click here to View Table |
where Qi: sub-index of the nth parameter, Wi: unit weighting of the parameter i, n: number of parameters considered. Mi: measured heavy metal content of the parameter i, Ii: ideal values of the parameter i, and Si: standard value of the parameter i, the sign (-) indicates the numerical differences between the two values, ignoring the algebraic sign. Hc: measured heavy metal content of parameter i, Hmac: maximum permissible concentration of parameter i.
Table 2: HPI calculation parameters for lake water based on medium heavy metal concentration.
|
Parameters |
Wi | S | I | MAC |
| Cu | 0,001 | 1000 | 2000 |
1000 |
|
Fe |
0,005 | 300 | 200 | 200 |
| Mn | 0,02 | 100 | 500 |
50 |
|
Zn |
0,0002 | 5000 | 3000 | 5000 |
| Cd | 0,3 | 5 | 3 |
3 |
|
Pb |
0,7 | 100 | 10 | 1,5 |
| As | 0,02 | 50 | 10 |
50 |
|
Hg |
1 | 1 | 6 |
1 |
Risk Assessment Methods
Liang et al.5 define health risk as the probability of adverse human health effects from environmental pollution. The health risk assessment model developed by the US Environmental Protection Agency28 to assess the risk to human health of heavy metals is the one adopted in this work.
Calculations of Daily Intake
Strictly speaking, the consumption of pollutants in humans refers to the effective dose of pollutants that can enter in blood and have effects on human tissues and organs. However, because of some scientific constraints and taking into account conservative principles, the calculation of absorption is expressed as the amount of pollutants absorbed by the body per body weight per unit of time based on the potential dose in general as ‘have made several authors 29, 30. The intake of heavy metals is simply the exposure dose by ingestion of water (Exping, μg / L / day), fish (Expingp, μg / g / day) and the dermal exposure intake by absorption (μg / L / day) of harmful substances during the exposure period. The methods used to calculate the exposure intake vary according to the exposure pathways (Table 3). The definition and value of the exposure parameters are listed in Table 4.
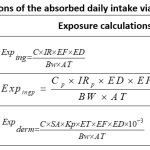 |
Table 3: Equations of the absorbed daily intake via the different exposures. Click here to View Table |
Table 4: Calculation parameter of the daily exposure dose of heavy metals.
|
Exhibition route |
Basic Settings | Physical meanings | Values | References |
| Basic parameters | C (µl/L) | Concentrations of heavy metals and metalloids | Average values |
This study |
|
Cp (µg/g) |
Concentrations of fish metals | Average values | This study | |
| Exposure settings | EF (days/year) | Frequency of exposure | 180 |
This study |
|
ED (year) |
Duration of exposure | 6 (child)30 (adult) | 32 | |
| Bw (Kg) | Average body mass | 28 Kg (child)70Kg (adult) |
33 |
|
|
AT (days) |
Average exposure Time | 2190 (child)10950 (adult) | 32 | |
| Hand-Mouthfeeding | IR (L) | Amount of water ingested | 1,5 (child)2L(adult) |
33 |
|
IRp |
Ingested fish rate | 38,5g/day/person28,9g/day/person | 34 | |
| Skin exposure | Kp (cm/hr) | Dermal permeability coefficient of compound in water | (Cd, Cu Fe As and Hg (0,001)), Pb (0,0001), Zn (0,0006) |
32 |
|
SA (cm2)
|
Exposed skin surface | 6600 (Child)18000 (adult) | 32 | |
| ET | ET: Exposure Time | 0,5h/day |
This study |
Health Risk Assessment
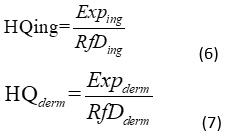
Populations that are regularly exposed include local residents, especially fishermen and their families who consume fish and drink water from the lake at least once a day. However, fish can reach the table of any Ivorian, as no source is indicated for fish sold on the market. This study focuses on the oral and dermal routes and concerns chronic exposures only. The non-carcinogenic risk is assessed by comparing a level of exposure over a specified period (eg, whole life) to a reference dose calculated for a similar exposure period. The non-carcinogenic risk may be characterized by a hazard quotient (HQ). The health risks caused by different contaminants entering the body through different routes of exposure are divided into carcinogenic and non-carcinogenic risks. Carcinogenic risk refers to the additional likelihood that an individual will develop cancer during his lifetime as a result of exposure to carcinogens. The hazard quotient is the ratio of chronic daily intake (Exp) to chronic reference dose (RFD). If HQ <1, the occurrence of a toxic effect is very unlikely and if HQ> 1, the occurrence of a toxic effect cannot be ruled out. The calculation equations of the different exposure hazards.
Results
Heavy Metals in Waters
The results of the descriptive analyses of heavy metals in the study period are given in Table 6. The seasonal and spatial evolution of the metallic elements is shown in Figure 2.
The Hg concentration is between 0 μg / L and 1.04 μg / L, with an estimated average of 0.347 ± 0.05 μg / L. That of Pb ranges from 0.02 μg / L to 5.44 μg / L, with an average value of 1.48 ± 0.85 μg / L. As for Cd, the values fluctuate between 0 μg / L and 0.35 μg / L, with an estimated average of 0.09 ± 0.02 μg / L. As concentrations range from 0.09 to 2.06, with an average value of 0.74 ± 0.11 μg / L. The Zn concentration is between 0.23 μg / L and 4.28 μg / L, with an estimated average of 1.37 ± 0.75 μg / L. As for Cu, its content varies between 0.02 and 5.46, with an average value of 1.89 ± 1.61 μg / L. The average concentration of Mn is 1.86 ± 1.06 μg / L. The minimum and maximum values are 0.65 and 5.45 μg / L, respectively. Regarding Fe, its content is between 2.27 mg / L and 13.54 mg / L, with an estimated average of 4.76 ± 1.11 mg / L.
The results of spatio-temporal variations in total Hg, Pb and Zn concentrations show that the highest concentrations are recorded during the dry season in the lake (Figure 2). With regard to cadmium, no clear trend is observed in the evolution of this parameter. The highest concentrations of Fe, As, Cu and Mn are generally obtained during the rainy season. In contrast, the lowest concentrations are measured in the dry season. Station 5 has the higher Pb content of the study period. The stations (1, 2 and 3) located on the right flank of the bridge recorded overall higher values of Hg, Pb and As. The total trace element content of the lake generally decreases along a gradient in concentration of upstream to downstream (station G1 to G6). All heavy metals recorded high concentrations at the G2 stations during both seasons. Mean concentrations of Hg, Pb, Cd and Zn decreased during the rainy season by 20.51%, 80%, 18.26% and 61.4% respectively. In contrast, mean concentrations of As, Cu, Mn and Fe increased by 10%, 84.3%, 48.98% and 11.45%, respectively. The abundance of these metallic trace elements in the waters of the study area follows the following decreasing order: Fe> Cu> Mn> Pb> As> Zn> Hg> Cd.
In this study, correlation between different metals and pollution indices were calculated. Statistical analysis shows both positive and negative correlation between different metals (Table 7). The results of the analyses show that Zinc is positively correlated with lead (r = 0.647) and arsenic (r = 0.914). On the other hand, Mn is negatively with lead (r = -0.673), arsenic (r = -0.777) and Zn (r = -0.833). Iron is strongly correlated with cadmium (r = 0.949).
Estimation of the intensity of water contamination by HMs.
Table 6 presents the calculated HPI and HEI values for both seasons. The average value of HPI in Guessabo Lake during the dry season (94.87) and the rainy season (80.36) is lower than the critical limit 100. HPI values decreased significantly from the dry season to the rainy season at stations 2, 5 and 4. The HPI of the G2 (110) and G5 (104) stations are above the critical limit during the dry season. 100% of the sampling sites recorded HPI values below the critical value during the rainy season compared to 72% in the dry season.
The average HEI values for the dry season and the rainy season are 28.18 and 21.54, respectively. The Pearson correlation matrix shows that cadmium is strongly correlated with HPI (r = 0.896) and HEI (r = 0.95) and iron is also strongly correlated with HPI (r = 0.961) and HEI (r = 0.999). HPI and HEI methods show more or less similar trends for most of the samples (Table 6).
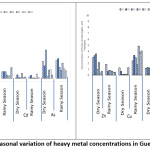 |
Figure 2: Seasonal variation of heavy metal concentrations in Guessabo Lake. Click here to View Figure |
Table 5: Average Concentration of Heavy Metals in Guessabo Lake and reference doses of non-carcinogens.
|
Parameter |
Hg (µg/L) | Pb (µg/L) | Cd (µg/L) | As (µg/L) | Cu (µg/L) | Mn (µg/L) | Zn (µg/L) | Fe (mg/L) |
| Mean± S.D | 0,347±0,05 | 1,48±0,85 | 0,09±0,02 | 0,74±0,11 | 1,89±1,61 | 1,86±1,06 | 1,37±0,75 |
4,76±1,11 |
|
Range |
0-1,04 | 0,02-5,44 | 0-0,35 | 0,09-2,06 | 0,02-5,46 | 0,65-5,45 | 0,23-4,28 | 2,27-13,54 |
| 36 | 1 | 10 | 3 | 10 | 2000 | 500 | 3000 |
0,2 |
|
RfDing (Water) |
0,1 | 1,4 | 0,5 | 0,3 | 40 | – | 300 | 700 |
| RfDderm | 0,007 | 0,42 | 0,025 | 0,123 | 8 | – | 60 |
140 |
Table 6: Guessabo Lake Heavy Metal Pollution Index (HPI) and Heavy Metal Evaluation Index (HEI) at each station in the dry and rainy seasons
|
STATIONS |
HPI | HEI | ||
| Dry Season | Rainy Season | Dry Season |
Rainy Season |
|
|
G1 |
92,37 | 89,50 | 14,33 | 18,92 |
| G2 | 110,11 | 90,37 | 64,76 |
20,56 |
|
G3 |
88,378 | 89,24 | 16,17 | 15,70 |
| G4 | 88,72 | 11,86 | 14,87 |
23,41 |
|
G5 |
104,13 | 96,70 | 48,40 | 25,76 |
| G6 | 90,53 | 94,48 | 19,96 |
24,66 |
|
G7 |
89,85 | 89,51 | 18,79 | 21,79 |
| Mean | 94,87±8,64 | 80,36±30,33 | 28,18±20,06 |
21,54±3,49 |
|
Water Mean |
87,61±19,48 |
24,76±11,77 |
||
Table 7: Pearson’s correlations matrix between trace elements and pollution indices.
|
|
Hg | Pb | Cd | As | Zn | Cu | Mn | Fe | HPI | HEI |
| Hg | 1 | |||||||||
|
Pb |
-0,136 | 1 | ||||||||
| Cd | 0,063 | 0,251 | 1 | |||||||
|
As |
-0,046 | 0,525 | 0,266 | 1 | ||||||
| Zn | -0,155 | 0,647 | 0,140 | 0,914 | 1 | |||||
|
Cu |
0,15 | 0,017 | 0,459 | -0,080 | -0,168 | 1 | ||||
| Mn | 0,16 | –0,673 | 0,194 | -0,777 | -0,833 | 0,515 | 1 | |||
|
Fe |
0,03 | 0,240 | 0,949 | 0,091 | 0,078 | 0,399 | 0,280 | 1 | ||
| HPI | -0,23 | 0,220 | 0,896 | 0,061 | 0,079 | 0,343 | 0,272 | 0,961 | 1 | |
|
HEI |
0,045 | 0,278 | 0,950 | 0,112 | 0,102 | 0,397 | 0,250 | 0,999 | 0,956 | 1 |
| Hg | Pb | Cd | As | Zn | Cu | Mn | Fe | HPI |
HEI |
Concentrations of heavy metals in fish muscles
The concentrations (average and range) of the non-essential metals (Pb, Cd and Hg) and essential metals (Fe and Cu) in the fish muscles analysed are presented in Table (9). The average concentration of Hg in Chrysichthys nigrodigitatus (demersal) muscle (0.056 μg /g w.w) is relatively high compared to the average Hg concentration of Tilapia spp (benthopelagic) (0.038 μg / g.w.w). Mean Cd content in Tilapia spp muscle (0.01 μg/g w.w) was significantly higher than Chrysichthys nigrodigitatus content (0.004 μg/g w.w). However, no significant difference is observed between the Pb levels in the two species. The level of Cd found in Tilapia spp is 2.5 times higher than that found in Chrysichthys nigrodigitatus fish and the Pb level is 1.7 times higher than that of Chrysichthys nigrodigitatus.
Table 8: Concentration of heavy metals in fish muscle analysed in Guessabo Lake and norm according to,34 CE and EQs
|
Fish |
Heavy Metals (µg/g w.w) | |||||
| Hg | Cd | Pb | Cu |
Fe |
||
|
Chrysichthys nigrodigitatus |
Mean±SD | 0,056± 0,06 | 0,004±0,002 | 0,071±0,073 | 3,35±1,56 | 27,61±22,51 |
| Min-Max | 0,01-0,24 | 0,001-0,012 | 0,013-0,325 | 1,23-6,54 |
3,00-65,08 |
|
|
Tilapia spp |
Mean±SD | 0,038±0,04 | 0,01±0,01 | 0,12±0,08 | 4,16±1,61 | 13,72±20,18 |
| Min-Max | 0,02- 0,18 | 0,001-0,04 | 0,03-0,25 | 2,18-6,63 |
2,80-69,80 |
|
|
34 |
0,5 | 0,1 | 0,3 | 30 | 43 | |
| EC* | 0,05 | 0,2-0,3 | ||||
|
EQS** |
0,02 | |||||
| RfD (µg/g /days) 35 | 0,0003 | 0,001 | 0,004 | 0,04 |
0,7 |
|
*Commission of the European Communities, **Environmental Quality standard.
Daily intake and Hazard Quotient
Daily intake of ingestion (Exping) and dermal exposure (Expderm) are calculated to evaluate the overall non-carcinogenic risk posed by certain metals when ingestion of water, fish and skin contact (Table 10). The non-carcinogenic (HQ) risk results for various heavy metals for the two exposure pathways are presented in Table (11). The results show that children are more exposed than adults at all levels. Of the two exposure routes, diet was the determining factor in the risk quotient. The risk quotient of ingestion of raw water is greater than the ingestion of fish. The metal HQ values of the estimated average HQing and HQderm concentrations in the water samples are in the order of Fe> Hg> As> Pb> Cd> Cu> Zn and Fe> As> Pb> Cu> Zn, respectively. The results indicated that Fe, Hg, As and Pb are the main contributors to ingestion and Fe, As and Pb are the main contributors to skin penetration. The metal HQ values of the estimated average concentrations of HQing Chrysichthys nigrodigitatus and HQing Tilapias spp are about Hg> Cu> Fe> Pb> Cd and Hg> Cu> Pb> Fe> Cd, respectively. The results indicated that Hg and Cu are the main contributors to fish ingestion. The total value of the non-carcinogenic risk index (HQ) is for children (0.845) and adults (0.39).
Table 9: Daily ingestion dose (water and fish) and daily dermal exposure
|
Heavy Metals |
Exposure by ingestion of water (μg / L / day) | Dermal Exposure | Exposure by ingestion of fish Chrysichthys nigrodigitatus | Exposure by ingestion Tilapia | Total exposure by metals | |||||
| Child | Adult | Child | Adult | Child | Adult | Child | Adult | Child |
Adult |
|
|
Hg |
9.18.10-3 | 4.87.10-3 | 2.02.10-5 | 2.20.10-5 | 2.8.10-5 | 1.52.10-5 | 1.9.10-5 | 1.03.10-5 | 9.23.10-3 | 4.89.10-3 |
| Cd | 2.39.10-3 | 1.27.10-3 | 5.26.10-6 | 5.76.10-6 | 2.0.10-6 | 1.08.10-6 | 1.85.10-5 | 10-5 | 2.63.10-3 |
1.33.10-3 |
|
As |
1.58.10-2 | 9.31.10-3 | 3.86.10-5 | 4.22.10-5 | – | – | – | – | 1.75.10-2 | 9.71.10-3 |
| Pb | 3.91.10-2 | 2.07.10-2 | 8.61.10-6 | 9.40.10-6 | 3.55.10-5 | 1.91.10-5 | 6.10-5 | 3.2.10-5 | 4.29.10-2 |
2.16.10-2 |
|
Cu |
5.00.10-2 | 2.65.10-2 | 1.10.10-4 | 1.20.10-4 | 1.67.10-3 | 9.08.10-4 | 2.08.10-3 | 1.13.10-3 | 537.10-2 | 2.97.10-2 |
| Fe | 125.74 | 66.88 | 0.27 | 0.30 | 1.38.10-2 | 7.48.10-3 | 6.86.10-3 | 3.72.10-3 | 125,76 |
67.18 |
|
Zn |
3.60.10-2 | 1.91.10-2 | 4.76.10-5 | 5.19.10-5 | – | – | – | – | 3.94.10-2 |
1.99.10-2 |
Table 10: Summary of Risk Quotients in different matrices (water and fish) for adult and child
|
Heavy Metals
|
Quotient of Water Ingestion Hazards (HQ) | Dermal Hazard Quotient | Risk Quotient of Chrysichthys nigrodigitatus Ingestion | Risk Quotient of Tilapia Ingestion | ||||
| Child | Adult | Child | Adult | Child | Adult | Child |
Adult |
|
|
Hg |
9.1810-2 | 4.87.10-2 | 2.88.10-3 | 3,14.10-3 | 9.10-2 | 5.07.10-2 | 6.3.10-2 | 3.43.10-2 |
| Cd | 4.78.10-3 | 2.54.10-3 | 2.10.10-4 | 2,30.10-4 | 2.10-3 | 1.08.10-3 | 1.85.10-3 |
10-2 |
|
As |
5.26.10-2 | 3.10.10-2 | 3.14.10-4 | 3.43.10-4 | – | – | – | – |
| Pb | 2.79.10-2 | 1.47.10-2 | 2 .05.10-5 | 2.2.10-5 | 8.87.10-3 | 4.77.10-3 | 1.5.10-2 |
8.10-3 |
|
Cu |
1.25.10-3 | 6.62.10-4 | 1.37.10-5 | 1.5.10-5 | 4.2.10-2 | 2.27.10-2 | 5.2.10-2 | 2,8.10-2 |
| Fe | 0.18 | 9.55.10-2 | 1.93.10-3 | 2.14.10-3 | 1.97.10-2 | 1.07.10-2 | 9.8.10-3 |
5.3.10-3 |
|
Zn |
1.20.10-4 | 6.36.10-5 | 7.93.10-7 | 8.65.10-7 | – | – | – | – |
| Total | 0.360 | 0.190 | 5.36.10-3 | 5.89.10-3 | 0,163 | 0,089 | 0,162 |
0,085 |
Discussion
Water pollution by heavy metals
Seasonal variation of heavy metals in water is potentially influenced by physicochemical properties such as dissolved oxygen, salinity, temperature, and pH. The positive correlation found between Zn-Pb -As, indicates a possible common source of these three elements in this study. The high content of trace elements such as Hg, Pb, Cd and Zn during the dry season would be due to increased evaporation and lower rainfall 37. Also, the concentrations of Zn and Cd are relatively high in the dry season could be explained by the acidity (pH = 6.3) of the medium and the redox potential (Eh = 37 mV) highly oxidizing in water and sediments that favour the solution of these elements 38. This decrease during the rainy season is due to the dilution effect, whereas the increase in As, Cu, Mn and Fe concentrations could be attributed to the desorption of these metals in the sediments due to dilution. During the rainy season, heavy metals penetrate the lakes through leaching as inorganic complexes or hydrated ions, which are readily adsorbed on the surface of the sediment particles and constitute the labile fraction39. This desorption concerned both the elements Hg, Pb, Cd and Zn but the dilution prevailed over this phenomenon. The increase in the average concentration of As, Cu, Mn and Fe in the rainy season followed the following order: Cu> Mn> Fe> As was inversely proportional to their covalence index As > Fe> Mn. According to Pal et al.4, the increase in heavy metal adsorption is closely related to their covalent index. However, Cu which is in two different classes defined by 40did not follow this order. Also, the strong increase in Cu and Mn during the rainy season is due to their use in the composition of pesticides carried in neighbouring fields. Moreover, in the sedimentary cycle, Cu is associated with clay minerals, and especially associated with manganese 38, this justifies the positive correlation Cu and Mn (r = 0.51).
The concentration of all heavy metals was higher at the G2 station because it is located downstream of the volume of water coming from the North of the country and from the neighbouring country, which carried the wastes discharged by most densely populated areas. Concentrations of Cd, Pb, Mn, Zn, Cu, As, Hg and Fe were determined in the waters of Guessabo Lake. Cd, Pb, Mn, Zn, Cu, As and Hg are present in the waters in low concentrations, with values below the JORF standards41 for raw water intended for the production of drinking water. High concentrations of Fe above the norm for the production of drinking water are observed in lake waters. These high levels are related to the preponderance of ferruginous soils in the study area42. This high iron content in surface water was reported by 43 in the waters of Lake Wadi El-Rayan in Egypt and by44 in the Aghien Lagoon in Côte d’Ivoire. Heavy metals come mainly from erosion of rocks, soils and sediments where they occur naturally. They come mainly from human activities 45. Their anthropic origins are multiple. They come from the leaching of plant protection products and fertilizers used in plantations. Indeed, Calamari et al., 46 noted the presence of elements studied in biocides and chemical fertilizers that are used at will in the study area. Leaching of domestic waste is a major source of heavy metals. These elements are found in all household waste compartments47. In addition, people cross the river using motorized boats that use fuel whose residues are dumped into the water. Also, the fishermen also use these motorized boats as means of displacement during the fishing activities. Calamari et al., 46 indicate that the fuels contain Hg, Cu, Fe, Mn, Pb and Cd. Field observations have shown that these fishing activities are more intense during the dry season and fishermen to increase the yield proceed to prohibited fishing techniques such as the establishment of Acadjas (implantation of clusters of branches planted on the plans of waters) to fish. These plants may contain high levels of heavy metals related to their emission by anthropogenic activities48. The decomposition of these causes a return of heavy metals in the lake. This could also explain the increase in the content of some during the dry season.
Cd and Fe show strong positive correlation (Table 7) with the indices (HPI et HEI) values indicating the metals are the major factors for the pollution in this region. In the table 6, mean values of HPI and HEI indices were observed to be 87 and 24, respectively, which indicated that the water samples of this lake were contaminated with low degree of pollution by heavy metals. So, severe precautions must be taken at the anthropogenic input location to control the heavy metal influx. The low scores are found at the stations (G3, G4) part which suggests the existence of similar point sources.
Fish Pollution
Iron showed the highest content in the muscles of both species of fish followed by Cu, Pb Hg and Cd. The results show that the average heavy metal content in fish muscles differs from one fish to another. This shows that different species of fish from the same stream contain different levels of heavy metal content. The cadmium content is generally low in nature. The concentrations of Cd (0.004 μg/g w.w) and Cu (3.35 μg/g w.w) in Chrysichthys nigrodigitatus from Guessabo Lake are lower than those found in fish of the same species in the Ogba River in Nigeria by 49 indicating 0.085 μg /g w.w for Cd and 5.32 μg/g w.w for Cu. However, high concentrations of Cu (0.1- 43.3 μg /g w.w) were reported in this type of fish in Tshangalele Lake in Congo due to mining activity50. The same author reported high values of Fe in the same lake (2.75- 81.1 μg /g w.w). Alipour et al., 51 found levels in the same order as ours in Miankaleh Lake in Iran (28 μg / g w.w). Chrysichthys nigrodigitatus fish from Guessabo Lake have Pb levels (0.07μg /g w.w) less than those from Ogba River (0, 5 μg /g w.w). With regard to mercury, the European Directive of 008/105 / EC of 16/12/2008 legislated on the Environmental Quality standard by setting the limit of 0.02 μg/g w.w content of fish in muscles for consumption. The mercury concentration in Chrysichthys nigrodigitatus ranged from 0.01 to 0.24 with an average of 0.056 μg/g w.w. This shows that grades are substantially higher than this standard. The tilapia content (0.038 μg / g w.w) is also higher than this standard. However, these concentrations remain lower than that proposed by 34, except for one fish containing Pb content (0.325 μg /g w.w) higher than this standard (0.3 μg / g w.w). Cd concentration (0.01 μg /g w.w) in Guessabo Lake’s tilappia spp are lower than those found in fish of the same species in the Galas River (0.02 μg /g w.w) and Langat River (0.03 μg /g w.w) 52,53. On the other hand, the Pb content (0.12 μg /g w.w) in the Guessabo Lake’s tilapia is higher than that determined in the fish of the same species in the Galas River in Malaysia by the same author52, which indicates 0.05 μg/g w.w for lead. This difference would be related to the state of metallic pollution of their respective biotope. In this study the most abundant elements in the fish were Cu and Fe and the weakest were Cd, Pb and Hg. The species that contains the maximum of toxic metals (Cd, Pb and Hg) is tilapia (0.168 μg/g w.w) against (0.131 μg / μg/g w.w) for fish of the genus Chrysichthys nigrodigitatus. On the other hand, Chrysichthys nigrodigitatus fish (31.02 μg / μg/g w.w) recorded the maximum of essential metals (Cu and Fe) compared to (17.88 μg / μg/g w.w) for tilapia spp and the tilapia spp recorded the mean higher in Cd, Pb and Cu. This difference in heavy metal concentrations between the two species may be due to the difference in their physiological capacity for assimilation and excretion of the ingested trace element and their anatomy, diet and habitat54. Indeed, Chrysichthys nigrodigitatus (demersal) has an omnivorous benthophagous diet 44. Living on the bottom, it finds its food in the muddy bottoms and consumes mostly organic detritus and invertebrates, while Tilapia is a planctophagous and benthopelagic species. Our results are contrary to those of 55 who found that Chrysichthys nigrodigitatus concentrated more non-essential metals than tilapia. The species of benthopelagic fish has more concentrated trace element Cd than the demersal species and this could be due to the fact that tilapias although closer to the sediments and also bioconcentrates this element trace metal present in the aquatic environment as well from the water. Indeed, some authors have shown that this element is more in aqueous phase than in sediments56. Chrysichthys nigrodigitatus (demersal) has concentrated more trace elements that are more present in solid phase because more benthic and feeding on benthic organisms or even muddy bottom.
Assessment of health risk related to metals
The hazard quotient of Hg was higher than other non-essential metals, mainly because of its low RfD value. The total value of non-carcinogenic risk index (HQ) for children (0.845) and for adults (0.39) for selected metals is less than unity, indicating that the selected metals are only little or no risk to residents through skin contact or ingestion. Children are most exposed to trace metals because of their low body weight and physiological fragility as contaminants are easily absorbed into their bodies55. The children’s organism potentially absorbs more contaminants and remains unable to eliminate them as easily as adults, since their elimination systems are less developed.
Conclusion
The study shows that the water of Guessabo Lake exhibits low concentration of heavy metals like Cd, As, Pb, Hg, Cu and Zn. The heavy metal pollution index (HPI <100) and heavy metal evaluation Index (HEI<40) place water quality in low contamination level. However, Guessabo Lake heavy metals Poll shows that the stations (G2 and G5) were moderately polluted in dry season. Fluctuations in concentration of various heavy metals have been observed in different seasons. Pearson’s correlation analysis has shown that it can be an effective tool for identifying the most contributing of trace elements to this Contamination. The results show that all the fish samples analyzed are not polluted by trace metals in comparison with the standards recommended by WHO / FAO. The health risk assessment of concomitant multi-pathway exposure has shown an absence or low risk for fishermen and their families live at the edges of this watercourse. However, some human activities are deplored in this Zone. The revelations of this study call on the authorities to persevere in the control of fishing techniques and in management, conservation and sustainable development, in order to allow an optimal use of this resource.
Acknowledgement
This study was part of the Ecosystem Approach project of the Fisheries Economy in Guessabo which allows capacity building for training and research in aquatic and environmental health in the upper Sassandra. We extend our appreciation to the directors of the Center for Oceanological Research (COR) and National Laboratory for Development Support (NLDS). These institutions have provided us with a remarkable framework and work facilities throughout this work. We would like to thank the local authorities for their support and fishermen for assisting us with collecting samples.
Conflicts of Interest
The authors declared that they have no conflicts of interest to this work.
References
- Shaymaa, H.; Khazaal, Khalida. F.; Al-Azawi, Hamsa. A.; Eassa, Abeer. H.; Khasraghib, Wafaa. R.; Alfatlawia, Abdulnasser. M. A-G., Study the level of Some Heavy Metals in Water of Lake Habbaniyah in Al-Anbar-Iraq Energy Procedia., 2019, 157, 68–74
- Traore, A.; Soro, G.; Kouadio, K.; Bamba, S.; Oga, S.; Soro, N.; Biemi, J., Evaluation des paramètres physiques, chimiques et bactériologiques des eaux d’une lagune tropicale en période d’étiage: la lagune Aghien (Côte d’Ivoire). Int. J. Biol. Chem. Sci., 2012, 6, 7048-7058. doi:http://dx.doi.org/10.4314/ijbcs.v6i6.40
- Jaishankar, M.; Tseten, T.; Anbalagan, N.; Mathew, B.B.; Beeregowda, K.N., Toxicity, mechanism and health effects of some heavy metals. Interdisciplinary toxicology., 2014, 7, 60–72. doi :10.2478/intox-2014-0009
- Pal, R.; Dubey, R.K.; Dubey S.K.; Singh A.K.; Nitant, A.K., Assessment of heavy metal and organic pollution in Yamuna river at Etawah district of Uttar Pradesh. Int. J. Chem. Studies., 2018, 6, 399-402
- Liang, Y.; Xiaoyun, Y.; Zhi, D.; Qin, W.; Houmei, L.; Jie, T., Heavy Metal Contamination and Health Risk Assessment in the Vicinity of a Tailing Pond in Guangdong, China. Int. J. Environ. Res. Public Health., 2017, 14, 1557-1571; doi:10.3390/ijerph14121557.
- FAO., The state of world fisheries and aquaculture. Opportunities and challenges., Food and Agriculture Organization of the United Nations. Rome, 2014
- Fair, P.A.; White, N.D.; Wolf, B.; Arnott, S.A.; Kannan, K.; Karthikraj, R.; Vena, J.E., Persistent organic pollutants in fish from Charleston Harbor and tributaries, South Carolina, United States: a risk assessment. Environ. Res., 2018, 167, 598–613.
- Zhong, W.; Zhang, Y.; Wu, Z.; Yang, R.; Chen, X.; Yang, J.; Zhu, L., Health risk assessment of heavy metals in freshwater fish in the central and eastern North China. Ecotoxicol. Environ. Saf, 2018, 157, 343–349.
- Liu, H.; Probst, A.; Liao, B., Metal contamination of soils and crops affected by the Chenzhou lead/zinc mine spill (Hunan, China). Sci. Total Environ, 2005, 339, 153–166
- Smith, A.H.; Lingas, EO.; Rahman, M., Contamination of drinking water by arsenic in Bangladesh: a public health emergency. Bull World Health Org, 2000,78,1093–1103
- Ahmed, K.M.; Baki, M.A.; Kundu, G.K.; Islam, S.M.; Islam, M.M.; Hossain, M.M., Human health risks from heavy metals in fish of Buriganga river, Bangladesh. Springerplus, 2016, 5, 1697. doi:10.1186/s40064-016-3357-0
- Bosch, A.C.; O’Neill, B.; Sigge, G.O.; Kerwath, S.E.; Hoffman, L.C., Heavy metals in marine fish meat and consumer health: A review. J. Sci. Food Agric, 2016, 96, 32–48.
- Zhuang, P.; Li, Z.A.; McBride, M.B., Health risk assessment for consumption of fish originating from ponds near Dabaoshan mine, South China. Environ. Sci. Pollut. Res, 2013, 20, 5844–5854. https://doi.org/10.1007/s11356-013-1606-0.
- Saha, N.; Mollah, M.Z.I.; Alam, M.F.; Rahman, M.S., Seasonal investigation of heavy metals in marine fishes captured from the Bay of Bengal and the implications for human health risk assessment. Food Cont, 2016, 70, 110–118.
- Behbahani, M.; Bagheri, A.; Amini, M.M.; Sadeghi, O.; Salarian, M.; Najafi, F.; Taghizadeh, M., Application of multiwalled carbon nanotubes modified by diphenylcarbazide for selective solid phase extraction of ultratraces Cd (II) in water samples and food products. Food Chem, 2013a, 141, 48–53.
- Cai, L.M.; Xu, Z.C.; Qi, J.Y., Assessment of exposure to heavy metals and health risks among residents near Tonglushan mine in Hubei, China. Chemosphere, 2015, 127, 127–135. https://doi.org/10.1016/j.chemosphere.2015.01.027.
- Alves, R.; Sampaio, C.; Nadal, M.; Schuhmacher, M.; Domingo, J.; Segura-Muñoz, S., Metal concentrations in surface water and sediments from Pardo River, Brazil: Human health risks”, Environ. Research, 2014, 133, 149–155
- Wu, B.; Zhao, D.Y.; Jia, H.Y.; Zhang, Y.; Zhang, X.X.; Cheng, S.P., Preliminary risk assessment of trace metal pollution in surface water from Yangtze river in Nanjing section, China. Bull. Environ. Contam and Toxicol, 2009, 82, 405-409
- Pierre-Yves, B.; Riffard-Chenet, M., Etat et perspectives d’aménagement du bassin du Sassandra en Côte d’Ivoire. In, Hammamet, 2015, 9 p.
- Kouamé, K.F., Gestion intégrée des ressources en eau en Afrique tropicale humide. Cas du bassin versant du N’zo à l’Ouest de la Côte d’Ivoire. Contribution de la télédétection, des systèmes d’informations géographiques et de la modélisation hydrologique. Thèse de Doctorat d’État, Université de Cocody Abidjan, Côte d’Ivoire, 2011, 250 p.
- Kouamé, K. B.; Konan, K.S.; Attoungbre K.S.; Konan, K.F.; Boussou, K.C.; Kouamé, K.M., Qualitative Assessment and Typology of the Water Resource Used for the Production of Drinking Water in Duékoué, Western Côte d’Ivoire, Journal of Geoscience and Environment Protection, 2019, 7, 212-231. https://doi.org/10.4236/gep.2019.75017
- Nimic, D.A.; Moore, J.N.; Prediction of water-soluble metal concentrations in fluvially deposited tailings sediments, Upper Clark Fork Valley, Montana, U.S.A. Appl. Geochem, 1991, 6, 635–646
- Bhuiyan, M.A.H.; Bodrud-Doza Md.; Towfiqul, I.A. R. M.; Rakib M. A.; Safiur R.M.; Ramanathan A. L., Assessment of groundwater quality of Lakshimpur district of Bangladesh using water quality indices, geostatistical methods, and multivariate analysis. Environ Earth Sci, 2016, 75:1020, doi 10.1007/s12665-016-5823-y
- Backman, B.; Bodis D, Lahermo, P.; Rapant, S.; Tarvainen, T., Application of a groundwater contamination index in Finland and Slovakia. Environ. Geology,1977, 36, 55-64
- Mohan, S.V.; Nithila, P.; Reddy, S.J., Estimation of heavy metal in drinking water and development of heavy metal pollution index. J. Environ. Sci. Health A, 1996, 31, 283-289.
- Onkar, S. B.; Sulochana, J., Evaluation of Water Quality Pollution Indices for Heavy Metal Contamination Monitoring in the Water of Harike Wetland (Ramsar Site), India. Int. J. Sci. and Research Publications, 2015, 5, 1-6
- Prasad, B.; Jaiprakas, K.C., Evaluation of heavy metals in ground water near mining area and development of heavy metal pollution index. J Environ. Sci. Health A, 1999, 34, 91–102
- USEPA (United States Environmental Protection Agency). Risk Assessment Guidance for Superfund Volume 1. Human Health Evaluation Manual (Part A). EPA/540/1-89/002 Office of Emergency and Remedial Response. Washington, DC: U.S. Environmental Protection Agency, 1989
- Belkhiri, L.; Ammar, T.; Lotfi, M., Assessment of Heavy Metals Contamination in Groundwater: A Case Study of the South of Setif Area, East Algeria, 2018, 1-14 http://dx.doi.org/10.5772/intechopen.75734
- Tianjie, S.; Lihuan, P.; Zhiqing C.; Ruiyuan W.; Wenjing, L.; Qing, Q.; Yuran, H.; Content of Heavy Metal in the Dust of Leisure Squares and Its Health Risk Assessment—A Case Study of Yanta District in Xi’an. Int. J. Environ. Res. Public Health., 2018, 15, 394; doi:10.3390/ijerph15030394
- Mwakalapa, E.B.; Simukoko, C.K.; Mmochi, A.J.; Mdegela, R.H.; Berg, V.; Bjorge Müller, M.H.; Lyche, J.L.; Polder, A., Heavy metals in farmed and wild milkfish (Chanos chanos) and wild mullet (Mugil cephalus) along the coasts of Tanzania and associated health risk for humans and fish, Chemosphere, 2019, 1-29. doi: https://doi.org/10.1016/j.chemosphere.2019.02.063.
- USEPA (United States Environmental Protection Agency). Risk Assessment Guidance for Superfund Volume I: Human Health Evaluation Manual (Part E, Supplemental Guidance for Dermal Risk Assessment). EPA/540/R/99/005 Office of Superfund Remediation and Technology Innovation U.S. Environmental Protection Agency Washington, DC, 2004.
- Tanouayi G. ; Gnandi, K. ; Ahoudi H. ; Ouro-Sama, K., Contamination metallique des eaux de surface et des eaux souterraines de la zone miniere d’exploitation des phosphates de hahotoe-kpogame (sud-togo): cas du cadmium, plomb, cuivre et nickel. Larhyss Journal, 2015, 2, 25-40
- USEPA.; The state of the world fisheries and aquaculture; meeting the sustainable for Superfund Volume 1. Human Health Evaluation Manual (Part A). EPA/540/1-89/002 Office of Emergency and Remedial Response. Washington, DC: U.S. Environmental Protection Agency, 2018
- FAO., The state of world fisheries and aquaculture. Opportunities and challenges., Food and Agriculture Organization of the United Nations. Rome, 2014.
- WHO., Guidelines to Drinking-water Quality (fourth edition), ISBN 978 92 4 1548151 (NLM classification: WA 675, 2011, 564 p.
- Rajeshkumar, S.; Liu, Y.; Zhang, X.; Ravikumar, B.; Bai, G.; Li, X., Studies on seasonal pollution of heavy metals in water, sediment, fish and oyster from the Meiliang Bay of Taihu Lake in China, Chemosphere, 2017, 191, 626-638 doi: 10.1016/j.chemosphere.10.078.
- Matías M, S, A., Contamination en métaux lourds des eaux de surface et des sédiments du Val de Milluni (Andes Boliviennes) par des déchets miniers, These de doctorat de l’universite de toulouse délivrée par l’université toulouse III– paul sabatier, 2008, 352P
- Vukovic, D.; Stankovic, S.J.; Vukovic, Z.; Jankoviv, K., Transport and storage of heavy metals in the Sava River Basin in Serbia. J Serbian Chem Soc, 2014, 79, 379–387.
- Nieboer, E., Fletcher, G. G., Thomassen, Y.; Relevance of reactivity determinants to exposure assessment and biological monitoring of the elements. J. Environ. Monit, 1999, 1 :1–14
- JORF (Journal Officiel de la Republique Francaise)., Limites et références de qualité des eaux douces superficielles utilisées pour la production d’eau destinée a la consommation humaine, à l’exclusion des eaux de sources conditionnées. Fixées pour l’application des dispositions prevues aux articles R.1321-38 a R.1321-41 Ministere de la Sante et des Solidarités. Arrêté du 04/08/2017 modifiant plusieurs arrêtés relatifs aux eaux et références de qualité des eaux brutes et des eaux destinées à la consommation, 2017.
- Kouassi, A.M.; Yao, K. A.; Ake, A. Y.; Biemi, J., Application des méthodes d’analyses statistiques multivariées à l’étude de la minéralisation des eaux des aquifères fissurés de la zone Guiglo-Duekoué (Ouest de la Côte d’Ivoire). International Journal of Biological and Chemical Sciences, 2011, 5, 2155-2169. https://doi.org/10.4314/ijbcs.v5i5.35
- Shama, S.A.; Goher, M.E.; Abdo, M.H.; Kaial, S.M.; Ahmed, A.A.; Physico-chemical characteristics and heavy metal contents in water of Wadi El-Rayan Lakes, western desert, Egypt. Egypt. J. Aquat. Biol. & Fish., 2011, 15, 225-240.
- Traoré, A., Impacts des changements climatiques et du changement de l’occupation et de l’utilisation du sol sur les ressources en eau de l’environnement lagunaire d’Aghien et de potou (sud-est de la côte d’ivoire). Thèse unique doctorat en Sciences de la Terre et des Ressources Minières de l’Université Félix Houphouët-Boigny de Cocody, 2016, 249 p.
- Geffard O., Toxicité potentielle des sédiments marins et estuariens contaminés: Evaluation chimique et biologique, biodisponibilité des contaminants sédimentaires. Thèse de Doctorat, Université Bordeaux I, 2001, 376 p.
- Calamari, D.; Naeve, H., Revue de la pollution dans l’environnement aquatique africain. Document Technique du CPCA, No25. Rome, FAO, 1994, 129 p.
- Miquel, G., Rapport sur les effets des métaux lourds sur l’environnement et la santé. Office parlementaire d’évaluation des choix scientifiques et technologiques. N° 2979 Assemblée Nationale, 2001, 366 p.
- Yebpella, G. G.; Magomya, A. M.; Udiba U. U.; Gandu I.; Amana, S. M.; Ugboaja, V. C.; Usman N. L., Assessment of Cd, Cu, Mn and Zn levels in soil, water and vegetable grown in irrigated farm along River Kubani, Zaria, Nigeria. J. Appl. Environ. Biol. Sci., 2011, 5, 84-89.
- Obasohan, E. E.; Oronsaye, J. A. O.; Obano, E. E., Heavy metal concentrations in Malapterurus electricus and Chrysichthys nigrodigitatus from Ogba River in Benin City, Nigeria. Afr. J. Biotech, 2011, 10, 974-982.
- Squadrone, S.; Burioli, E.; Monaco, G.; Koya, M.K.; Prearo, M.; Gennero, S.; Dominici, A.; Abete, M.C., Human exposure to metals due to consumption of fish from an artificial lake basin close to an active mining area in Katanga (D.R. Congo). Sci. Tot. Environ, 2016, 568, 679–684.
- 50. Alipour, H., Pourkhabbaz, A., Hassanpour, M., Estimation of potential health risks for some metallic elements by consumption of fish. Water Qual. Expo. Health, 2015, 7, 179–185.
- Zarith, S.B.; Mohd, Y.I., Determination of heavy metal accumulation in fish species in Galas River, Kelantan and Beranang mining pool, Selangor. Procedia Environ. Sci, 2015, 30, 320 – 325
- Abdulali, T.; Shuhaimi-Othman, M.; Ahmad, A.K., Assessment of heavy metals in Tilapia fish (Oreochromis niloticus) from the Langat river and engineering lake in Bangi, Malaysia and evaluation of the health risk from tilapia consumption. Ecotox. Environ. Saf, 2003, 93, 45-51
- Varol, M.; Muhamm, S. R., Environmental contaminants in fish species from a large dam reservoir and their potential risks to human health. Ecotox. Environ. Saf, 2019,169, 507-515
- Kamilou, O-S.; Hodabalo, D.S.; Kissao, G.; Komlan, M. A.; Essô, J. B., « Évaluation et risques sanitaires de la bioaccumulation de métaux lourds chez des espèces halieutiques du système lagunaire togolais », VertigO – la revue électronique en sciences de l’environnement [En ligne], 2014, 14 ,1-17 consulté le 16 juin 2019. URL: http://journals.openedition.org/vertigo/15093; doi : 10.4000/vertigo.15093
- Okugbe, O.E., Addo, G.F.; Zhang, S.; Han. N.; Anim-Larbi. K., Distribution and relationship between antimicrobial resistance genes and heavy metals in surface sediments of Taihu Lake, China. J. Environ. Sci, 2018, 1-14 https://doi.org/10.1016/j.jes.2018.09.004

This work is licensed under a Creative Commons Attribution 4.0 International License.
![]()
A New Edition of Web of Science
Journal Impact Factor
2022: 0.5
Five Year: 0.8
Journal is Indexed in

Cabells Whitelist
![]()


