Heavy Metal Pollution and Mobility in Soils within a Landfill Vicinity: A South African Case study
Joan Mwihaki Nyika1, Ednah Kwamboka Onyari*1 , Megersa Olumana Dinka2 and Shivani Bhardwaj Mishra3
1Department of Civil and Chemical Engineering, University of South Africa [Florida science campus], Cnr Christian de Wet Road and Pioneer Avenue, Johannesburg, South Africa.
2Department of Civil Engineering Science, University of Johannesburg, APK Campus 2006, Johannesburg.
3Nanotechnology and Water Sustainability Unit, University of South Africa [Florida science campus], Cnr Christian de Wet Road and Pioneer Avenue, Johannesburg, South Africa.
Corresponding Author E-mail: Onyarek@unisa.ac.za
DOI : http://dx.doi.org/10.13005/ojc/350406
Article Received on : 13-02-2019
Article Accepted on : 16-07-2019
Article Published : 19 Aug 2019
Heavy metal contamination in soils results from anthropogenic and lithologic factors and is a potential hazard to land and water resources. Sources of such pollution include landfills, domestic sewage, agricultural fertilisers and industries. In this work, soils from Roundhill landfill vicinity in South Africa were sampled and analyzed to determine the concentrations of particular heavy metals, namely As, Co, Cr, Cu, Fe, Mn, Ni, Pb, V and Zn. The main objectives of this work were to: quantify the concentration levels of heavy metals in the soil; determine the mobility of the heavy metals in the soil; and establish their origins and interrelationships. The soils were collected at various distances and depths from the landfill facility. The concentrations of heavy metals in the soil samples were analysed by ICP-MS and statistical analysis was carried out to establish their relationships and sources. From the analysis, some elements including Cr, Mn, Cu and Ni had measured concentrations beyond the threshold limits in most sampling sites irrespective of their distance and depth from the landfill vicinity. Conversely, some elements were observed to be immobile and had higher concentrations on the top soils closer to the landfill, such as As, Pb, Zn, Co and V. Iron (Fe) had high concentrations in all the sampling sites due to its natural occurrence in the parent rocks. In conclusion, the potential of soil quality deterioration due to heavy metal pollution in a landfill vicinity was observed. Furthermore, all heavy metals observed showed positive correlation to each other except for As and Co, indicating same origin.
KEYWORDS:Contamination; Heavy Metals; Landfill; Pollution; Soils; South Africa
Download this article as:| Copy the following to cite this article: Nyika J. M, Onyari E. K, Dinka M. O, Mishra S. B. Heavy Metal Pollution and Mobility in Soils within a Landfill Vicinity: A South African Case Study. Orient J Chem 2019;35(4). |
| Copy the following to cite this URL: Nyika J. M, Onyari E. K, Dinka M. O, Mishra S. B. Heavy Metal Pollution and Mobility in Soils within a Landfill Vicinity: A South African Case Study. Orient J Chem 2019;35(4). Available from: https://bit.ly/2PiVzDB |
Introduction
Soils are imperative environmental components that support food production, crucial ecosystem services, recycling of essential nutrients and influence human well-being.1-2 Despite this significance, knowledge on the contaminants that occur in soils through anthropogenic or lithological influence is limited.3 In particular, sub-Saharan Africa suffers from poor soil health due to nutrient mining whose effects are transferred to crop and human health leading to limited economic development.4 The soils of this region are vulnerable to contamination particularly in hotspots such as urban areas, around mining and landfill facilities.5 The contamination challenge is exacerbated by current economic trends favouring industrialisation and urbanisation, which results in increased waste generation and environmental pollution. Traditionally, these pollutants could be naturally degraded though it is impossible in modern day due to their complex and heterogeneous nature as well as their high quantities.6 Heavy metals such as nickel (Ni), manganese (Mn), arsenic (As), zinc (Zn), lead (Pb), mercury (Hg), copper (Cu), chromium (Cr), cobalt (Co), iron (Fe) and cadmium (Cd) are examples of such recalcitrant, toxic and ubiquitous group of pollutants associated with increased anthropogenic activities.6-7
Many authors have used various techniques to assess heavy metal pollution in soils including ground invasive radar,8 neutron activation assessment,9 inductively coupled plasma spectrometry,9 atomic absorption spectrophotometry11 and magnetic susceptibility analysis.12 These methods attest to the need to characterise civilisation-related soil pollution in developing countries using rapid and robust screening techniques usable under basic settings to support agricultural growth and control environmental pollution as indispensable.1,4 Spectroscopy techniques unlike conventional chromatographic separation and electrochemical methods are potential approaches for soil characterisation analyses since they are highly reproducible and rapid.3 They are widely used in chemical analyses of soils.13-15 The methods however require extensive equipment calibration to widen the range of analysable elements and minimize interferences.3 Additionally, extraction procedures used in these methods are time consuming and often demand harsh conditions such as the use of acids.5
Inductively Coupled Plasma-Mass Spectrometry (ICP-MS) is an accurate and rapid multi-element technique with high sensitivity that can detect up to parts per billion (ppb).16 Many studies have used the method in assessment of contamination in landfills as was the case in Onderstepoort landfill of South Africa,17 Bukit Beruntung and Taman Beringin landfills of Malaysia,6 Aba-Eku landfill of Nigeria,18 and Ampar Tenang dumpsite of Malaysia.19 Similar studies are limited in most developing countries. This study aimed to (1) identify the different heavy metals causing pollution and quantify their concentrations (2) determine the extent of mobilisation of various contaminants from Roundhill landfill (3) assess the effects of leachate on soil quality (4) carry out statistical analysis to understand the elements’ sources and interrelationships.
Materials and Method
Study Area
Roundhill landfill is situated in latitude 32°53’13.66“S and longitude 27°37’26.20“E. It is located in Berlin, Buffalo City Municipality and is 30 km to the west of East London in South Africa’s Eastern Cape Province. It covers an area of 56 hectares, has a gentle slope at 3.5° towards the southeast and northeast bordering dairy farms and active croplands. The site lies between King William’s town railway line and N-2 national road and was previously natural grassland used for grazing. It is a general landfill site (G: L: B+). G means it is permitted to receive non-hazardous waste only while L means it is a large site with a maximal disposal rate greater than 500 tons daily while B+ means its location is in a positive climatic water balance with potential to generate leachate.20 It began operations in 2006 under Buffalo City Metropolitan Municipality authority.21 Figure 1 shows the map of the study area.
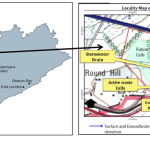 |
Figure 1: Map of the study area. |
Sampling and Sample Preparation
For the purpose of this study, 8 soil sampling sites whose coordinates are shown in Table 1 and an additional control site (Blank) were selected based on distance and location from the landfill facility. A convenience sampling approach was adopted where only soils that were accessible at sampling time were collected. The method was deemed suitable because the landfill site is located near a thick forest and its surrounding has steep and rocky terrain. Dornyei22 explained that convenience sampling is suitable for gathering data for accessible samples and can be used for generalisation purposes effectively. The soils were collected with increasing distance from the landfill site at 0, 50, 100, 250 and 500 meters away. Additionally, 3 sampling sites namely West 1, West 2 and East 1 were collected.
A GPS was used to locate the sampling sites and a hand-held auger was used to collect the samples at 30cm, 60cm and 100cm depths in all sampling sites. An additional sampling site was chosen away from the landfill site and soils collected at the three depths to serve as controls (blank). The twenty-seven samples were transferred in plastic bags and sealed for transportation. Prior to analysis, soil samples were oven-dried at 105°C for 12 hours.
Table 1: Locations of the various sampling sites.
| Sampling Site | Distance from landfill(m) | Coordinates |
| L 0 | 0 | 32° 53ꞌ 28” S 27○ 37ꞌ 29” E |
| L 50 | 50 | 32° 53ꞌ 30” S 27○ 37ꞌ 35” E |
| L 100 | 100 | 32° 53ꞌ 33” S 27○ 37ꞌ 32” E |
| L 250 | 250 | 32° 53ꞌ 42” S 27○ 37ꞌ 39” E |
| L 500 | 500 | 32° 53ꞌ 48” S 27 ○ 37ꞌ 52” E |
| West 1 | 50m to the West Corner | 32° 53ꞌ 07” S 27○ 37ꞌ 28” E |
| West 2 | 50m South West Corner | 32° 53ꞌ 29” S 27○ 37ꞌ 05” E |
| East1Blank | 50m to the West Corner2km | 32° 53ꞌ 12” S 27○ 37ꞌ 41” E32○ 53ꞌ 36” S 27○ 36ꞌ 08” E |
Analytical Methods
Analysis began with aqua regia digestion of soils using the EPA method 3052, where 1g of each dry soil sample was weighed and emptied in a teflon vessel before adding 9ml, 2ml and 1ml nitric acid, hydrochloric acid and hydrogen peroxide, respectively and sealing to allow reaction for 5 minutes23. The reaction vessels were heated in a microwave at 1800C for 5.5 minutes and held for 9.5 mins before cooling. The digestate was emptied in plastic containers and labelled. Determination of heavy metals by ICP-MS was performed using standard addition and internal standard methods. Co, Cr, As, Cu, Mn, Ni, Pb, Zn, V and Fe were determined after microwave-assisted digestion. This research used the Agilent 7500ce ICP-MS that has an octopole reaction system24. An external standard method using an internal standard mix consisting of 6Li, 45SC, 72Ge, 115In and 209Bi in 2% nitric acid matrix was used for equipment calibration. Calibration curves were constructed using the National Institute of Standards and Technology (NIST) reference standards and ultra-pure water was used to prepare blanks and assess possible contamination. The equipment’s accuracy was assessed using calibration standards regularly during analysis. 100µl of each sample digestate was drawn and diluted to 10ml for analysis. After analysis by ICP-MS the final concentration of each metal was determined using the following equation: –

The data was subject to statistical analysis using xlstat software to assess differences in concentration based on depths and distances from the landfill site. Additionally, sample concentrations were compared with South Africa’s and WHO25 permissible limits for heavy metal contamination in soils shown in Table 2 to confirm pollution. Principal Component Analysis (PCA), a method used to reduce variables of multiple interrelated datasets and explain variance in collected samples was used to assess heavy metal relationships with sampling sites. This information helped in deriving the origin of heavy metals. The method has been used in studies by McKillup and Dyar,26 Mosaferi et al,27 and Bhat et al28 to explain variances of observed heavy metals successfully. Pearson’s correlation coefficient, which is a measure linear association of two variables and their strength, was used to find the relationship between identified heavy metal concentrations to understand their origin. The method is widely used in linear variable interrelation compared to Spearman’s correlation due to its accuracy.29-30
Table 2: Documented permissible limits for soil contamination with heavy metals (mg/kg).
| Heavy Metal | As | Co | Cr | Cu | Mn | Ni | Pb | Zn | V | Fe |
| DEA Limits (mg/kg) | 5.8 | 300 | 6.5 | 16 | 2000 | 91 | 20 | 240 | 150 | n.a |
| WHO Limits (mg/kg) | 20 | 50 | 100 | 100 | 740 | 50 | 100 | 300 | 2 | 5000 |
*n.a stands for not available meaning no comparative standard is documented.
Results and Discussions
This work delved into experimental work to determine heavy metal pollution in soils within the vicinity of Roundhill landfill in South Africa. Statistical results of heavy metal concentrations including As, Co, Cr, Mn, Ni, Pb, Zn, V and Fe are shown in Table 3. Average concentrations (mg/kg) of As, Co, Cr, Cu, Mn, Ni, Pb, Zn, V and Fe elements from the sampled soils were 33.4, 481.6, 1335.1, 219.4, 8991.5, 354.3, 46.1, 159.7, 435.6 and 155, 268 in respective order. The levels of Fe and Mn in the soils were higher compared to other metals, which could be attributable to lithological contribution rather than pollution alone while As and Pb had the least values. Kurt24 reported a similar trend in Mersin, Turkey whereby high concentrations of Mn and Fe was a derivative of the soils’ nature. Kumar et al31 and Shao et al32 reported similar findings in a heavy metal analysis of contaminated urban soils of Tokyo, Japan and Zhangjiagang city of China, respectively. Agbenin33 reported the presence of high Mn and Fe levels in soil concretions because they are major hydroxides and oxides of soils during its pedogenetic processing. Calculated SD values of various elements were far from and higher compared to the mean, which could be attributable to the high variability of the dataset.
Table 3: Statistical summary of heavy metal properties: sample count, minimum and maximum values, mean concentration and standard deviation.
| As mg/kg | Co mg/kg | Cr mg/kg | Cu mg/kg | Mn mg/kg | Ni mg/kg | Pb mg/kg | Zn mg/kg | V mg/kg | Fe mg/kg | |
| Counts | 27 | 27 | 27 | 27 | 27 | 27 | 27 | 27 | 27 | 27 |
| Mean | 33.4 | 481.6 | 1335.1 | 219.4 | 8991.5 | 354.3 | 46.1 | 159.7 | 435.6 | 155268 |
| Min | 0 | 0 | 516 | 34 | 1101 | 156 | 0 | 74 | 0 | 87111 |
| Max | 201 | 1523 | 7899 | 563 | 38943 | 903 | 256 | 567 | 1353 | 244963 |
| Median | 7 | 298 | 978 | 186 | 4672 | 267 | 14.6 | 128 | 400 | 143923 |
| SD | 56 | 439 | 1375 | 104 | 9674 | 188 | 65 | 112 | 440 | 42094 |
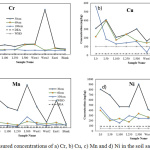 |
Figure 2: Measured concentrations of a) Cr, b) Cu, c) Mn and d) Ni in the soil samples. |
Graphical comparisons of heavy metal distribution based on depth at 30cm, 60cm and 100cm and in comparison with South African standards as defined by the National Norms and Standards for Remediation of contaminated land and soil quality34 and the WHO limits25 are shown in figures 2-4. A comparison of the concentrations of various heavy metals with the DEA34 and WHO25,35 standards confirmed pollution in many of the sampling sites. Soil pollution by Cr, Mn, Cu and Ni was beyond the two threshold limits in most of the sampling sites irrespective of their depths. A similar case was reported for Fe when compared to WHO permissible limits of 5, 000mg/kg since DEA limits were unavailable. At 30cm all samples showed Co pollution beyond the permissible levels of 300mg/kg and 50mg/kg by DEA and WHO, respectively while metal concentrations at 60cm and 100cm sampling sites were within permissible limits. A similar case was evident in V whereby soils at 30cm surpassed the 150mg/kg and 2mg/kg limit set by DEA and WHO, respectively. Zn pollution did not go beyond the permissible limits of 240mg/kg and 300mg/kg set by DEA and WHO, respectively except for top soils at L0 and L50 sampling sites. Levels of As only exceeded the DEA and WHO thresholds of 5.8mg/kg and 20 mg/kg, respectively in the top soil at L0, L50, West1 and West2 sampling sites. Levels of Pb in most sampling sites were within the 20mg/kg permissible limit by DEA but surpassed the 100mg/kg limit permissible limit by WHO in sampling sites at 30cm. The results of pollution concentration due to landfill leachate in all sampling sites were confirmed compared to control samples whose values were lower, an observation that ruled out lithologic pollution causes except for Fe.
All metal concentrations at all sampling sites were higher at top soils (30cm) compared to bottom soils (60 cm and 100 cm). In particular, Cr, Cu, Mn and Ni (Figure 2) have high concentrations at all sampling sites compared to the used threshold limits. The trend possibly points to pollution of soil by leachate and hence, its subsequent mobilisation vertically and potential toxicity to groundwater. In Sungai Buloh,36 Taman Beringin,19 Bukit Beruntung and Ampar Tenang6 landfill vicinities of Malaysia, similar trends whereby top soils had higher heavy metal concentrations compared to bottom soils due to leachate contamination and migration from the facilities was reported. All metals concentrations showed a decreasing trend with increasing distance away from the landfill. The dispersive and diffusive spread of leachate could be attributable to this trend. Memarianfard and Poshtegal37 highlighted the potential of landfill leachate to pollute soils through its diffusive movement.
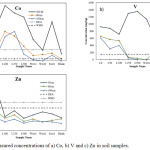 |
Figure 3: Measured concentrations of a) Co, b) V and c) Zn in soil samples. |
The levels of As, Pb, Cr, Zn, Co and V (Figure 3 and 4) were high at top soils; mostly at 30cm and 60cm sampling site and their concentrations decreased with increasing distance from the landfill. Concentrations were highest at L0, L50, West1 and West 2 sampling sites. This trend points to their sources as anthropogenic owing to landfill leachate contribution rather than from the soil’s composition. Studies in urban areas38-39 attributed the high concentrations of As, Cr and Zn to anthropogenic activities in the vicinities including use of agricultural fertilisers, waste disposal and burning. High concentrations of As, Pb, Cr, Zn, Co and V close to the landfill could be associated with the landfill’s residual fractions whose incorporation with alumimosilicate minerals makes heavy metal release and movement in water slower until dissociation has occurred. Bahaa-Eldin et al40 observed that residual fractions of some heavy metals become immobile on top soils and nearer to the pollution source until they dissociated hence their high concentration in top soils nearer to the landfill compared to distant ones in a study at Dengkil dumpsite of Malaysia.
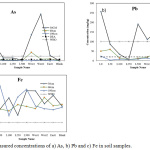 |
Figure 4: Measured concentrations of a) As, b) Pb and c) Fe in soil samples. |
Although all heavy metals have high concentrations nearer to the landfill facility, Co, Cu, Mn, Ni, Pb and V also have concentration peaks at distances away from the landfill mainly L250 and L500 sampling sites. This trend could be attributable to the high horizontal mobility of the metals and their capacity to be weakly bound and released. This observation was made in Taman Beringin and Bukit Beruntung landfills where Pb and Mn were highly mobile6 and in a smelting facility of Poland whereby Cu and Pb moved faster away from the facility.41 The observed high concentrations of contaminants distances away from the landfill site could be attributed to previous mismanagement of the landfill characterised by inadequate leachate collection systems, illegal dumping in unlined cells, mixing of general and hazardous waste, and non-compaction of waste after tipping. These past management practices could have enhanced leachate migration especially in wet seasons.20-21 The mismanagement of Chhattisgarh industrial area of India through illegal waste tipping was correlated to heavy metal pollution in soils two kilometres away from the site.42 A high concentration of the metals farther from the landfill could be because of moisture content, which controls the viscosity of soils such that wet soils are less viscous and allow heavy metal migration to far distances compared to drier ones. Sakawi et al19 made a similar observation at Ampar Tenang dumpsite where Mn and Zn concentrations were high distances away from the landfill where soil moisture content was higher compared to areas nearer to the facility. Concentration levels of Fe in different depths however do not follow a similar trend, which could point to its source being lithologic as observed in Table 3. High concentrations of the mineral in the control (blank) samples irrespective of their depth further confirms lithological contribution of the pollutant (Figure 4). The geology of the landfill surroundings has dolerite that consists of mafic rocks, which are enriched with Fe according to Norman43 and possibly explains the observed high concentrations across all depths and in the blank samples. Wuana and Okieimen44 suggested that soils have high Fe concentrations because of its occurrence naturally as a hydroxide and oxide of soil pedogenetic process.
Table 4: Pearson’s correlation matrix for observed heavy metals concentrations.
| Variables | As | Co | Cr | Cu | Mn | Ni | Pb | Zn | V | Fe |
| As | 1.00 | -0.01 | 0.66 | 0.30 | 0.20 | 0.27 | 0.68 | 0.62 | 0.35 | 0.23 |
| Co | -0.01 | 1.00 | 0.08 | 0.14 | 0.70 | 0.59 | 0.35 | 0.35 | 0.71 | 0.05 |
| Cr | 0.66 | 0.08 | 1.00 | 0.12 | 0.13 | 0.16 | 0.49 | 0.19 | 0.23 | 0.01 |
| Cu | 0.30 | 0.14 | 0.12 | 1.00 | 0.28 | 0.45 | 0.32 | 0.49 | 0.39 | 0.02 |
| Mn | 0.20 | 0.70 | 0.13 | 0.28 | 1.00 | 0.90 | 0.71 | 0.50 | 0.80 | 0.36 |
| Ni | 0.27 | 0.59 | 0.16 | 0.45 | 0.90 | 1.00 | 0.77 | 0.64 | 0.75 | 0.34 |
| Pb | 0.68 | 0.35 | 0.49 | 0.32 | 0.71 | 0.77 | 1.00 | 0.66 | 0.64 | 0.39 |
| Zn | 0.62 | 0.35 | 0.19 | 0.49 | 0.50 | 0.64 | 0.66 | 1.00 | 0.50 | 0.03 |
| V | 0.35 | 0.71 | 0.23 | 0.39 | 0.80 | 0.75 | 0.64 | 0.50 | 1.00 | 0.21 |
| Fe | 0.23 | 0.05 | 0.01 | 0.02 | 0.36 | 0.34 | 0.39 | 0.03 | 0.21 | 1.00 |
* Values in bold are different from 0 with a significance level alpha=0.05.
Pearson’s correlation coefficient (Table 4) was used to relate heavy metal concentrations of the study area and their origin as has been done in many studies.24,45-48 All metals showed positive correlations except for As that had negative correlation with Co. Most metals including V, Zn, Pb, Ni, Mn, Cu, Cr, As had high correlations with each other which could indicate a common source of pollution. Aydi49 reported a similar trend in a heavy metal contamination assessment at Bizerte landfill of Tunisia whereby metals with high correlation coefficients were deemed to be from the same pollutant source. Yang et al47 made similar suggestions whereby strong correlation between elements was attributed to similar contamination sources. Duressa and Leta35 suggested that a strong correlation in Cu, Zn, V, Mn, Ni and Pb could point to waste sourced from fuel, refineries, fertilisers, biocides, paints and pigments. Fe had low correlation with other elements, which could allude to its sources being different. Additionally, it ratifies results reported in Table 3 and Figure 4 that lithology in addition to leachate pollution could be attributable to the high levels of the metal. A similar trend was documented by Kurt,50 Yong and Mulligan51 whereby low correlation factors of As and Cr were associated with waste burning, contamination by fossil fuels and agricultural activities from landfill surroundings in addition to leachate contamination.
PCA results of factor loadings in relation to Eigen values and the correlation of heavy metals elements to the main factor loading (F1) are shown in Figure 6. Ten Principal Components (PC) that accounted for 49%, 17%, 11%, 9%, 6%, 4%, 2%, 1%, 0.7% and 0.3% of the total variation in respective order were attained with eigen values >1 (Figure 6 a). The PC were reduced to one due to its high variability and high loadings of Mn, Ni, Pb, Zn and V, which suggested that these metals contributed significantly to the first PC (F1) compared to the other 9 (Figure 6 b). The trend suggests high inter-correlation and close variance of the heavy metals. Pujiwati et al52 suggested that high loadings of elements result from inter-elemental relations in a PCA analysis of contaminated soils of Jorong district of Indonesia. High loadings of Ni, Pb and Zn for F1 could be attributable to their chalcophylic nature whereby the elements occur in the form of carbonates and sulphides. Loska and Wiechula53 made a similar observation in a multivariate analysis of sediments from Rybnik reservoir of Poland whereby high factor loadings of the Cd, Ni, Zn and Pb was attributed to their origin and occurrence nature as carbonate and sulphide complexes.
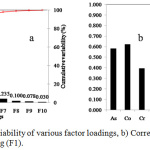 |
Figure 5a: Eigen value variability of various factor loadings, b) Correlation of heavy metals with the major factor loading (F1). |
Additionally, the burning of waste and disposal of metal scrap together with municipal waste in the study area could be attributable to the high loadings of Pb, Zn and Ni. Horak and Hejcman54 made a similar observation in PCA of sediments from a smelting firm at Kutna Hora (Czech Republic) whereby Cr, Zn and Pb had high loadings due to waste burning and dumping of metal waste. High loadings of Mn could be because of its contribution to soil weathering and its role in controlling the absorption and desorption of other trace metals. High levels of Mn occur in soils as oxide or hydroxide coatings of soils during pedogenesis.55
Table 5 and 6 show the contribution of variables (heavy metals) and observations (sampling sites) to the factor loadings. Only the first PCA (F1) was considered due to its high percentage variability. Mn, Ni, Pb, Zn, and V had high percentage variability at 15.18%, 16.65%, 16.08%, 11.57% and 14.87%, respectively alluding to their closely related variance and inter-elemental relationship (Table 5). These results are confirmed by the Pearson’s correlation analysis results. Additionally, the trend points to similar pollution source as suggested by Singh et al56 in an elemental profiling of agricultural soils of Tarai region of India whereby high percentage variable contribution was associated to similar pollutant sources. Fe had the lowest variable contribution at 2.44% suggesting a different pollution source apart from landfill leachate. The high variability of Mn, Ni, Pb, Zn and V could suggest that these elements are the most significant pollutants in the study area. Pujiwati et al52 made similar suggestion in a heavy metal multivariate analysis of a coalmine in Indonesia whereby Cr, Cu, Ni, Zn and Pb had high elemental contribution percentages and were the key pollutants of the area. Although some non-contributing factors had some high loadings for some elements such as F3 for Fe, F7 for V, F8 for Pb and F9 for Mn, the percentages were ignored considering their contribution from the eigen values of Figure 6a was small. This was in line with PCA’s role to reduce dimensionality of large data sets while retaining their associated variability as described by Jolliffe and Cadima57 who advised on the exclusive use of loading factors with the highest eigen value.
Table 5: Percentage contribution of elements in the ten factors.
| F1 | F2 | F3 | F4 | F5 | F6 | F7 | F8 | F9 | F10 | |
| As | 6.91 | 33.25 | 0.30 | 0.00 | 2.30 | 15.24 | 2.95 | 0.88 | 7.66 | 30.49 |
| Co | 7.94 | 17.27 | 1.37 | 17.96 | 0.17 | 19.37 | 23.94 | 8.40 | 0.58 | 2.99 |
| Cr | 3.17 | 26.25 | 0.33 | 28.19 | 16.14 | 4.38 | 8.09 | 5.16 | 2.51 | 5.78 |
| Cu | 5.16 | 0.79 | 23.10 | 28.48 | 37.00 | 0.11 | 1.45 | 1.59 | 2.27 | 0.05 |
| Mn | 15.18 | 8.92 | 1.51 | 0.43 | 0.01 | 7.87 | 0.65 | 15.42 | 48.26 | 1.72 |
| Ni | 16.65 | 3.90 | 0.05 | 1.51 | 0.11 | 20.01 | 1.01 | 3.37 | 22.54 | 30.85 |
| Pb | 16.08 | 3.49 | 3.12 | 0.01 | 2.81 | 10.74 | 1.84 | 58.58 | 0.54 | 2.78 |
| Zn | 11.57 | 2.45 | 10.28 | 4.93 | 34.46 | 2.16 | 8.03 | 5.31 | 3.00 | 17.81 |
| V | 14.87 | 3.62 | 0.33 | 2.80 | 3.82 | 11.47 | 45.86 | 0.87 | 11.37 | 4.99 |
| Fe | 2.44 | 0.06 | 59.62 | 15.69 | 3.17 | 8.65 | 6.16 | 0.40 | 1.28 | 2.52 |
* Values in bold have high % contribution.
Sampling sites L030, L5030 and L50030 had the highest percentage contribution of observations at 24.79%, 11.21% and 18.10%, respectively, which suggests that pollution was concentrated on top soils at 30cm compared to bottom soils at 60cm and 100cm that had lower values. This observation concurs with Kurt’s24 suggestions that pollution of top soils was greater than bottom soils in a heavy metal analysis of soils from Mersin Province of Turkey. The values also allude to the horizontal movement of leachate from sampling sites close the landfills to distant ones to confirm concentration trends of various elements (Figure 2-4). Horizontal movement of leachate was confirmed from 16 disposal sites in Kuwait whereby heavy metals concentrations were high in surface soils collected from areas next to the disposal sites compared to soils at lower depths and farther from the sites.58
Table 6: Percentage contribution of sampling sites in the 10 factors.
| F1 | F2 | F3 | F4 | F5 | F6 | F7 | F8 | F9 | F10 | |
| L030 | 24.79 | 4.89 | 0.00 | 6.38 | 30.76 | 0.22 | 0.98 | 9.90 | 4.82 | 0.16 |
| L060 | 0.02 | 0.12 | 0.80 | 0.58 | 0.49 | 0.00 | 3.83 | 0.50 | 19.06 | 0.78 |
| L0100 | 0.27 | 0.02 | 5.84 | 23.32 | 31.37 | 0.00 | 0.12 | 0.12 | 6.28 | 0.63 |
| L5030 | 11.21 | 0.17 | 16.50 | 2.33 | 3.98 | 0.59 | 3.18 | 25.91 | 2.65 | 1.33 |
| L5060 | 0.08 | 4.08 | 7.98 | 3.07 | 0.70 | 7.46 | 7.02 | 6.11 | 22.14 | 2.81 |
| L50100 | 0.51 | 1.70 | 11.17 | 7.80 | 0.01 | 18.66 | 0.18 | 8.02 | 0.30 | 11.02 |
| L10030 | 1.61 | 6.47 | 0.37 | 5.00 | 1.55 | 5.77 | 15.51 | 0.16 | 1.00 | 4.77 |
| L10060 | 0.66 | 1.20 | 2.43 | 3.31 | 0.26 | 2.64 | 0.33 | 4.77 | 0.72 | 0.13 |
| L100100 | 2.35 | 0.58 | 3.20 | 6.59 | 1.03 | 1.01 | 2.56 | 7.98 | 0.28 | 0.05 |
| L25030 | 1.52 | 7.16 | 11.49 | 10.13 | 0.28 | 4.15 | 3.31 | 6.53 | 6.99 | 0.03 |
| L25060 | 1.33 | 0.17 | 1.21 | 0.05 | 0.00 | 2.91 | 10.29 | 4.89 | 2.24 | 11.14 |
| L250100 | 1.17 | 0.90 | 1.63 | 0.10 | 0.22 | 3.64 | 18.11 | 3.16 | 6.03 | 4.15 |
| L50030 | 18.10 | 12.07 | 6.40 | 0.09 | 8.45 | 19.46 | 1.39 | 3.35 | 1.12 | 2.65 |
| L50060 | 1.29 | 0.01 | 0.01 | 0.98 | 0.01 | 4.09 | 3.41 | 0.56 | 0.24 | 4.26 |
| L500100 | 1.45 | 0.25 | 11.01 | 2.75 | 0.22 | 0.00 | 3.42 | 4.14 | 5.78 | 12.04 |
| West1-30 | 3.72 | 0.24 | 9.44 | 0.39 | 0.01 | 6.42 | 15.73 | 1.07 | 2.06 | 0.04 |
| West1-60 | 1.74 | 1.21 | 0.02 | 0.91 | 1.22 | 3.27 | 0.01 | 1.85 | 1.18 | 4.94 |
| West1-100 | 3.87 | 0.00 | 1.44 | 0.75 | 7.74 | 4.07 | 1.21 | 1.10 | 0.86 | 0.13 |
| West2-30 | 3.84 | 3.11 | 0.35 | 20.89 | 10.08 | 0.62 | 1.81 | 0.28 | 0.46 | 1.11 |
| West2-60 | 1.21 | 0.00 | 2.46 | 0.99 | 0.01 | 0.09 | 0.33 | 2.80 | 1.23 | 3.62 |
| West2-100 | 3.15 | 0.08 | 0.86 | 0.78 | 0.00 | 3.94 | 0.42 | 0.14 | 0.12 | 3.20 |
| East1-30 | 3.60 | 5.34 | 3.48 | 1.68 | 0.18 | 0.27 | 0.40 | 0.00 | 3.55 | 6.53 |
| East1-60 | 1.78 | 0.16 | 0.10 | 0.16 | 0.00 | 1.93 | 0.25 | 3.52 | 6.13 | 3.05 |
| East1-100 | 2.48 | 0.00 | 1.60 | 0.51 | 0.09 | 4.35 | 0.00 | 0.00 | 0.35 | 12.27 |
| Blank30 | 1.17 | 0.00 | 0.22 | 0.01 | 0.14 | 0.03 | 4.99 | 1.62 | 3.96 | 6.42 |
| Blank60 | 3.01 | 0.05 | 0.01 | 0.46 | 0.69 | 1.26 | 0.05 | 1.15 | 0.16 | 2.37 |
| Blank100 | 4.07 | 0.03 | 0.00 | 0.01 | 0.50 | 3.16 | 1.15 | 0.38 | 0.28 | 0.38 |
* Values in bold have high % contribution.
Conclusions
Cr, Cu, Mn, Ni, Co, V, Zn, Fe, As and Pb were identified as pollutants and their levels were beyond permissible WHO and DEA limits especially in top soils. Horizontal and vertical migration of landfill leachate was a contributory factor to soil pollution in the study area. Heavy metal pollution decreased with increasing distance from the landfill and downwards with increasing depths except in Fe. All metals had high concentrations at areas near the landfill such as L0, L50, West 1 and West 2 although these concentrations varied distances away from the landfill. Metals such as Cu, Co, Mn and Ni were highly mobile and their concentrations were high a distance from the landfill while As and Zn were immobile near the landfill. High mobilisation of metals was associated to the facility’s mismanagement history, bioavailability of the metals and their viscosity. Lithology was a contributing factor to Fe pollution although Pearson’s correlation analysis confirmed that anthropogenic-based pollution from leachate had significant pollution contribution for most elements. Municipal solid waste leachate and its migration had negative effects on soil quality in the study area.
Acknowledgements
The researchers are grateful to the University of South Africa for the financial support to complete this paper. Gratitude is paid to the Global Consulting laboratories of Eastern Cape, South Africa for the help offered in soil sampling. Finally the Roundhill landfill management is appreciated for supporting the study.
References
- Moor, C.; Lymberopoulou, T; Dietrich, V. Mikrochim Acta. 2001, 136, 123-128.
- Smith, D. B.; Woodruff, L.G.; O’Leary, R. M.; Cannon, W.F.; Garrett, R. G; JaKilburn, J. E. Appl Geochem. 2009, 24, 1357–68.
- Towett, E.; Shepherd, K.; Cadisch, G. Sci. Total Environ. 2013, 463, 374-388.
- Swift, M. J.; Shepherd, K. D. World Agroforestry Centre: Nairobi, Kenya; 2013.
- Radu, T. J. Hazard. Mater. 2009, 171, 1168-1171.
- Umm-kulthum, A.; Fauziah, S.; Mohamad, S. Int. J. Adv. Agric. Environ. Eng. 2016, 3, 371-374.
- Kodom, K.; Preko, K.; Boamah, D. Soil Sediment Contam. 2012, 21, 1006-1021.
- Cassidy, N. J. J. Contam. Hydrol. 2007, 94, 49–75.
- Waheed, S.; Siddique, N.; Hamid, Q.; Chaudhry, M. M. J. Radioanal. Nucl. Chem. 2010, 285, 723–732.
- Suciu, I.; Cosma, C.; Todica, M.; Bolboaca, S.; Jantschi, L. Int. J. Mol. Sci. 2008, 9(4), 434-453.
- Toribio, M.; Romanya, J. Sci. Total Environ. 2006, 363, 11–21.
- Gautam, P.; Blaha, U.; Appel, E. The Island Archives. 2005, 14, 424–435.
- Shepherd, K. D.; Walsh, M. G. New York, USA: Marcel Dekker Inc; 2004.
- Minasny, B.; Tranter, G.; McBratney, A. B.; Brough, D.; Murphy, B. Geoderma. 2009, 153, 155–62.
- Kamau-Rewe, M.; Rasche, F.; Cobo, J.; Dercon, G.; Shepherd, K.; Cadisch, G. Soil Sci. Soc. Am. J. 2011, 75, 358–60.
- Ahmed, A.; Abdullah, P.; Khalikwood, A.; Hamza, S.; Othman, R. Orient. J. Chem. 2013, 29, 1-9.
- Tshibalo, R. Msc Thesis, Pretoria: University of South Africa; 2017.
- Oni, A.; Hassan, A. Afr. J. Biomed. Res. 2016, 19, 219-227.
- Sakawi, Z.; Mohd, R.; Sharifah, M.; Mohd, F. Res. J. Appl. Sci, Eng. Tech. 2013, 5, 5619-5625.
- Jewaskiewitz, S.; Dookhi, N. Roundhill restoration. Sustainable Landfills. 2017, 16-19.
- Dookhi, N.; Jewskiewitz, S.; Jewaskiewitz, B. Civ. Eng. 2015, 23, 35-41.
- Dörnyei, Z. New York: Oxford University Press; 2007.
- Maadof, S. EPA, Washington DC, USA; 1996.
- Kurt, M. Carpath. J. Earth and Env. Sci. 2018, 13, 47-56.
- Chiroma, T.; Ebewele, R.; Hymore, F. IRJES. 2014, 3, 1-9.
- McKillup, S.; Dyar, M. Cambridge: Cambridge University Press; 2010.
- Mosaferi, M.; Pourakbar, M.; Shakerkhatibi, M.; Fatehifar, E.; Belvasi, M. J. Environ. Health Sci. Eng. 2014, 12, 99-109.
- Bhat, S.A.; Meraj, G.; Yaseen, S.; Pandit, A. K. J. Ecosys. 2014, 18, 1-19.
- Hauke, J.; Kossowski, T. Questiones Geographicae. 2011, 30, 93-97.
- Rebekic, A.; Loncaric, Z.; Petrovic, S.; Maric, S. Poljoprivreda, 2015, 21, 47-54.
- Kumar, M.; Furumai, H.; Kurisu, F.; Kasuga, I. Geoderma. 2013, 211, 8-17.
- Shao, X.; Huang, B.; Zhao, Y.; Sun, W.; Gu, Z.; Qian, W. Ecotox. Environ. Safe. 2014, 104, 1-8.
- Agbenin, J. Nutr. Cycl. Agroecosys. 2003, 66, 259-270.
- Department of Environmental Affairs (DEA). Government Gazette, No. 36447, South Africa; 2013.
- Duressa, T.; Leta, S. Int. J. Sci: Basic Appl. Res. 2015, 21, 352-372.
- Nemati, K.; Bakar, N.; Abas, M.; Sobhanzadeh, E. J. Hazard. Mater. 2011, 192, 402-410.
- Memarianfard, M.; Poshtegal, M. K. Water Resour. Res. 2015, 42, 247-259.
- Ottesen, R.T.; Langedal, M. Survey Norw. Bull. 2001, 438, 63-69.
- Coby, S.C.; Wong, S.C.; Li, X.; Thornton, I. Environ. Pollut. 2006, 142, 1-16.
- Bahaa-Eldin, E.; Yusoff, I.; Rahim, S.; Wan Zuhairi, W.Y.; Abdul Ghan, M. Soil and Sediment Contam. 2008, 17, 449-466.
- Kabala, C.; Singh, B. J. Environ. Qual. 2001, 30, 485-492.
- Tiwari, M., Bajpai, S.; Dewangan, U. IJSRP. 2015. 7, 1-8.
- Norman, N. Pretoriam SA: Struik Nature Publishers; 2013.
- Wuana, R.; Okieimen, F. ISRN. 2011, 1-21.
- Manta, D.; Angelone, M.; Bellanca, A.; Neri, R.; Sprovieri, M. Sci. Total Environ. 2002, 300, 229-243.
- Andersen, M., Ottensen, R. T.; Langedal, M. Geoderma. 2010, 156, 112-118.
- Yang, Z.; Lu, W.; Bao, X.; Yang, Q. J. Geochem. Explor. 2011, 108, 27-38.
- Guo, G.; Wu, F.; Xie, F.; Zhang, R. J. Environ. Sci. 2012, 24, 410-418.
- Aydi, A. Environ. Earth Sci. 2015, 74, 3019-3027.
- Kurt, M. A. PHD thesis, Mersin Üniversitesi, 430; 2010. (in Turkish).
- Yong, R.; Mulligan, C. USA: Lewis Publications; 2004.
- Pujiwati, A.; Nakamura, K.; Watanabe, N.; Komai, T. Earth and Environ. Sci. 2017, 118, 1-8.
- Loska, K.; Wiechula, D. Chemosphere. 2003, 51, 723-733.
- Horak, J.; Hejcman, M. J. Soils Sediments. 2016, 310, 1584-98.
- Laiho, R.; Penttila, T.; Laine, J. Silva Fenn. 2004, 38, 29–41.
- Singh,V.; Agrawal, H.; Joshi, G.; Sudershan, M.; Sinha, A. Appl. Radiat. Isot. 2011, 69, 969-974.
- Jolliffe, I.; Cadima, J. Trans. Royal Soc. A. 2016, 374, 201- 205
- Milad, Z.A. PhD Thesis, Wales: Cardiff University; 2014.

This work is licensed under a Creative Commons Attribution 4.0 International License.
![]()
A New Edition of Web of Science
Journal Impact Factor
2022: 0.5
Five Year: 0.8
Journal is Indexed in

Cabells Whitelist
![]()


