Estimation of Water-Soluble Vitamin B-Complex in Selected Leafy and Non-Leafy Vegetables by HPLC Method
N. H. M. Rubel Mozumder*1 , Most. Jesmin Akhter2, Anwara Akter Khatun1, Mohammad Rokibuzzaman3 and M. Akhtaruzzaman4
1Department of Food Science and Nutrition, Faculty of Engineering, Hajee Mohammad Danesh Science and Technology University, Dinajpur-5200, Bangladesh.
2Department of Food Processing and Preservation, Faculty of Engineering, Hajee Mohammad Danesh Science and Technology University, Dinajpur-5200, Bangladesh.
3Chonbuk National University, Jeonju, 561-756, South Korea.
4Institute of Nutrition and Food Science, University of Dhaka, Dhaka-1000, Bangladesh..
Corresponding Author E-mail: rubel.infs@gmail.com
DOI : http://dx.doi.org/10.13005/ojc/350414
Article Received on : 06-07-2019
Article Accepted on : 12-08-2019
Article Published : 19 Aug 2019
A high performance liquid chromatographic method (HPLC) equipped with photodiode array detector (PDA) has been used to determine the water-soluble vitamin B complex ( B1, B2, B3, and B6) in eleven selected vegetables of Bangladesh. The results showed varied levels of vitamin B-complexes. Precisely, Thankuni leaves showed the highest contents of vitamin B1; 0.19 mg/100 g, and vitamin B2; 0.25 mg/100g. Higher content of vitamin B3 (0.59 mg/100 g) were quantified in Coriander leaves, but absent in Jute leaves. On the other hand, the maximum quantified amount of B6 (0.73 mg/100 g) was detected in Carrot. In contrast, there was no detectable vitamin B6 in Jute, and Mint leaves and Cabbage. The findings of the current study may supplement the current Food Composition Table for Bangladesh (FCTB) by providing nutritional information of vitamin B complex in leafy and non-leafy vegetables which can also be used for calculating the habitual dietary intake and/or nutritional survey purposes.
KEYWORDS:HPLC; Leafy; and Non-Leafy Vegetables; PDA Detector; Vitamin B Complex
Download this article as:| Copy the following to cite this article: Mozumder N. H. M. R, Akhter M. J, Anwara A. K, Rokibuzzaman M, Akhtaruzzaman M. Estimation of Water-Soluble Vitamin B-Complex in Selected Leafy and Non-Leafy Vegetables by HPLC Method. Orient J Chem 2019;35(4). |
| Copy the following to cite this URL: Mozumder N. H. M. R, Akhter M. J, Anwara A. K, Rokibuzzaman M, Akhtaruzzaman M. Estimation of Water-Soluble Vitamin B-Complex in Selected Leafy and Non-Leafy Vegetables by HPLC Method. Orient J Chem 2019;35(4). Available from: https://bit.ly/2Nhb8Zt |
Introduction
Vitamins play a significant role in our health; even though they only make up a small portion of the ingested food.1 Vitamins are classified as fat-soluble vitamins and water-soluble vitamins.2 Water‐soluble vitamins include vitamin B complexes and ascorbic acid such as vitamin C. The vitamin B complexes comprise of thiamine; B1, riboflavin; B2, niacin; B3, pantothenic acid; B5, pyridoxal; B6, folic acid; B9, and cyanocobalamin; B12.3 They play essential roles by providing antioxidant properties, co-enzymatic functions, and other cellular and metabolic mechanisms in the human body.4
Leafy and non-leafy vegetables provide considerable amounts of water-soluble vitamins especially vitamin B complex. Regular intake of leafy and non-leafy vegetable helps the body to keep away the chronic diseases.5 Most of the B vitamins must regularly be replenished since any excess is excreted in the urine.6 In contrast, several health problems and nutritional disorders such as vitamin B deficiency anemia, weakness, appetite loss, depression, numbness and tingling in the arms and legs, muscle cramps respiratory infections, hair loss, eczema, poor growth in children and congenital disabilities are accompanied due to deficiency of B vitamins. Many researchers are studying the relationships between vitamin B intake and risk of developing certain diseases because of the importance of vitamin B complexes in human health.7
The concern of B vitamins for the welfare of human health has been increased over the past decades. Their increasing awareness has driven the today’s global health industry and pharmaceuticals market to produce a lot of vitamin B supplements, and fortified vitamin B enriched nutrients with particular concentration on their accurate assays and analytical methods.3,8 The current knowledge for the analytical assays of B vitamins is based on spectroscopic, chromatographic, chemical, or microbiological techniques with various extraction procedures.9 Among the analytical methods, high performance liquid chromatographic method (HPLC) has been identified as a promising method for its accuracy, high sensitivity and added advantages for using the different detector.3,9,10
Although high-performance liquid chromatography (HPLC) has been identified as a reliable chromatographic application to assess the vitamin B complexes in plant food-stuffs,3 efforts are continuing in search of accurate and reliable HPLC procedures especially when the analysis is performed in connection with a nutritional survey or establishing food composition tables11. According to the type of food matrices and number of specific factors, estimation of the water-soluble vitamin B complexes is often a challenging and tedious task. Furthermore, apart from the matrix effects, the signal for each analyte of interest should be free from significant interferences, and of course, the detector used in HPLC method should be selective for the analyses of interest.12
Previously, we investigated the vitamin B profiles in indigenous leafy vegetables of Bangladesh using HPLC equipped with UV detector.13 The study was intended to report the water soluble vitamin B contents (B2, B3, B5 and B6) in five commnly consumed vegetables that were already absent from any published literature. As a continuation of research and given preferences for non-leafy vegetables along with others selected leafy vegetables, the current study was undertaken to determine the vitamin B-complex especially B1, B2, B3, and B6 using high-performance liquid chromatography (HPLC) with PDA detector. The accuracy and reliability of the HPLC method may provide valuable nutritional information of vitamin B complex in the food matrices of leafy and non-leafy vegetables and also supplement the current Food Composition Table for Bangladesh (FCTB) to calculate the habitual dietary intake and/or nutritional survey purposes.
Materials and Methods
Origin of Samples
The samples such as Jute leaves (Corchorus olitorious), Coriander leaves (Coriandrum sativum), Mint leaves (Mentha arvensis), Thankuni leaves (Centella asiatica), Cabbage (Brassica oleracea), Carrot (Daucus carota subsp. sativus), Ladies finger (Abelmoschus esculentus), Green chilies (Capsicum frutescens), Green tomato (Lycopersicon esculentum) and Ripe tomato (Lycopersicon esculentum) were collected from different local markets of Dhaka city, Bangladesh. After collection, the samples were immediately sent to the Institute of Nutrition and Food Science, Dhaka University where the analyses were performed.
Reagents and Solvents
HPLC grade acetonitrile and sodium-1-octanesulfonate were purchased from Merck, Germany. Orthophosphoric acid and glacial acetic acid were purchased from BDH, India. All the vitamin B (B1, B2, B3, and B6) standards were purchased from Sigma-Aldrich, Germany. Millipore direct system was used for distilled and deionized water.
HPLC Instrumentation
A high-performance Liquid Chromatographic system (Shimadzu-UFLC Prominence) equipped with an autosampler (Model-SIL 20AC HT) and PDA detector was used for the vitamin B analysis. The HPLC data were compiled and recorded using the LC-solutions software.
Preparation of Extraction Solutions
For preparing an extraction solution, precisely 50 ml of acetonitrile was mixed with 10 mL of glacial acetic acid, and the final volume was made up to 1000 mL with double distilled water.
Preparation of Buffer and Mobile Phase
For buffer preparation, 0.173 g of sodium 1- Octanesulfonate and 15.603 g of Sodium dehydrogenate phosphate was dissolved in double distilled water, and the volume was finally made up to 1000 mL with double distilled water. The pH was adjusted to 2.2 with orthosiphoric acid. To prepare the mobile phase, the buffer was filtered through a 0.45 µ membrane filter and degassed by using helium gas.
Preparation of Stock Standards Solution
The stock solution for standard vitamin B1 (thiamine HCl) was prepared by dissolving 26.7 mg of thiamine hydrochloride in 25 mL of double distilled water. In the case of vitamin B2, the stock solution for standard vitamin B2 (riboflavin) was prepared by dissolving 6.9 mg of riboflavin in 100 mL of extraction solution. For vitamin B3 (nicotinamide), the standard stock solution was prepared by dissolving 41.5 mg of nicotinamide in 25 mL of double distilled water. The standard stock solution for vitamin B6 (pyridoxine) was prepared by dissolving 20.8 mg of pyridoxine hydrochloride in 25 mL of double distilled water.
Preparation of Samples for Vitamin B Analysis
The procedure for sample? preparation was followed as described by published literature13. Briefly, the exact amount of 10 g samples were weighed and homogenized. After that, the samples were transferred into a conical flask where 25 mL of extraction solution was already added. A shaking water bath operating at an ambient temperature of 70 °C for 40 min was used to sonicate the solution. After sonication, the sample was cooled down and finally filtered to make the volume of 50 mL with extraction solution. The extraction solution was again filtered with filter trips (0.45 µm) and 20 µl aliquots solution was injected into the HPLC by using auto-sampler.
HPLC Conditions
For the separation of B complex vitamins, an analytical reversed-phase C-18 column (STR ODS-M, 150 mm × 4.6 mm I.D., 5 µm, Shimadzu Corporation, Japan) was used. The mobile phase consists with a mixture of 100 mM sodium-phosphate buffer (pH 2.2) containing 0.8 mM sodium-1-octanesulfonate and acetonitrile in a ratio of 9:1 (v/v) at 40°C temperature. The flow rate was kept constant by 0.8 mL/min with a PDA detector in which the absorption rate was 270 nm. The calculations of B vitamins were determined from the peak area of respective chromatogram by using the following equation.
B vitamins (mg/100 g) = Concentration of standard X (Area of Sample/Area of Standard) X Dilution factor
Results and Discussion
HPLC Chromatographic Method
In this study, water-soluble B complex vitamins (B1, B2, B3, and B6) from some leafy and non-leafy vegetables commonly available in Bangladesh was carried out using an HPLC method equipped with PDA detector as a continuation from our previous work already published in elsewhere.13 Though the HPLC method is one of the accurate and established techniques for the estimation of B vitamins, the densitometric analysis performed by the PDA detector in the current study could be advantageous for the matric specific vegetables. Further, the solvent system used in the study produced a sharp and compact peak of the B complex vitamins using the validated RP-HPLC method with slight modification.14 The mobile phase of the solvent system consisted of a mixture of 100 mM sodium-phosphate buffer (pH 2.2) containing 0.8 mM sodium-1-octanesulfonate and acetonitrile in the ratio of 9:1 (v/v) at 40°C temperature producing a constant flow rate; 0.8 mL/min with the C-18 column and elution capacity of 270 nm absorption mode by using PDA detector. The retention times of B vitamins are presented in Table 1. Under the reversed-phase chromatographic conditions, the representative chromatograms of standards of vitamin B complexes (B1, B2, B3, and B6) along with 3D diagram are illustrated in Fig. 1. Fig. 2 shows the individual chromatograms and corresponding 3D diagram of vitamins B1, B2, B3, and B6 respectively at a wavelength of 270 nm. Furthermore, the chromatograms of different vegetable samples at a wavelength of 270 nm for PDA detector also presented in Fig. 3. For all individual vitamins, the method was found to be linear for the concentration range with a good correlation coefficient that already published in elsewhere.13
Table 1: Retention times of B vitamins standard at 270 nm.
| Name | Injection volume mL | Concentration (µg/mL) | Retention time Rt (minutes) |
| Vitamin B1 | 30 | 60.02 | 4.11 |
| Vitamin B2 | 30 | 35.19 | 8.03 |
| Vitamin B3 | 30 | 10.00 | 3.48 |
| Vitamin B6 | 30 | 5.90 | 3.68 |
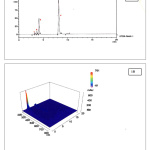 |
Figure 1: Chromatograms of standard B1, B2, B3 and B6 (1A) and 3D diagram of the HPLC chromatograms (1B). |
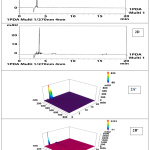 |
Figure 2: Chromatograms of individual B vitamin standards (2A- B1, 2B-B2, 2C-B3 and 2D-B6). |
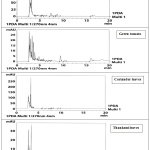 |
Figure 3: Chromatograms of different vegetables samples. |
Vitamin B1 (Thiamin)
The contents of vitamin B1 are presented in Table 2. Vitamin B1 ranged from 0.00 to 0.19 mg/100 g of edible portion of vegetables in which the highest amount (0.19 mg/100g) of vitamin B1 was estimated in Thankuni leaves (Centrella asiatica). The finding was higher than the value (0.09 mg/100g) as presented in Food Composition Table for Bangladesh (FCTB)15. The higher contents of vitamin B1 observed under the current study might be the reason for different extraction techniques used for sample preparation though reversed-phase HPLC column was used in both studies. Besides, method validation with or without enzymatic steps could be another considerable point for extraction parameters when considering the nutritional standpoint of B vitamins for nutrition survey and derive a food composition table of daily recommended intake for the general population. The second highest content of B1 was observed in ripe tomato which was 0.14 mg/100g. In contrast, carrot showed the least amount of B1; 0.08 mg/100g which was doubled as the contents of carrot as provided in FCTB. However, no vitamin B1 was detected in jute leaves as consistent with the result as showed by FCTB.
Table 2: Vitamin B1 contents in analysed samples.
| Bengali Name | English Name | Scientific Name | Mean contents of B1 (mg/100 g of edible portion) | |
| Pat sak | Jute Leaves | Corchorus olitorius | 0.00 | |
| Thankuni pata | Thankuni leaves | Centella asiatica | 0.19 | |
| Gajor | Carrot | Daucus carota subsp. sativus | 0.08 | |
| Dheros | Ladies finger/okra | Abelmoschus esculentum | 0.10 | |
| Paka Tomato | Ripe tomato | Lycppersicon esculentum | 0.14 | |
Vitamin B2 (Riboflavin)
Vitamin B2 plays an essential role in cellular functions and nutrient metabolism. Although vegetables as a source Vitamin B2 is not as rich as compared to milk and dairy products, people from low resource countries like Bangladesh and also vegetarians with access to a diversity of leafy and non-leafy vegetables can avoid the deficiency vitamin B2.16 As shown in the Table 3, the highest amount of vitamin B2; 0.25 mg/100 g was estimated in Thankuni leaves (Centrella asiatica) followed by the second most abundant amount of 0.10 mg/100 g in Carrot and Green Chilies respectively. The Food Composition Table for Bangladesh (FCTB)15 quantified 0.10 mg/100 g B2 in Thankuni leaves which were lower than the current study. The variations of B2 contents might be related to several factors. For example, analytical artifacts of vitamin B2 determination have been identified in food samples in which sensitivity to UV light is an outmost important.10
Table 3: Vitamin B2 content in analyzed samples.
| Bengali Name | English Name | Scientific Name | Mean contents of B2 (mg/100 g of edible portion) |
| Pudina pata | Mint leaves | Mentha arvensis | 0.06 |
| Thankuni pata | Thankuni leaves | Centella siatica | 0.25 |
| Badhakopi | Cabbage | Brassica oleracea | 0.00 |
| Gajor | Carrot | Daucus carota subsp. sativus | 0.10 |
| Dheros | Ladies finger/okra | Abelmoschus esculentum | 0.08 |
| Kachamorich | Green chilies | Capsicum frutescens | 0.10 |
Vitamin B3 (Niacin)
The functions of vitamin B3 in human health have already been reported.18 Thus regular consumption of leafy and non-leafy vegetables may supply adequate amounts of B3 necessary to maintain these healthy body functions. The contents of vitamin B3 analyzed by HPLC method are presented in Table 4. The highest amount of vitamin B3 (0.59 mg/100 g) was estimated in Coriander leaves which were lower than the value (1.1 mg/100 g) as reported by Food Composition Table for Bangladesh (FCTB).15 In contrast, the lowest amount was observed in Carrot and Mint leaves; 0.04 mg/100 and 0.04 mg/100g respectively. However, no quantified amounts of niacin were observed in a case for Jute leaves and Ladies finger. The choice of extraction applied in the method could be the reason for the variation of vitamin B3. However, enormous HPLC published procedures using different PDA, UV or fluorescence detectors reported varied levels of B3 contents in vegetables and other foodstuffs. Notably, the extraction techniques should be carefully considered if the data is to be used for nutritional intake purposes 9. Besides, either the free form of B3 in foodstuffs as nicotinic acid and nicotinic acid amide or exists in bound forms on food matrices are technological issues.11
Table 4: Vitamin B3 content in analyzed samples.
| Bengali Name | English Name | Scientific Name | Mean contents of B3 (mg/100 g of edible portion) |
| Pat sak | Jute Leaves | Corchorus olitorius | 0.00 |
| Dhonepata | Coriander Leaves | Coriandrum sativum | 0.59 |
| Pudina pata | Mint leaves | Mentha arvensis | 0.04 |
| Thankuni pata | Thankuni leaves | Centella asiatica | 0.13 |
| Badhakopi | Cabbage | Brassica oleracea | 0.08 |
| Gajor | Carrot | Daucus carota subsp. sativus | 0.04 |
| Dheros | Ladies finger | Abelmoschus esculentum | 0.00 |
| Kachamorich | Green chiles | Capsicum frutescens | 0.39 |
| Kacha Tomato | Green Tomato | Lycppersicon esculentum | 0.16 |
| Paka Tomato | Ripe tomato | Lycppersicon esculentum | 0.05 |
Vitamin B6 (Pyridoxine)
Dietary vitamin B6 acts as a coenzyme in the folate metabolism pathway and may have anti-carcinogenic effects such as prevention of colorectal cancer.20 High consumption of vegetables and citrus fruit may improve folate status which intern may contribute to the prevention of cardiovascular diseases.21 The Table. 5 shows the contents of Vitamin B6 of analyzed samples where the highest amount of vitamin B6; 0.73 mg/100 g was estimated in Carrot followed by second highest contents in Thankuni leaves (Centrella asiatica) which was 0.13 mg/100 g of edible portion. The Food Composition Table for Bangladesh (FCTB)4 only reported the vitamin B6 which was 0.133 mg/100 g in Carrot, but no reported values for Thankuni leaves. The fluctuations of vitamin B6 contents in vegetables may be due to the different methods of extraction when applied to the same food matrix of vegetable and also vitamin B6 determination procedures by HPLC and microbiological processes. Research conducted on different food matrix including vegetables reported that the highest values of total vitamin B6 in food were achieved using 0.1 M HCl or 0.1 M sulphuric acid for autoclaving followed by b-glucosidase /acid phosphatase hydrolysis.22
Table 5: Vitamin B6 content in analyzed samples.
| Bengali Name | English Name | Scientific Name | Mean contents of B6 (mg/100 g of edible portion) |
| Pat sak | Jute Leaves | Corchorus olitorius | 0.00 |
| Pudina pata | Mint leaves | Mentha arvensis | 0.00 |
| Thankuni pata | Thankuni leaves | Centella asiatica | 0.13 |
| Badhakopi | Cabbage | Brassica oleracea | 0.00 |
| Gajor | Carrot | Daucus carota subsp. sativus | 0.73 |
Conclusion
The present study quantified the water-soluble vitamin B complex namely B1, B2, B3, and B6 in some selected leafy and non-leafy vegetables using HPLC method equipped with reversed-phase photodiode array detector (PDA). Though many factors may affect the simultaneous estimation of water-soluble vitamin B complex in different food matrices, the method used in the current study is already validated13 which is accurate enough to separate the compounds simultaneously. Apart from the methodological advantages, the result of vitamin B analysis in some selected leafy and non-leafy vegetables under current study will provide crucial supporting information which is believed to be absent in the current FCTB of Bangladesh. Precisely, the Food Composition Table for Bangladesh (FCTB)4 has been published to providing the nutritional information of Bangladeshi foods commonly consumed by the general population. However, the published FCTB selected some key foods and nutrients for establishing the database: lacking information to specific foods especially vegetables of different varieties and cultivars are prevalent. Since the demand for global and country-specific food composition database has been increasing over the past decades, the data derived from the current investigation serves as an important means to calculate dietary intake of B vitamins applicable during habitual food intake or nutritional survey or assessment.
Acknowledgements
We acknowledged the Institute of Nutrition and Food Science, and Centre for Advanced Research in Sciences, University of Dhaka, Bangladesh for analytical support and assistance.
References
- Kumli, K. F. J. Chem. Educ.1989, 66, 173-174.
- Leaf, A.; Lansdowne, Z. World Rev. Nutr. Diet. 2014; 110, 152-166.
- Abano, E.; Dadzie, R. G. Croat. J. Food Sci. Technol.2014, 6, 116-123.
- Fennema, O. R.; Tannenbaum, S. R. In: Food Chemistry. Fennema, O.R., Ed., Marcel Dekker, Inc., New York.2013, 5, 75–115.
- Liu, R. H. Adv. Nutr.2013, 4, 384S-392S.
- Zempleni, J.; Suttie, J. W.; Gregory III, J. F.; Stover, P. J. Handbook of vitamins, Boca Raton (FL): CRC Press. 2007, 4, 87-253.
- Finglas, P. M. J. Sci. Food Agric. 1984,35, 1347–1356.
- Arya, S.; Mahajan, M.; Jain, P. Anal. Chim. Acta.2000, 417, 1-14.
- Zafra-Gómez, A.; Garballo, A.; Morales, J. C.; García-Ayuso, L. E. J. Agric. Food Chem.2006, 54, 4531-4536
- Van Wyk, J.; Dolley, L.; Mshicileli, N. Nov. Sci. Publ.2014, 23-45
- Brubacher, D. Elsevier Appl. Sci. Publ. 2012, 119-128
- Lešková, E.; Kubíková, J.; Kováčiková, E.; Košická, M.; Porubská, J.; Holčíková, K. J Food Compos. Anal. 2006, 19, 252-276
- Hasan, M. N.; Akhtaruzzaman, M.; Sultan, M. Z. J.Anal. Sci. Meth. Inst.2013, 3, 24-29
- Paredes, E.; Prats, M.; Maestre, S.; Todolí. J. Food chem.2008, 111, 469-475
- Shaheen, N.; Rahim, A.; Mohiduzzaman, M.; Banu, C.; Bari, L.; Tukun, A.; Mannan, M.; Bhattacharjee, L.; Stadlmayr, B. Final Research. Result.2013, 187.
- Powers, H. J. Am. J. Clin. Nutr. 2003, 77, 1352-1360.
- Kamat, J.; Devasagayam, T. Redx. Rept.1999, 4, 179-184.
- Sauve, A. A. J. Pharmacol. Exp. Ther.2008, 324, 883-893.
- Brubacher, G.; Müller-Mulot, W.; Southgate, D. A.T. Springer Nethl. 1985, 119-130.
- Theodoratou, E.; Farrington, S. M.; Tenesa, A.; McNeill, G.; Cetnarskyj, R.; Barnetson, R. A.; Porteous, M. E.; Dunlop, M. G.; Campbell, H. Cancer Epidemiol. Biomark. Prev. 2008, 17, 171-182.
- Brouwer, I. A.; van Dusseldorp, M.; West, C. E.; Meyboom, S.; Thomas, C. M. G.; Duran, M.; van het Hof, K. H.; Eskes, T. K. A. B.; Hautvast, J. G. A. J.; Steegers-Theunissen, R. g. P. M. J. Nutr.1999. 129, 1135-1139.
- Bognår, A.; Ollilainen, V. Eur. Food Res. Technol. Forschung. A.1997, 204, 327-335.

This work is licensed under a Creative Commons Attribution 4.0 International License.
![]()
A New Edition of Web of Science
Journal Impact Factor
2022: 0.5
Five Year: 0.8
Journal is Indexed in

Cabells Whitelist
![]()


