Wavelength Dispersive XRF Study of Heavy Elements in Soil in Cancer Hit Villages of Malwa Region of Punjab, India
Kirandeep Kaur*1,2 , Manmohan Singh3 and H. S. Sahota4
1Department of Applied Sciences, Punjab Technical University, Kapurthala - 144601, India.
2Department of Physics, SBBSIET, Khiala, Padhiana, Jalandhar - 144030, India.
3Department of Physics, Kanya Maha Vidyalaya, Jalandhar-144001, Punjab, India.
4Department of Applied sciences, Dean Research and Development, Asra College of Engineering and Technology, Bhawanigarh-148026, Punjab, India.
Corresponding Author E-mail: kirandeepkaur_gill@yahoo.co.in
DOI : http://dx.doi.org/10.13005/ojc/350317
Download this article as:
![]()
Heavy metals in the soil of 13 villages of Bathinda district, Punjab, India, were measured using wavelength dispersion X-ray fluorescence technique (WDXRF). 29 elements for which these samples were analyzed are U, Th , 40K, Pb, La, Ba, Cs, Ce,, Sn, Sb, As, Cr, Zn, Cu, Co, Sr, Zr, Sc, V, Ni, Rb, Mo,Ga, Nb, Y, Fe2O3, CaO, MnO and TiO2 . Radioactive substances like U and Th are quite low. Alkaline elements like Ca, Ba, Sr are quite high and may be acting as catalysts to low level radioactive elements. As, Fe, Co, Ni, Zr, Cr, Zn too are probably due to proximity of a thermal power plant at Bathinda and use of pesticides and fungicides for plantation.
KEYWORDS:
Catalysts; Heavy Metals; Radioactive; Soil; WDXRF
Introduction
During the last 10-15 years, many reports appeared in the media regarding high radioactivity in the soil and water of Malwa region. Many researchers undertook measurements in water and soil to determine the quantity of uranium, thorium and potassium.1-3 A good correlation was obtained between uranium concentration in soil and indoor radon in dwellings by Mehra et. Al.1 Work on soil samples from Malwa region was also reported by Mehra et. Al.2 Uranium, thorium and K-40 content were found within safety limits. Recently radioactive content in 498 water samples from the region reported by Bajwa et. Al.3 338 out of 498 samples had uranium concentration higher than recommended safe limit of 0.03 ppm while 216 samples exceeded the threshold of 0.06 ppm recommended by AERB, DAE, India.5 Hearing a public interest petition, filed by Brijinder Singh Loomba, the Punjab and Haryana High Court Chandigarh assigned the job of measuring radioactivity of Malwa region to BARC, Bombay.6 The petition was filed after a UK- based clinical toxicologist Carin Smit came out with a startling revelation that traces of uranium and other heavy metals were found in the hair samples of children and adults in Faridkot district of Punjab, which has no uranium mines. The high concentration of radioactive material was quite baffling for scientists and environmentalists. The BARC report claimed that the high salinity of water in the Malwa region may be acting as a catalyst for uranium toxicity. Otherwise they did not find any higher amounts of uranium or thorium in Malwa region. Still many reports are appearing in the media regarding cases of cancer in the region. In view of all this we have decided to study the metal content in the soils of Talwandi Sabo subdivision of Bathinda District using WDXRF technique to find whether heavy elements or other toxic elements are responsible for any cancer cases.
Soils and sediments have a complex composition and their multi-element chemical composition is of interest in several fields, mostly in geochemical surveys for economical and environmental applications.7 Abnormal occurrences of heavy elements in rocks and soils and in monazite sands have been identified in several regions of the world. The most important sources of heavy metals in the environment are the anthropogenic activities such as mining, smelting procedures, steel and iron industry, chemical industry, traffic, agriculture as well as domestic activities.8-10 The heavy metals from these sources are dispersed in the environment and they contaminate soil, water and air. Directly or indirectly through plants, water and food they get into the human and animal bodies.11 The presence of heavy metals in soil can affect the quality of food, groundwater, micro-organism activity and plant growth etc.12-14 Evaluation of the threat of accumulation of toxic metals in soils is difficult and depends upon many factors. The availability of these metals to crops can be explained by knowing their distribution in the soil profile and the chemical forms in which they occur. Several metals, such as As, Pb, U, Th, Cd, Cu etc. accumulate in the surface soil horizon due to their low mobility and strong association with organic matter. In this current work the pollutants which found in high amount are Co, CaO, Pb, As, Ni, Y, Rb and Zr. These are generally found in cancerous tissues and responsible for cancer related health issues. The aim of the present study is to find out the concentration of heavy elements in the soils of cancer hit villages of Malwa region of Punjab State.
Geography of Selected Area
Bathinda district is situated in the northwestern region of India and is a part of the Indo-Gang tic alluvial plains. The exact cartographic co-ordinates of Bathinda are 30.20°N 74.95°E with an average elevation of 660 ft (201 meters). The study area of 13 villages of Talwandi Sabo is 30km from the head quarters of the district towards South East (Figure 1). Its climate corresponds to high variation between summer and winter temperatures namely 450C to 150C. Average annual rainfall of Bathinda is in the range of 20 mm to 40 mm.
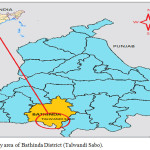 |
Figure 1: Study area of Bathinda District (Talwandi Sabo). |
Soil sample Characteristics
To get the lar0ge variations, the soil samples of different soil types were selected. Most of the soils in the study area are dry, contain stones and pebbles.
Sample Collection and Methodology
Soil samples were collected from 39 locations from various villages selected with 3 samples from each village on random basis. Each sample was taken from a depth of 70-80 cm at some selected points within the study area. In order to cover a large area and to observe a significant local spatial variation in terrestrial radioactivity, sampling points were at a minimum distance of 2 km from each other. In order to get uniform and representative samples, they were dried, sieved to remove stones, pebbles grass roots and straws and then crushed to pass through a 150 micron mesh sieve to homogenize the contents. Then they were packed in plastic bags, which were well sealed. The weight of the soil sample in each bag was kept constant on 20g. All the 39 samples were analyzed to detect the elements of interest using wavelength dispersion X-ray florescence in SAIF, Panjab University Chandigarh. A diagram of a WD system is shown in Figure 2.
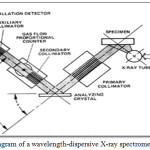 |
Figure 2: Schematic diagram of a wavelength-dispersive X-ray spectrometer. |
This instrument operates according to the principle of Bragg diffraction of a collimated X-ray beam. A detector is angularly scanned relative to the analyzing crystal and registers the spectrum. A great advantage of XRF techniques compared to wet chemical procedures is that the multi-elemental analysis can be directly carried out on solid samples. This avoids the tedious and laborious wet digestion steps and the possible analyte losses and sample contamination as well as a considerable decrease in analysis time. The higher detection limits compared to spectroscopic techniques, the precision and accuracy obtained educing XRF methods are good enough for various environmental studies purposes.15 Additionally, it relates to non-destructive analytical techniques, i.e. the techniques which do not damage the samples under study. It enables us for the simultaneous determination of about 40 elements that makes it one of the most universal and appropriate analytic technique. Major and many trace elements can be determined with very good precision and accuracy.7 In the present study WD-XRF (wavelength dispersive x-ray fluorescence) Model: S8 TIGER, made of Bruker, Germany, has been used for the soil sample analysis. Soil sample and binder were grinded together to make homogenized fine powder so that particle size became less than 50 µm. Sample quantity was taken as 9 grams. The binder tablet amount was 2.7 grams, which made the total weight equal to 11.7 grams. A pellet was made of 10 gm. of total sample (11.7gms) using hydraulic press at pressure of 15 tons. The soil sample pellet with diameter 34mm and thickness 4mm was ready for analyses. Each pellet of different soil sample was processed and analyzed for approximately 37 minutes and a variable range of 29 elements were detected with different concentration levels as shown in Table 1.
Results and Discussion
Table 1 shows the concentration of 29 elements detected in 39 soil samples that were collected from 13 villages of Talwandi Sabo of Bathinda District. From each village 3 samples were collected. Samples 1,2,3 were from Natt village. Similarly, (4,5,6 (Burj Sema)), (7,8,9 (Chatewala)), (10,11,12 (Kaureana)), (13,14,15 (Mirjeana)), (16,17,18 (Manuana)), (19,20,21 (Gehlewala)), (22,23,24 (MaurChart)), (25,26,27 (Burj)), (28,29,30 (Shekhpura)), (31,32,33, (Jogewala)), (34,35,36 (Gatwali)), (37,38,39 (Ram Nagar)) as shown in Table 1. Table 2 summarizes their maximum and minimum values. Radioactive elements like U, Th and 40K have 2-6, 11-18, and 40 – 785 ppm ranges respectively. Some major elements were also detected like CaO, Fe2O3, TiO2, MnO are having limits 9773-132462, 24300-56700, 4100-7300 and 400-800 ppm respectively. Among the major elements CaO has maximum variation than others. Heavy metals like Pb, Cs, Ce, Ba, Sn, Sb and La are found in variable ranges 25-32, 0-13, 78- 116, 349-542, 0-7, 0-6 and 17-41ppm respectively. Toxic elements like As, Cu, Cr, Co, Ni were found in variable ranges 33-64, 11-30, 71-154, 72-291 and 25-95 ppm respectively. Other elements Zn, Sr, Zr, Sc, V, Rb, Ga Nb, Y and Mo were also found in different concentration of 38-310, 125-408, 222-363, 4-14, 41-85, 97-264, 13-22, 10-18, 26-37 and 0-2 ppm respectively.
Table 1: Measured values (in ppm) of 16 elements in soil samples of 13 villages Bathinda District using WDXRF.
|
Sample No. |
U |
Th |
K |
CaO |
As |
Pb |
Cr |
Cu |
Cs |
Co |
Zn |
Sr |
Ce |
Zr |
Sc |
V |
|
1 |
3 |
15 |
72.5 |
17818 |
33 |
28 |
121 |
21 |
9 |
76 |
63 |
143 |
88 |
290 |
13 |
82 |
|
2 |
3 |
15 |
235 |
12412 |
33 |
27 |
116 |
24 |
13 |
81 |
62 |
146 |
93 |
275 |
14 |
82 |
|
3 |
4 |
16 |
185 |
12683 |
40 |
27 |
81 |
21 |
9 |
122 |
64 |
136 |
99 |
292 |
9 |
80 |
|
4 |
3 |
12 |
90 |
14558 |
37 |
25 |
124 |
16 |
8 |
108 |
44 |
132 |
87 |
280 |
7 |
58 |
|
5 |
4 |
15 |
123 |
10985 |
36 |
28 |
117 |
23 |
9 |
72 |
62 |
155 |
93 |
263 |
11 |
82 |
|
6 |
2 |
15 |
268 |
24698 |
36 |
26 |
137 |
24 |
10 |
158 |
63 |
156 |
91 |
292 |
11 |
79 |
|
7 |
5 |
15 |
180 |
39515 |
48 |
26 |
124 |
19 |
10 |
206 |
59 |
151 |
105 |
285 |
10 |
72 |
|
8 |
4 |
14 |
130 |
65290 |
37 |
25 |
71 |
23 |
11 |
114 |
56 |
183 |
88 |
272 |
11 |
75 |
|
9 |
3 |
15 |
120 |
24952 |
41 |
27 |
142 |
18 |
7 |
174 |
53 |
142 |
105 |
300 |
11 |
74 |
|
10 |
3 |
15 |
123 |
9773 |
58 |
27 |
119 |
19 |
9 |
249 |
57 |
140 |
116 |
306 |
8 |
67 |
|
11 |
4 |
16 |
133 |
23745 |
54 |
27 |
101 |
20 |
6 |
258 |
51 |
195 |
111 |
334 |
5 |
59 |
|
12 |
4 |
13 |
68 |
132462 |
46 |
26 |
109 |
20 |
4 |
248 |
47 |
264 |
96 |
268 |
7 |
66 |
|
13 |
4 |
17 |
130 |
16924 |
52 |
31 |
106 |
22 |
12 |
233 |
68 |
170 |
111 |
321 |
8 |
72 |
|
14 |
6 |
14 |
83 |
51988 |
44 |
25 |
129 |
23 |
8 |
195 |
60 |
198 |
105 |
282 |
11 |
79 |
|
15 |
3 |
15 |
188 |
14458 |
52 |
28 |
104 |
18 |
4 |
268 |
57 |
144 |
97 |
300 |
5 |
63 |
|
16 |
4 |
12 |
85 |
91888 |
43 |
25 |
99 |
17 |
9 |
194 |
44 |
408 |
96 |
280 |
8 |
60 |
|
17 |
5 |
18 |
170 |
10323 |
45 |
32 |
124 |
30 |
8 |
213 |
76 |
153 |
110 |
310 |
11 |
85 |
|
18 |
2 |
11 |
173 |
16553 |
57 |
25 |
83 |
11 |
2 |
267 |
38 |
125 |
105 |
276 |
4 |
41 |
|
19 |
4 |
16 |
68 |
12493 |
53 |
28 |
114 |
20 |
3 |
242 |
62 |
138 |
113 |
304 |
9 |
77 |
|
20 |
4 |
16 |
85 |
39160 |
39 |
27 |
79 |
20 |
8 |
119 |
56 |
164 |
99 |
287 |
10 |
79 |
|
21 |
3 |
17 |
58 |
19385 |
41 |
27 |
139 |
23 |
8 |
167 |
59 |
146 |
106 |
318 |
12 |
79 |
|
22 |
3 |
13 |
40 |
63789 |
43 |
26 |
139 |
22 |
8 |
193 |
53 |
172 |
98 |
253 |
8 |
76 |
|
23 |
4 |
16 |
110 |
17266 |
53 |
29 |
106 |
17 |
8 |
260 |
55 |
185 |
97 |
308 |
7 |
65 |
|
24 |
4 |
15 |
600 |
101429 |
48 |
28 |
89 |
24 |
5 |
182 |
55 |
361 |
99 |
238 |
5 |
69 |
|
25 |
3 |
14 |
63 |
36366 |
38 |
26 |
154 |
20 |
10 |
147 |
58 |
158 |
90 |
269 |
11 |
79 |
|
26 |
2 |
13 |
103 |
117365 |
44 |
25 |
115 |
18 |
1 |
273 |
51 |
238 |
91 |
245 |
9 |
79 |
|
27 |
2 |
14 |
490 |
16143 |
54 |
23 |
117 |
15 |
_ |
276 |
39 |
146 |
108 |
314 |
7 |
52 |
|
28 |
4 |
14 |
50 |
58223 |
38 |
27 |
79 |
21 |
9 |
119 |
56 |
223 |
89 |
270 |
11 |
79 |
|
29 |
2 |
15 |
213 |
20130 |
44 |
26 |
74 |
19 |
4 |
151 |
52 |
164 |
103 |
316 |
9 |
67 |
|
30 |
3 |
15 |
238 |
42149 |
50 |
27 |
112 |
27 |
9 |
211 |
66 |
225 |
110 |
270 |
9 |
77 |
|
31 |
5 |
16 |
245 |
56111 |
48 |
30 |
109 |
25 |
4 |
224 |
57 |
205 |
103 |
306 |
11 |
75 |
|
32 |
3 |
18 |
785 |
14822 |
58 |
30 |
99 |
20 |
4 |
291 |
52 |
151 |
113 |
368 |
8 |
61 |
|
33 |
2 |
13 |
120 |
59118 |
50 |
24 |
118 |
18 |
9 |
235 |
47 |
231 |
108 |
286 |
7 |
62 |
|
34 |
2 |
12 |
428 |
127048 |
34 |
26 |
135 |
22 |
6 |
109 |
49 |
217 |
78 |
222 |
7 |
73 |
|
35 |
3 |
11 |
143 |
37860 |
56 |
26 |
80 |
12 |
3 |
291 |
47 |
218 |
91 |
268 |
5 |
51 |
|
36 |
4 |
13 |
343 |
94903 |
43 |
26 |
104 |
19 |
7 |
204 |
45 |
228 |
85 |
285 |
9 |
64 |
|
37 |
4 |
16 |
255 |
23361 |
64 |
29 |
88 |
20 |
11 |
222 |
310 |
155 |
115 |
310 |
8 |
75 |
|
38 |
3 |
15 |
130 |
25110 |
36 |
25 |
125 |
17 |
10 |
84 |
55 |
142 |
90 |
299 |
10 |
74 |
|
39 |
4 |
16 |
70 |
12570 |
34 |
27 |
119 |
20 |
9 |
78 |
61 |
137 |
93 |
289 |
11 |
79 |
Table 1: (Continued) Measured values (in ppm) of 13 elements in soil samples of 13 villages Bathinda District using WDXRF (ND-Not Detected).
|
Sample No. |
Ni | Fe2O3 | Ba | Rb | Sn | Sb | Mo | TiO2 | MnO | Ga | Nb | La | Y |
|
1 |
46 |
47000 |
505 |
128 |
2 |
ND |
ND |
6900 |
800 |
17 |
15 |
33 |
33 |
|
2 |
48 |
47800 |
520 |
131 |
4 |
4 |
1 |
6800 |
800 |
18 |
15 |
29 |
32 |
|
3 |
47 |
46500 |
489 |
131 |
3 |
4 |
1 |
6700 |
700 |
17 |
15 |
26 |
33 |
|
4 |
36 |
32900 |
437 |
107 |
1 |
1 |
ND |
5400 |
500 |
14 |
13 |
24 |
28 |
|
5 |
48 |
46800 |
507 |
130 |
4 |
2 |
2 |
6700 |
800 |
17 |
14 |
23 |
31 |
|
6 |
45 |
45600 |
492 |
127 |
3 |
1 |
1 |
6700 |
700 |
17 |
15 |
32 |
33 |
|
7 |
43 |
40600 |
437 |
116 |
1 |
3 |
1 |
6100 |
600 |
16 |
14 |
26 |
29 |
|
8 |
40 |
40200 |
432 |
114 |
2 |
3 |
2 |
5800 |
600 |
15 |
13 |
33 |
31 |
|
9 |
38 |
40700 |
459 |
116 |
1 |
1 |
ND |
6100 |
700 |
16 |
14 |
33 |
32 |
|
10 |
43 |
41600 |
485 |
128 |
1 |
1 |
1 |
6100 |
700 |
17 |
14 |
29 |
32 |
|
11 |
34 |
35100 |
445 |
117 |
2 |
2 |
ND |
5600 |
600 |
16 |
13 |
41 |
32 |
|
12 |
39 |
35700 |
339 |
264 |
1 |
ND |
1 |
4800 |
600 |
14 |
12 |
25 |
28 |
|
13 |
47 |
45600 |
483 |
138 |
7 |
4 |
1 |
6300 |
700 |
19 |
15 |
31 |
34 |
|
14 |
48 |
45100 |
462 |
120 |
ND |
ND |
1 |
6400 |
700 |
17 |
15 |
35 |
33 |
|
15 |
39 |
41200 |
476 |
133 |
ND |
1 |
1 |
5700 |
600 |
18 |
15 |
24 |
33 |
|
16 |
35 |
33700 |
399 |
105 |
ND |
2 |
ND |
4800 |
500 |
14 |
12 |
29 |
29 |
|
17 |
58 |
56700 |
542 |
156 |
2 |
1 |
1 |
7300 |
800 |
22 |
18 |
30 |
37 |
|
18 |
25 |
24300 |
391 |
97 |
3 |
2 |
ND |
4100 |
400 |
13 |
10 |
25 |
26 |
|
19 |
48 |
46100 |
482 |
125 |
ND |
3 |
ND |
6800 |
800 |
18 |
15 |
30 |
33 |
|
20 |
46 |
43500 |
458 |
120 |
1 |
3 |
ND |
6100 |
600 |
17 |
14 |
32 |
31 |
|
21 |
46 |
45900 |
486 |
123 |
1 |
ND |
1 |
6900 |
800 |
17 |
15 |
32 |
33 |
|
22 |
45 |
41300 |
433 |
110 |
ND |
ND |
ND |
5900 |
600 |
16 |
13 |
30 |
30 |
|
23 |
41 |
41200 |
459 |
128 |
1 |
ND |
ND |
5800 |
700 |
18 |
15 |
28 |
31 |
|
24 |
40 |
40200 |
420 |
122 |
ND |
2 |
1 |
5200 |
600 |
17 |
14 |
22 |
30 |
|
25 |
44 |
44100 |
474 |
120 |
1 |
ND |
1 |
6400 |
700 |
17 |
14 |
33 |
31 |
|
26 |
40 |
39900 |
389 |
103 |
ND |
ND |
1 |
5200 |
800 |
15 |
12 |
24 |
27 |
|
27 |
30 |
29200 |
406 |
99 |
2 |
2 |
ND |
5300 |
500 |
14 |
13 |
26 |
28 |
|
28 |
46 |
43100 |
451 |
116 |
4 |
5 |
1 |
6200 |
700 |
17 |
14 |
28 |
30 |
|
29 |
37 |
38000 |
441 |
108 |
2 |
6 |
1 |
6100 |
600 |
17 |
14 |
33 |
31 |
|
30 |
45 |
44800 |
462 |
126 |
3 |
1 |
1 |
6200 |
700 |
18 |
13 |
29 |
30 |
|
31 |
45 |
44900 |
432 |
122 |
1 |
3 |
ND |
6000 |
700 |
17 |
14 |
31 |
33 |
|
32 |
40 |
38400 |
439 |
124 |
1 |
4 |
ND |
5700 |
600 |
16 |
15 |
31 |
33 |
|
33 |
35 |
34200 |
426 |
104 |
1 |
1 |
ND |
5200 |
600 |
14 |
13 |
34 |
29 |
|
34 |
37 |
37900 |
382 |
106 |
ND |
ND |
1 |
5100 |
800 |
15 |
12 |
31 |
26 |
|
35 |
29 |
29300 |
393 |
106 |
2 |
3 |
ND |
4600 |
500 |
14 |
12 |
17 |
28 |
|
36 |
38 |
34900 |
359 |
104 |
ND |
2 |
ND |
4900 |
600 |
14 |
12 |
26 |
30 |
|
37 |
95 |
46700 |
487 |
127 |
3 |
4 |
1 |
6700 |
700 |
17 |
15 |
33 |
33 |
|
38 |
41 |
41300 |
468 |
118 |
3 |
3 |
1 |
6300 |
700 |
15 |
15 |
28 |
32 |
|
39 |
47 |
45700 |
487 |
125 |
2 |
2 |
ND |
6800 |
800 |
17 |
15 |
27 |
32 |
Table 2: Minimum and maximum limits (in ppm) of 29 elements detected in 29 villages of Bathinda District.
|
U |
Th |
K |
CaO |
As |
Pb |
||||||
|
Min |
Max |
Min |
Max |
Min |
Max |
Min |
Max |
Min |
Max |
Min |
Max |
|
2 |
6 |
11 |
18 |
40 |
785 |
9773 |
132462 |
33 |
64 |
25 |
32 |
|
Cr |
Cu |
Cs |
Co |
Zn |
Sr |
||||||
|
Min |
Max |
Min |
Max |
Min |
Max |
Min |
Max |
Min |
Max |
Min |
Max |
|
71 |
154 |
11 |
30 |
0 |
13 |
72 |
291 |
38 |
310 |
125 |
408 |
|
Ce |
Zr |
Sc |
V |
Ni |
Fe2O3 |
||||||
|
Min |
Max |
Min |
Max |
Min |
Max |
Min |
Max |
Min |
Max |
Min |
Max |
|
78 |
116 |
222 |
363 |
4 |
14 |
41 |
85 |
25 |
95 |
24300 |
56700 |
|
Ba |
Rb |
Sn |
Sb |
Mo |
TiO2 |
||||||
|
Min |
Max |
Min |
Max |
Min |
Max |
Min |
Max |
Min |
Max |
Min |
Max |
|
359 |
542 |
97 |
264 |
0 |
7 |
0 |
6 |
0 |
2 |
4100 |
7300 |
|
MnO |
Ga |
Nb |
La |
Y |
|||||||
|
Min |
Max |
Min |
Max |
Min |
Max |
Min |
Max |
Min |
Max |
||
|
400 |
800 |
13 |
22 |
10 |
18 |
17 |
41 |
26 |
37 |
||
Although Uranium and Thorium in the measured soil samples were quite low to cause any damage yet elements like CaO, Co, Zr, Rb are found in higher amounts. CaO, Co, Zr were noted much higher than their permissible values (Table 3) in all the villages (except one location of Kaurena village having CaO concentration of 9773 ppm). 74% of villages have high value of Rb (Table 3). Among these, the elements that cause alkalinity such as Ca, Rb are quite high. These may be due to coal fired TPP (Tharmal Power Plant) at Bathinda which is not very far off from the invested area. When coal or lignite rich in limestone, produce ash having calcium oxide, it (Lime stone (CaO)) easily diffuses in water bodies and make calcium hydroxide Ca(OH)2 and transformed through rain water to canals or agriculture water systems and ultimately reach into the soils.16
In India, the ash content in the coal utilized in power production is about 30 to 40%, which is rather more than the other developed nations. Higher values of coal fly ash resulting in high damage to the plants as well as machines. All the heavy elements commonly found in the coal fly ash are poisonous in nature.17
Table 3: Permissible values in ppm for some elements found in the study area as below.
|
Element |
Permissible values (ppm) |
Reference |
|
U (226Ra) |
35 |
24 |
|
Th |
40 |
24 |
|
K |
400 |
24 |
|
CaO |
14400 |
25 |
|
As |
20 |
26 |
|
Pb |
20 |
27 |
|
Cr |
35 |
27 |
|
Cu |
25 |
27 |
|
Co |
10 |
27 |
|
Zn |
71 |
27 |
|
Sr |
350 |
27 |
|
Zr |
190 |
27 |
|
V |
60 |
27 |
|
Ni |
20 |
27 |
|
Fe2O3 |
57700 |
25 |
|
Ba |
550 |
27 |
|
Rb |
112 |
27 |
|
Mo |
1.5 |
27 |
|
TiO2 |
8800 |
25 |
|
MnO |
1000 |
25 |
|
Y |
22 |
27 |
Contaminated locations of metal-bearing solids can originate from a wide variety of anthropogenic sources in the form of, pesticides, coal combustion residues, metal mine tailings, land application of fertilizer, disposal of high metal wastes in improperly protected landfills, animal manures, sewage sludge, leaded gasoline, lead based paints, compost petrochemicals, and atmospheric deposition.18-20 Among these use of fertilizers, pesticides and weedicides are most common in the agriculture.
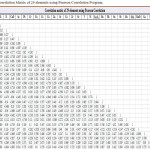 |
Table 4: Correlation Matrix of 29 elements using Pearson Correlation Program. |
Fertilizer
For healthy plant growth not only macronutrients, but also some micronutrients (such as Co, Cu, Fe, Mn, Ni, and Zn)) are also required in limited amounts. But if the range of theses essential heavy elements crossed the safety limits, then the soil becomes polluted. Large quantities of fertilizers are regularly added to soils in intensive farming systems to provide adequate N, P, and K for crop growth. In the study area generally Urea (containing N), Di-ammonium Phosphate (containing N, P), Zinc phosphate (containing Z, P) etc. are used. The compounds used to supply these elements contain trace amounts of heavy metals (e.g., Cd and Pb) as impurities, which, after continued fertilizer, application may significantly increase their content in the soil.21 These toxic elements not only affect the grown plants and crops, but also get transferred to human bodies through food items. In the present study, it has been found that micronutrients like Zn in Manuana and Ram Nagar, Co, Ni in all villages and macro nutrient K are quite high in amounts in Maur Chart, Burj, Joge Wala and Gatwali villages, as compared to the permissible values.
Pesticides and Weedicides
The chemicals used as insecticides and fungicides are based on compounds which contain Cu, Hg, Mn, Pb, or Zn. Examples of such pesticides are copper-containing fungicidal sprays such as Bordeaux mixture (copper sulphate) and copper oxychloride.22 Formulations of Cu, Cr, and As (CCA) derelict sites where soil concentrations of these elements greatly exceed background concentrations. Compared with fertilizers, the usage of these substances is more localized, being restrained to particular locations and plantation.23 In the current work, Zn in Manuana and Ram Nagar, Cu in Gehlawal and Shekhpura and Pb in all villages are far more than their permissible values (Table 3) showing that pesticides and weedicides may influence the quality of soils.
Radio Nuclides
Environmental radio nuclides with varying fractions can enter the atmosphere in the form of aerosols or fine dust particles that may be deposited directly on growing vegetation or be inhaled directly by humans and other animals. The human body absorbs these radio nuclides by two routes: inhalation and through food and water. The heavy (or transition) metal elements make up a large part of the periodic table and include some of the most toxic agents known, like mercury and cadmium). In the present case, radio nuclides like U and Th were much below the safety limits as shown in the Table 3. K-40 is quite high in one of the locations in Maur Chart, Burj Jage Wala and Gatwali villages, but overall it is below the permissible values. It shows that radio nuclides are not causing much effect in this region.
Correlations
The Pearson Correlation Program is used to find correlations among the elements found in soil analysis (Table 4). A significant positive correlation has been found for Th-Nb, Th-TiO2, As-Co, Zn-Ni, Ce-Zr, Zr-La, V-Fe, V-Ba, V-TiO2, Fe-Ba, Fe-Nb, Ba-Nb, Nb-Y, showing that the presence of one parameter may increase the concentration of the other. Similarly, some negative correlations have been found for K-Cu, K-Cs, As-Cr, Pb-Sc, Cr-Cu, Cs-Co, Zn-Sr, Zr-Mo, V-Rb, Ni-Mo, Ba-MnO, Sn-MnO as shown in Correlation Table 4. These indicate that if one of the element in a given pair is elevated the amount of other decreases.
Conclusion
Elements U, Th, Sr, Cr, Mo, TiO2 and MnO are having a lower concentration than permissible values (Table 3).
Elements like Cu, Ba and Fe are having normal concentration found in such soils.
Elements such as K-40 in one of the locations in Maur Chart, Burj Joge Wala and Gatwali villages and Zn in Manuana and Ram Nagar are higher in concentrations, but in rest of villages it is below the permissible values (Table 3).
Co, Cao, Pb, As, Ni and Y are unusually higher in amounts and might be responsible for routine cancer diseases.
Alkaline elements such as Ca, Rb and Zr are very high, particularly Calcium which has been found in higher content in cancerous tissue usually.
The basic sources of above pollutants (Co, CaO, Pb, As, Ni, Y, Rb and Zr) which are found in extra amount than their permissible limits (Table 3) for this region may be the coal fired TPP (Tharmal Power Plant) at Bathinda which is nearby the studied area and pesticides, weedicides and fungicides used for agricultural purposes.
To sum up radioactive elements like uranium, thorium and potassium (K-40) are low in content to cause any cancers. Excess of alkalinity causing elements, may be acting as a catalyst for such radioactive elements to be harmful.6 Hence excess of alkalinity might be the main reason for tumor growth and cancer scare.
Acknowledgements
The authors are thankful to the chairman of SBBSIET, Khiala, Jalandhar for providing facilities and encouragement. Ms. Kirandeep Kaur is especially in debt to RIC, IKG PTU, Kapurthala for registration for Ph. D.
Conflict of Interest
There is no conflict of interest because this work is drawn from original thesis of corresponding author submitted and accepted under UGC guidelines to Punjab Technical University, Kapurthala.
References
- Mehra, R.; Singh, S.; Singh, K.A.; Study of Uranium, Radium, Radon Exhalation Rate and Indoor Radon in the Environs of Some Areas of the Malwa Region, Punjab. Indoor Built Environ. 2006, 15(5), 499–505.
- Mehra, R.; Singh, S.; Singh, K.; and Sonkawade, R.; 226Ra, 232Th and 40K analysis in soil samples from some areas of Malwa region, Punjab, India using gamma ray spectrometry. Environ Monit Assess. 2007, 134, 333–342
- Bajwa, B. S.; Kumar, S.; Singh, S.; Sahoo, S. K.; and Tripathi, R. M.; Uranium and other heavy toxic elements distribution in the drinking water samples of SW-Punjab, India. Journal of Radiation Research and Applied Sciences. 2015, 1-9.
- WHO, Guidelines for drinking-water quality, (4th ed.)World Health Organization, Geneva,Switzerland 2011.
- AERB, Drinking water specifications in India, Department of Atomic Energy, Govt. of India, 2004.
- Balwant Garg/TNS. BARC report on Uranium cause of Malwa water contamination, submitted to Punjab and Haryana High court on Feburary 15, 2012
- Zambello, F. R.; and Enzweiler, J.; Multi-element analysis of soils and sediments by wavelength-dispersive X-ray fluorescence spectrometry. Journal of Soils and Sediments. 2002, 2(1), 29-36.
- Suciu, I.; Cosma, C.; Todica, M.; Bolboaca, S. D.; and Jantschi, L.; Analysis of soil heavy metal pollution and pattern in Central Transylvania, Int. J. Mol. Sci. 2008, 9, 434.
- Chopin, E. I. B.; and Alloway, B. J.; Distribution and mobility of trace elements in soils and vegetation around the mining and smelting areas of Tharsis, Riotinto and Huelva, Iberian P [8] rite Belt, SW Spian, Water Air Soil Pollution. 2007, 182, 245.
- Stihi, C.; Bancuta, A.; Popescu IV, Cimpoca, M.V.; Gugiu, M.; and Vlaicu, G.; H.; Air pollution studies using PIXE and ICP methods. Journal of Physics: Conference Series. 2006, 41, 565.
- Szyczewski, P.; Siepak, J.; Niedzielski, P.; and Sobczyński, T.; Department of Water and Soil Analysis, Adam Mickiewicz University, Drzymały 24, 60-613 Poznań, Poland. Research on Heavy Metals in Poland Polish J. of Environ. Stud. 2009, 18(5), 755-768.Invited Review.
- Vries, W. D.; Romkens, P. F.; and Schutze, G.; Soil concentrations of Cadmium, lead and mercury in view of health effects on humans and animals. Reviews of Environmental Contaminat Critical ion and Toxicology 2007, 191, 91.
- Popescu, IV.; Stihi, C.; Cimpoca, G.V.; Dima, G. Vlaicu, G.; Gheboianu, A.; Bancuta, I.; Ghisa, V.; and State, G.; Environmental Samples Analysis by Atomic Abrorption Spectrometry (AAS) and Inductively Coupled Plasma-Optical Emission Spectroscopy (ICP-AES), Rom. Journ. Phys. 2009, 54(7-8), 741.
- Stihi, C.; Popescu, IV.; Gheboianu, A.; Frontasyeva, M.; Ene, A.; Dima, G.; Bute, O.; Cimpoca. V.; Stithi, V.; Oro, C.; Dhinu, S.; and Voicu, M.; Mineral Content of Native Vegetables Obtained by Energy Dispersive X-ray Fluorescence Spectrometry, Journal of Science and Arts. 2008 9(2), 332.
- Grabulosa, E. M.; Analytical Methodologies Based On X-Ray Fluorescence Spectrometry (Xrf) And Inductively Coupled Plasma Spectroscopy (Icp) For The Assessment Of Metal Dispersal Around Mining Environments, PhD Dissertation presented for the degree of doctor in Chemistry at the University of Girona Girona, February 2006. University of Girona Chemistry Department Analytical Chemistry Unit.
- Umesh, C. et al., 2001), Investigation of Alkaline nature of rain water in India. 1685-1690. Water, Air and Soil Pollution, 2001, 130, 1685-1690.
- Senapati, M. R.; Fly ash from thermal power plants – waste management and overview. Current Science. 2011, 100, 12.
- Khan, S.; Cao, Q.; Zheng, Y. M.; Huang, Y. Z.; and Zhu, Y. G.; Health risks of heavy metals in contaminated soils and food crops irrigated with wastewater in Beijing, China. Environmental Pollution, 2008, 152 (3), 686–692.
- Zhang, M. K.; Liu, Z. Y.; and Wang, H.; Use of single extraction methods to predict bioavailability of heavy metals in polluted soils to rice. Communications in Soil Science and Plant Analysis. 2010, 41(7), 820–831.
- Basta, N. T.; Ryan, J. A.; and Chaney, R. L.; Trace element chemistry in residual-treated soil: key concepts and metal bioavailability. Journal of Environmental Quality. 2005, 34(1), 49–63.
- Wuana1, R. A.; and Okieimen, F. E.; Heavy Metals in Contaminated Soils: A Review of Sources, Chemistry, Risks and Best Available Strategies for Remediation International Scholarly Research Network ISRN Ecology Volume 2011, Article ID 402647, 20 pages doi:10.5402/2011/402647 Review Article.
- Jones, L. H. P.; and Jarvis, S. C.; The fate of heavy metals,” in The Chemistry of Soil Processes, D. J. Green and M. H. B.Hayes, Eds.,JohnWiley & Sons, New York, NY, USA, 1981, 593.
- McLaughlin, M. J.; Hamon, R. E.; McLaren, R. G.; Speir, T. W.; and Rogers, S. L.; Review: a bioavailability-based rationale for controlling metal and metalloid contamination of agricultural land in Australia and New Zealand. Australian Journal of Soil Research, 2000, 38(6), 1037–1086.
- United Nation Scientific Committee on the Effects of Atomic Radiation Report. Sources and effects of ionizing radiation. In Annex B: Exposure due to Natural Radiation Sources (Vol. 1). New York: United Nation (2000a).
- Bohn, L. H.; McNeal, L. B.; and O’Connor, A. G.; 2001, Soil Chemistry; 2nd edu (New York: John Wiley).
- Rahaman, S. et al.; Arsenic contamination: a potential hazard to the affected areas of West Bengal, India. Environ Geochem health. 2013, 35 (1), 119-32.
- Taylor, S. R.; and McLennan, S. M.; The geochemical evolution of the continental crust; Rev. Geophys. 1995, 33, 241–265.
Accepted on: 01-06-2019


![]()


