Synthesis and Characterization of A-Site Doped LaMnO3 Nano Catalysts and its Application for Soot Oxidation
Kayode Akinlolu* , Abimbola Adebisi, Bamgboye Omolara and Ogunniran Kehinde
Covenant University, Km.10, Idiroko Road, Canaanland, Ota, Ogun State, Nigeria.
Corresponding Author’s mail: akinlolu.kayode@stu.cu.edu.ng
DOI : http://dx.doi.org/10.13005/ojc/350303
Article Received on : 26-02-2019
Article Accepted on : 13-05-2019
Article Published : 13 Jun 2019
A series of barium doped LaMnO3 perovskite nano catalysts were synthesized using the citric acid sol gel method. The prepared nano catalysts were characterized using the various characterization techniques such as XRD, ICPAES, FTIR, SEM, HRTEM, TPR and BET. The Xrd results showed the purity of the prepared catalyst as no segregated phases were observed and also confirming the crystallinity of the prepared catalyst. The surface area achieved in this experiment presented one of the highest reported in literature. The doping of the perovskite catalysts helps in increasing the surface area. The ICPAES results shows the efficiency of the preparation method adopted. The catalytic evaluation shows that upon introduction of Ba into the perovskite structure, the catalytic performance of the catalyst were greatly increased with LBM3 giving the lowest T50 at 550°C
KEYWORDS:Catalysis; Catalysts; Perovskite; Soot Oxidation
Download this article as:| Copy the following to cite this article: Akinlolu K, Adebisi A, Omolara B, Kehinde O. Synthesis and Characterization of A-site Doped LaMnO3 Nano Catalysts and Its Application for Soot Oxidation. Orient J Chem 2019;35(3). |
| Copy the following to cite this URL: Akinlolu K, Adebisi A, Omolara B, Kehinde O. Synthesis and Characterization of A-site Doped LaMnO3 Nano Catalysts and Its Application for Soot Oxidation. Orient J Chem 2019;35(3). Available from: https://bit.ly/2IcuTyI |
Introduction
Diesel engines have been reported to have a comparative advantage when compared with the other engines. Some of these advantages includes reduced fuel consumption, reduced amount of CO2 produced and lesser emission of unburned hydrocarbon and carbon monoxide.1 However, one challenge with diesel engines is that they generally produce large amount of soot. Therefore because of the adverse effect that soot has on the human body and environment, there have been a strict regulations on vehicular emissions and these requires control plan and strategy to meet these regulations.2 There are so many ways by which soot can be removed in diesel exhausts but the diesel particulate filter (DPF) have been reported to be the most efficient of all the options available.3 The DPF entraps the soot on a filter and afterwards eliminate it by catalytic combustion. The use of the catalytic combustion is to help the combustion of the soot at lower temperature of the diesel exhaust. The kind of catalysts to be used in for soot combustion must be active at a lower temperature and stable at a high temperature as well as being relatively cheap. Several catalysts such as metal oxide, Pt based catalysts, spinels, mixed oxides etc have been reported to be effective in the oxidation of soot in diesel engines.4 This is because the oxides can hasten up the soot combustion reaction as a result of the highly reactive oxygen species present on the surface of the metal oxide. The catalytic activities of these catalyst can as well be associated with the movement of the chemisorbed oxygen spices which impacts actively to the soot combustion by spill over.5 Several reports have considered perovskites type of catalysts as a potential alternative for catalytic combustion due to their cheap method of preparation and thermal stability properties.6 Perovskites can accommodate the inclusion of metal ions in both its A-site and B-site which creates structural defects and improves catalytic behaviors. However, the potential of perovskites in the catalytic oxidation of soot in DPF has not been properly examined. Hence, the aim of this work is to synthesize a series of LaMnO3 perovskites catalyst which are partially substituted in the A site by different barium amounts, characterize it and then use it as a catalyst for soot oxidation for potential use in diesel particulate filter of diesel engines. In this research study, several doped catalysts were prepared by varying the ratio of dopant (barium) used (x= 0, 0.1, 0.2, 0.3, coded LBM 1, 2, 3, 4 respectively).
Materials and Method
Preparation of the LBMs
Various solutions of [La (NO3)2·6H2O, Indian Rare Metals Chemical Ltd], [Mn (NO3)2·4H2O, Sigma–Aldrich Chemicals) and (Ba (NO3)2, Sigma–Aldrich Chemicals) were prepared by dissolving the proper quantity of the metal nitrates in distilled water. EDTA (Sigma–Aldrich Chemicals) and Citric Acid (Sigma–Aldrich Chemicals) served as chelating agents and was added to the metal nitrate mixture. The mixture was stirred at room temperature after which EDTA (Merck chemicals Ltd) followed by citric acid. The temperature was raised to 90°C for 4 hrs on a hot plate. A purple gelatinous substance was obtained by raising the temperature to 100°C. The resulting gel was heated in an oven for 4 hrs and then calcined at 750°C for 3 h to obtain the final perovskite catalyst.
Characterization Techniques
The elemental composition was determined by inductively coupled plasma atomic emission spectroscopy (ICPAES) model DRE, PS-3000UV, LEEMAN LABS, INC, USA. The surface area (SSA) of the catalysts was carried out using a Micromeritics Gemini V apparatus. The XRD was done using a Rigaku diffractometer, model Geiger flex. The TGA/DTA was analysed by thermogravimetry–differential analysis (TG/DTA, STA 449 C NETZSCH). The O2-TPD and H2–TPR experiments were performed using a Pulse Chemosorb 2705 device. The various functional groups in all the prepared catalyst was identified using the Fourier Transform Infrared Spectrometer of model Perkin Elmer- Spectrum Two (400-4000 cm-1). The Scanning Electron Microscopy (SEM) was taken on a FE-SEM quanta 200F, FEI 2010 instrument. Transmission electron microscope (TEM) images and energy-dispersive spectroscopy (EDX) results were obtained with a JEOL instrument.
Catalytic Activity
The soot oxidation was carried out using the thermo-gravimetric analysis method in a TG–DSC, Q-600 instrument as described by.7 The prototypical soot that was used in this research work was carbon black obtained from the vehicular emission control laboratory of the CSIR-Indian Institute of Petroleum Dehradun.
A soot to catalyst mix of ratio 1:4 weight ratio was thoroughly mixed together in a laboratory mortar so as to ensure homogenous mixture and for tight contact of the catalyst and the soot.8
Results and Discussion
The formation of the perovskite catalyst using the citric acid complexation process is based on the ability of some α- hydroxycarboxylic acid to form chelate with some transition metal ions. This chelation results into the formation of a gel usually by polyesterification. The decomposition of the organic based gel resulted into the formation of the almost amorphous homogenous precursor (Scheme 1 below) favouring its later conversion into the desired perovskite structural phase. The Scheme 1 shows the reaction between La and Mn cations with the citric acid by the substitution of hydrogen in the –COOH group to give the final perovskite catalyst. Also, NO2 can also replace hydrogen in the -OH group.9-11
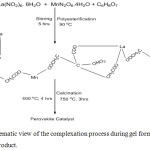 |
Scheme 1: Schematic view of the complexation process during gel formation and the final product. |
TGA/DTA Analysis
The thermal analysis of the synthesized perovskite catalysts was evaluated by employing the TGA/DTA method as shown in Figure 1 below. LBM2 dried at 200°C which is a representative catalyst was used for the thermal studies.
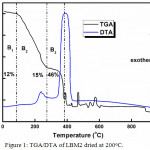 |
Figure 1: TGA/DTA of LBM2 dried at 200oC. |
The mechanism by which the phase of the perovskite catalyst changes was evaluated using the percentage weight loss in relation to temperature within the range of 0-1000°C. The percentage loss in weight that was noticed at temperature range below 600°C has been credited to the thermal breakdown of water, the catalyst precursors and organic moiety.9,12,13 At a higher temperature of more than 600°C, a change in weight was not observed. From the thermal profiles of the evaluated catalyst, there are about three major decomposition stages. The endothermic weight loss (B1) that was seen at the temperature 0-150°C has been attributed to the loss of surface water.14-16 The second decomposition stage (B2) was observed at a temperature between 150 -260°C and has been ascribed to probable loss of crystalline water.17-19 The main weight loss stage (B3) was observed around the temperature range of 250-400°C and this has been assigned to the breakdown of citrate, EDTA and other organic moiety present in the catalyst.12,20,21 The other negligible weight losses recorded above 400°C has been assigned to the breakdown of any other organic components in the perovskite catalyst. This is followed by a strong exothermic DTA peak. Also, another observation that was observed in the thermal profiles is that the DTA peak between the 0-400°C range are small compared to that seen above 400°C range. This suggests that only small amount of energy is needed in the reactions as compared to those at higher temperature. Also, since the TGA/DTA analysis was carried out under N2/O2 conditions, the large DTA peak seen can be ascribed to the combustion of the organic materials present in the catalyst .16,22,23 The different stages of decomposition observed from the TGA graph together with the chemical processes that was noticed in the DTA, proposes that the step by step thermal decomposition of the prepared catalyst ended at a temperature of about 600°C.24-26
XRD Analysis
The XRD of all the prepared catalysts is as shown in Figure 2a. The catalysts are found to have the desired perovskite phase LaCoO3 corresponding to the ICCD-PDF 75-0440.27 There are no peaks associated with the carbonates of the dopant was observed suggesting that the prepared catalysts are of high purity at least to the detection limit of the XRD.
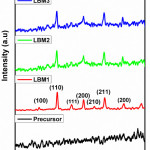 |
Figure 2a: XRD patterns of prepared perovskite catalysts. |
Nevertheless, some structural distortion were observed in the patterns of the doped perovskite catalysts as there was a shift in the pattern of the doped perovskite catalysts towards the 2θ mark on the XRD plots. This structural distortion have been reported by many researchers to depend on the nature of the cations on either the A-site or the B-site.28-32 Therefore, in order to properly analyse these structural differences, the shift in the XRD observed towards the 2θ (31-34) was extended as shown in Figure 2(b).
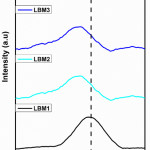 |
Figure 2(b): Extended XRD patterns of prepared perovskite catalysts. |
As can be observed, the position of the LBM1 was shifted towards 2θ for LBM2, LBM3 and LBM4. Using the QualX software, LBM1 was found to be orthorhombic in structure while LBM2, LBM3 and LBM4 were found to be rhombohedral in symmetry. In general, perovskite materials have been said to have a tendency to deviate from its perfect cubic structure (Pm3m-Oh) to give two different phase structure which can either orthorhombic or rhombohedral.33-36 These changes in the structural distortion have been reported by many material scientist to be as a result of the ionic sizes of A or B sites cations, the differences in their charges, there relative proportion concentration or the chemistry nature of the perovskite materials.28,37-39 Furthermore, in order to evaluate how stable the structure of the perovskite catalysts are, the Goldschmidt’s tolerance factor (t) was calculated using the formula
t = ra + ro/√2(rb +ro)
Where ra is the atomic radii of the cations on the A-site and rb is the ionic radii of the B-site cations and ro is the ionic radii of O2- in the ABO3 perovskite structure. Several reports have suggested that a perovskite material is stable if the tolerance factor is within the range of 0.85-1.09.40 When the tolerance factor is equal to 1 it means the perovskite material is cubic in structure and when it is less than 1 it means the perovskite material has a distorted structural characteristics which is most times orthorhombic. Materials scientist have suggested that a tolerance factor that is near to unity means that the alteration of the perovskite material is close to the rhombohedral symmetry.36 Again when consider the fact that La3+ is the main cation on the A site of the prepared perovskite catalysts, we calculated the tolerance factor using the (+3) as the oxidation state of the cations on the B site. However, several material scientist have reported that partially substituting the A site of the perovskite structure (in this case with Ba2+) helps in promoting the oxidation state of the B site cation so as to main the electro neutrality of the catalysts. Therefore, as a result of this assumption, the tolerance factor using the oxidation state of +4 was also calculated and the results are presented in Table 1. All the prepared catalysts exhibited the orthorhombic symmetry (t<1). Similarly, it was observed that all the Mn3+ in the prepared catalysts exhibited the same tolerance factor. This suggests the presence of B4+ cations which may be due to the unstable nature of the orthorhombic structure as a result of the Jahn teller nature of Mn3+.28 The structural refinement of the prepared catalyst was done using the QualX software and it reconfirmed that the doped catalysts has the rhombohedral structure and the space group of R-3c. The size of the crystals were calculated using the QualX software and the results obtained was recorded in Table 1. The crystallite sizes ranges from 30.0- 32.3 nm. The size of the crystals were found to increase upon the introduction of the dopant into the perovskite catalysts.
|
Catalyst |
Symmetry |
Ionic radius |
Tolerance Factor (t) |
Space group |
B-site cation |
Lattice Parameter |
Crystallite size (nm) |
Surface Area (m2/g) |
||||
|
+3 |
+4 |
+3 |
+4 |
a |
b |
C |
||||||
|
LBM1 |
Rhombohedral |
0.645 |
0.530 |
0.85 |
0.850 |
R-3c |
Mnn+ |
0.5450 |
0.5450 |
1.3478 |
30.00 |
24.00 |
|
LBM2 |
Rhombohedral |
0.645 |
0.530 |
0.900 |
0.900 |
R-3c |
Mnn+ |
0.5465 |
0.5466 |
1.3479 |
31.50 |
27.00 |
|
LBM3 |
Rhombohedral |
0.645 |
0.530 |
0.901 |
0.902 |
R-3c |
Mnn+ |
0.5464 |
0.5465 |
1.3477 |
32.30 |
32.00 |
|
LBM4 |
Rhombohedral |
0.645 |
0.530 |
0.903 |
0.902 |
R-3c |
Mnn+ |
0.5466 |
0.5466 |
1.3478 |
31.80 |
45.00 |
Surface Area analysis (BET)
The perovskite catalyst prepared in this research study displayed a surface area 24-45 m2/g as shown in Table 1. These values are among the highest so far to the best of our knowledge and they are remarkably higher than those which have been attained by other methods of preparing perovskites (1–11 m2/g).9,31,34,41,42 Also there is an increase in the surface area from 27-45 m2/g when Barium was doped, this suggest that the introduction of barium into the perovskite structure has helps in increasing the surface area of the catalyst hence improving the catalytic activity. Several material scientist have argued that a good catalyst must have a good surface for spread of the active sites. Hence it is generally believed that the higher the surface area the more the better the catalyst. The adsorption desorption isotherm of the prepared catalysts is as shown in Figure 3. All the catalyst displayed a type IV isotherm with hysteresis loops which are observed for all catalyst thus demonstrating the mesoporous structure of all samples.43
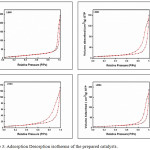 |
Figure 3: Adsorption Desorption isotherms of the prepared catalysts. |
Temperature Programme Reduction (H2-TPR and O2-TPR) Analysis.
The temperature program reduction (TPR), is a characterization technique that has the ability to collect information as regards the oxidative state of the B cations (in this case Mn) and also say if there exist any cationic vacancies in the perovskite. In this research study the H2-TPR and O2-TPR was considered.
The Figure 4 shows the H2-TPR plots of the prepared catalyst. From the plots, a kind of splitted signal having a peak at around 340-360°C and at 450°C was observed. According to the research conducted by,12 the H2-TPR of LaMnO3 exhibited a stable intermediate reduction state at the temperature range 500-900°C which correspond to the stoichiometric LaMnO3. Therefore using the same idea for the prepared perovskite catalysts, it can be said that the reduction peak that was observed below 500°C is as a result of the excess oxygen been removed from the perovskite as well as possible Mn4+ reduction which was formed to balance the electronic difference caused by Ba doping.
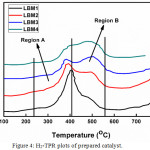 |
Figure 4: H2-TPR plots of prepared catalyst. |
In the H2-TPR of the prepared catalysts, two main regions can be observed.
The region A that lies in between 260-410°C which exhibits a clear and distinct signal in all the catalyst prepared and having a little shift of the maximum peak in the direction towards the lower energy as well as a clear reduction in the intensity as the concentration of dopant increases.
The region B that extends from 410-570°C having an intensity that increases as the concentration of the dopant increases.
Therefore by comparing the H2-TPR in this study with the one carried out by,44 it can be proposed that the signal observed at 260-410°C can be ascribed to the removal of oxygen from the oxidative non stoichiometric as presented in reaction 1 while the peak observed around 410-570°C corresponds to the reduction of Mn4+ to Mn3+as presented in reaction 2.
La1-xBaxMn1-x-2ժ3+ Mnx+2ժ4+O3+ժ + ԺH2
↓
La1-xBaxMn1-x3+Mnx4+O3 + ժH2O —————- Reaction 1
La1-xBaxMn1-x3+Mnx4+O3 + ½ ×H2
↓
La1-xBaxMn3+O3-x/2 + ½ × H2O————– Reaction 2
Also, above 570°C, it can be assumed that another stage of reduction started but could not be completed at 750°C which is the highest temperature used in this study. However,45,46 has suggested that the peak observed at higher temperature can be attributed to the possible reduction of Mn2+ to Mn3+ as well as simultaneous break down of the perovskite catalysts structure as shown in reaction 3.
La1-xBaxMn3+O3-x/2 + ½ H2 → ½ (1-x) La2O3 + xBaO + MnO + ½ H2O——Reaction 3
Furthermore, it was discovered that the peaks ascribed to the reduction of Mn4+ (410-570 oC) has its intensity increased with increasing dopant concentration which is similar to the shift observed in the XRD patterns of the LBMs. This suggests that the dopant has been well incorporated into the perovskite structure.47-49
The O2-TPD of the various prepared catalysts is as presented in Figure 5. From the figure, a wide peak which lies between 100-450°C and 450-570°C was observed. Current literatures have reported that the peaks observed in the low temperature region corresponds to desorbed oxygen molecules which are engrossed on the surface vacancies of the catalysts (α oxygen species).50-53 Furthermore, the O2-TPD plots obtained in this research study displays two main kinds of absorbed oxygen species. The expansive peak observed between 100-450°C has been assigned to be the superficial adsorbed oxygen while the broad peak observed above 500°C for doped perovskite catalysts (LBM2, LBM3 and LBM4) could be ascribed to the release of oxygen species which are occupying the inner vacancies of the perovskite catalyst as a result of the partial substitution of La by Ba.49,54,55 Since42 has previously reported that the area under the graph can be relatively compared to the quantity of oxygen desorbed, we can therefore establish in this study that the amount of surface oxygen vacancies (broad peak between 100-450°C) in the prepared catalysts decreases in the order LBM2 > LBM1≈ LBM4 > LBM3. The peak observed above 570°C could not be completed however, similar research carried out by56 has assigned peaks at higher temperature to be β-oxygen species which is the desorption of oxygen from the lattice surface. The β-oxygen species are associated with part reduction of the cation on the B site and for this reason we can assign this signal to excess oxygen in this study.57
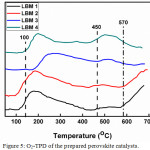 |
Figure 5: O2-TPD of the prepared perovskite catalysts. |
SEM and HRTEM Analysis
The morphology of the prepared catalysts were observed using the SEM and TEM characterization techniques as shown in below. The SEM images of the prepared samples are as shown in Figure 6. From the images obtained, all the samples exhibited similar mesoporous structure morphology as confirmed by the isotherm plots of the BET. It was observed that as the concentration of Ba was been increased the pores in the images shown by the SEM became more prominent.
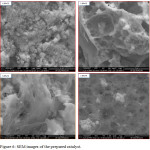 |
Figure 6: SEM images of the prepared catalyst. |
Also, the HRTEM images of the prepared perovskite catalysts displayed the porous nature of the catalyst as shown in Figure 8 (a-h). From the HRTEM images as well we observed that the shape of the particle appears to be spherical-like with pores like structures. It was also observed that agglomeration occurs with the doping of the parent catalyst with barium as shown in Figure 8(a-d). The SAED of the prepared catalyst is as shown inserted in Figure 8 (a-d). The SAED shows the crystallinity of the prepared catalyst as confirmed by the XRD. The Lattice fringes has presented in Figure 8(f and h) clearly show a lattice spacing distance of 0.28nm which indicates good crystallinity in agreement with what been earlier reported in literature.40
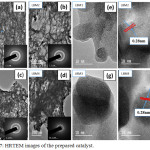 |
Figure 7: HRTEM images of the prepared catalyst. |
The TEM-EDX of the prepared sample is shown in Figure 8. This confirms the presence of Mn, Ba, La and oxygen giving a suggestion that the perovskite structure of the catalyst is formed. Also difference between the theoretical and experimental analysis is shown in the form of bar chart shown besides the EDX. The bar chart shows that there is no too much difference between them hence showing the efficacy of the method use in the preparation of the catalysts.
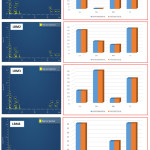 |
Figure 8: TEM-EDX of the various prepared catalyst. |
Also the elemental mapping of the prepared catalyst is shown in Figure 9. The elemental mapping of the catalyst also shows the even distribution of all the elements present. This suggest that the perovskite catalyst has been formed.
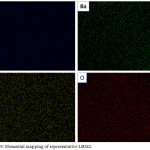 |
Figure 9: Elemental mapping of representative LBM2. |
Catalytic Studies of the Prepared Perovskites
The catalytic studies of the prepared catalysts was carried out for soot conversion. The soot conversion result acquired from the TGA conversion of the soot was standardized by eliminating the weight loss observed below 300°C, this is because absorbed water desorption and some impurities on the surface of the soot takes place below 300°C as reported in literature by.52,58-60 The normalized conversion plots all through the soot oxidation over the catalysts LBM1, LBM2, LBM3 and LBM4 are as denoted in Figure 10. In other to know and relate the effect of the catalyst on the soot oxidation, a blank soot sample was run without the catalyst.
From the result of the analysed catalysts, the catalytic activity was analysed by looking at the T50 and the T-final. It was observed that all the prepared catalyst has the ability of oxidize soot at a lower temperature. It was also observed that the doping of the parent perovskite catalyst helped in lowering the temperature at which soot is oxidized as seen in the catalytic profile plots displayed below hence showing the potential that doped perovskite can be used as catalyst for the oxidation of soot in diesel engine and can be used to economize the fuel consumption in diesel cars. LBM3 catalyst gave the highest conversion in relation to the temperature (T50) which we can say means that it has the highest conversion with the lowest temperature value of about 530°C (i.e. the temperature at which 50% of the soot have been converted and which is also called the light off temperature or the soot ignition temperature), while LBM1, LBM2 and LBM4 gave conversion rate at temperatures values (T50) of about approximately 580, 570 and 560°C respectively. Also looking that the temperature at which total soot is converted (T final) it was observed that there was a drop in the temperature at which the total conversion of soot occurred when compared with the temperature of the raw root and that of the un-doped catalyst. The doping of the perovskite catalyst helped in reducing the temperature at which the all the soot has been oxidized which further suggests that barium doped perovskite has the potential of been used as a catalyst in the fuel efficiency of diesel engine cars. From the T-final values, LBM3 still gave the best catalyst activity as compared to the others.
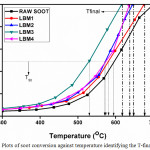 |
Figure 10: Plots of soot conversion against temperature identifying the T-final and T50. |
Conclusion
LaMnO3 perovskite catalysts doped on the A site by Ba have been synthesized using the citric acid sol gel method. The XRD characterization indicated that the synthesized catalysts were crystal in nature and that they are pure as there are no isolated phases of BaCoO3 or Co2O3 were observed. The Tem images conforms that the prepared catalysts were spherical in shape the tolerance factor states that the symmetry of the nano catalysts were rhombohedral. The catalysts exhibited good catalytic properties for potential soot conversion in diesel particulate filter. The best catalyst was exhibited by LBM3 which has the lowest T50 and T90 values at 550°C and 620°C respectively.
Acknowledgements
The authors’ wishes to express their gratitude to TWAS-CSIR for the award of the fellowship for the completion of this research work. We also appreciate the management of Covenant University Ota, Nigeria for their financial support towards the publication of research paper.
Conflict of Interest
There is no conflict of interest.
References
- S. Fu, H. Niu, Z. Tao, J. Song, C. Mao, S. Zhang, C. Chen and D. Wang, Journal of Alloys and Compounds, 2013, 576, 5-12.
- S. Fang, L. Wang, Z. Sun, N. Feng, C. Shen, P. Lin, H. Wan and G. Guan, Catalysis Communications, 2014, 49, 15-19.
- M. Ao, G. H. Pham, V. Sage and V. Pareek, Journal of Molecular Catalysis A: Chemical, 2016, 416, 96-104.
- A. Bueno-López, Applied Catalysis B: Environmental, 2014, 146, 1-11.
- G. Carabalí, E. Chavira, I. Castro, E. Bucio, L. Huerta and J. Jiménez-Mier, Radiation Physics and Chemistry, 2012, 81, 512-518.
- V. Celorrio, L. Calvillo, E. Dann, G. Granozzi, A. Aguadero, D. Kramer, A. E. Russell and D. J. Fermín, Catal. Sci. Technol., 2016, 6, 7231-7238.
- D. H. Prasad, S. Y. Park, E. O. Oh, H. Ji, H. R. Kim, K. J. Yoon, J. W. Son and J. H. Lee, Applied Catalysis A: General, 2012, 447-448, 100-106.
- S. B. Simonsen, S. Dahl, E. Johnson and S. Helveg, Journal of Catalysis, 2008, 255, 1-5.
- C. Su and P. J. McGinn, Catalysis Communications, 2014, 43, 1-5.
- J. Yu, D. Mao, G. Lu, Q. Guo and L. Han, Catalysis Communications, 2012, 24, 25-29.
- K. Zhao, A. Zheng, H. Li, F. He, Z. Huang, G. Wei, Y. Shen and Z. Zhao, Applied Catalysis B: Environmental, 2017, 219, 672-682.
- V. Torregrosa-Rivero, V. Albaladejo-Fuentes, M.-S. Sánchez-Adsuar and M.-J. Illán-Gómez, RSC Adv., 2017, 7, 35228-35238.
- S. Wagloehner, J. N. Baer and S. Kureti, Applied Catalysis B: Environmental, 2014, 147, 1000-1008.
- H. Taguchi, K. Matsu-ura, M. Takada and K. Hirota, Journal of Solid State Chemistry, 2012, 190, 157-161.
- M. Y. Song, D.-S. Yang, K. P. Singh, J. Yuan and J.-S. Yu, Applied Catalysis B: Environmental, 2016, 191, 202-208.
- G. Tong, X. Lan, Z. Song, G. Li, H. Li, L. Yu, J. Xu, Y. Jiang, Y. Sheng, Y. Shi and K. Chen, Materials Today Energy, 2017, 5, 173-180.
- L. Wang, M. Al-Mamun, Y. L. Zhong, L. Jiang, P. Liu, Y. Wang, H. G. Yang and H. Zhao, Sustainable Energy Fuels, 2017, 1, 1013-1017.
- L. Wang, S. Fang, N. Feng, H. Wan and G. Guan, Chemical Engineering Journal, 2016, 293, 68-74.
- X. Zhang, Y. Li, H. Li and W. Shen, Journal of Natural Gas Chemistry, 2012, 21, 113-118.
- S. Wagloehner, M. Nitzer-Noski and S. Kureti, Chemical Engineering Journal, 2015, 259, 492-504.
- C. Su and P. J. McGinn, Applied Catalysis B: Environmental, 2013, 138-139, 70-78.
- S. Tu, H. Huang, T. Zhang and Y. Zhang, Applied Catalysis B: Environmental, 2017, 219, 550-562.
- T. Andana, M. Piumetti, S. Bensaid, N. Russo, D. Fino and R. Pirone, Applied Catalysis B: Environmental, 2016, 197, 125-137.
- E. D. Bans, M. A. Ulla, E. E. Mir and V. G. Milt, 2013, DOI: 10.5772/54516.
- P. L. Benjaram M. Reddy, Pankaj Bharali, Pranjal Saikia, Gode Thrimurthulu, Martin Muhler, and Wolfgang Gru, J. Phys. Chem., 2007, 4, 123-129.
- D. Meziani, A. Reziga, G. Rekhila, B. Bellal and M. Trari, Energy Conversion and Management, 2014, 82, 244-249.
- N. Guillén-Hurtado, A. García-García and A. Bueno-López, Journal of Catalysis, 2013, 299, 181-187.
- W. Y. Hernández, M. N. Tsampas, C. Zhao, A. Boreave, F. Bosselet and P. Vernoux, Catalysis Today, 2015, 258, 525-534.
- A. M. Hernández-Giménez, D. Lozano-Castelló and A. Bueno-López, Applied Catalysis B: Environmental, 2014, 148-149, 406-414.
- C. P. Helen Oois Matheyne Provendier, Alain Kiennemann, Surface Chemistry and Catalysis, 2001, 2, 123-128.
- Y. Gordienko, T. Usmanov, V. Bychkov, V. Lomonosov, Z. Fattakhova, Y. Tulenin, D. Shashkin and M. Sinev, Catalysis Today, 2016, 278, 127-134.
- T. Hamzehlouyan, C. Sampara, J. Li, A. Kumar and W. Epling, Applied Catalysis B: Environmental, 2014, 152-153, 108-116.
- A. Jiamprasertboon, Y. Okamoto, Z. Hiroi and T. Siritanon, Ceramics International, 2014, 40, 12729-12735.
- A. Hernández-Giménez, D. Castelló and A. Bueno-López, Chemical Papers, 2014, 68.
- Z. Z. Jian Liu, Chunming Xu, Aijun Duan, and Guiyuan Jiang, Ind. Eng. Chem. Res, 2010, 49, 3112–3119.
- C. Lee, Y.-G. Shul and H. Einaga, Catalysis Today, 2017, 281, 460-466.
- V. La Parola, G. Pantaleo, F. Deganello, R. Bal and A. M. Venezia, Catalysis Today, 2017, DOI: 10.1016/j.cattod.2017.04.045.
- Z. Li, M. Meng, Y. Zha, F. Dai, T. Hu, Y. Xie and J. Zhang, Applied Catalysis B: Environmental, 2012, 121-122, 65-74.
- Y. Mahara, H. Ishikawa, J. Ohyama, K. Sawabe and A. Satsuma, Catalysis Today, 2016, 265, 2-6.
- X. Han, Y. Wang, H. Hao, R. Guo, Y. Hu and W. Jiang, Journal of Rare Earths, 2016, 34, 590-596.
- D. Salinas, G. Pecchi, V. Rodríguez and J. L. G. Fierro, Modern Research in Catalysis, 2015, 04, 68-77.
- W. P. Stege, L. E. Cadús and B. P. Barbero, Catalysis Today, 2011, 172, 53-57.
- D. Fino, S. Bensaid, M. Piumetti and N. Russo, Applied Catalysis A: General, 2016, 509, 75-96.
- A. Toshniwal and V. Kheraj, Solar Energy, 2017, 149, 54-59.
- K. Wang, J. Song, X. Duan, J. Mu and Y. Wang, New J. Chem., 2017, 41, 8554-8560.
- A. B. Djurišić, F. Z. Liu, H. W. Tam, M. K. Wong, A. Ng, C. Surya, W. Chen and Z. B. He, Progress in Quantum Electronics, 2017, 53, 1-37.
- B. L. Farrell and S. Linic, Catal. Sci. Technol., 2016, 6, 4370-4376.
- Q. Fan, S. Zhang, L. Sun, X. Dong, L. Zhang, W. Shan and Z. Zhu, Chinese Journal of Catalysis, 2016, 37, 428-435.
- S. Ascaso, M. Elena Gálvez, P. Da Costa, R. Moliner and M. J. Lázaro Elorri, Comptes Rendus Chimie, 2015, 18, 1007-1012.
- F. Bin, C. Song, G. Lv, J. Song, C. Gong and Q. Huang, Industrial & Engineering Chemistry Research, 2011, 50, 6660-6667.
- C. M. Campos, G. Pecchi, A. B. Antunes and O. Peña, Journal of Physics: Conference Series, 2010, 200, 032010.
- C. Cao, L. Xing, Y. Yang, Y. Tian, T. Ding, J. Zhang, T. Hu, L. Zheng and X. Li, Applied Surface Science, 2017, 406, 245-253.
- J. Chandradass, H. Kim and F. W. Y. Momade, Advanced Powder Technology, 2014, 25, 1834-1838.
- M. R. Benjaram, T. Gode and L. Katta, Chinese Journal of Catalysis, 2011, 32, 800-806.
- R. Del Toro, P. Hernández, Y. Díaz and J. L. Brito, Materials Letters, 2013, 107, 231-234.
- T. Qing, D. Jun, X. Bin, Y. Yu, Y. Wenchong and T. Changyuan, Journal of Rare Earths, 2017, DOI: 10.1016/j.jre.2017.06.010.
- L. Djoudi and M. Omari, Journal of Inorganic and Organometallic Polymers and Materials, 2015, 25, 796-803.
- J. Chen, M. Shen, X. Wang, G. Qi, J. Wang and W. Li, Applied Catalysis B: Environmental, 2013, 134-135, 251-257.
- E. Aneggi, N. J. Divins, C. de Leitenburg, J. Llorca and A. Trovarelli, Journal of Catalysis, 2014, 312, 191-194.
- V. Di Sarli and A. Di Benedetto, Chemical Engineering Science, 2015, 137, 69-78.

This work is licensed under a Creative Commons Attribution 4.0 International License.
![]()
A New Edition of Web of Science
Journal Impact Factor
2022: 0.5
Five Year: 0.8
Journal is Indexed in

Cabells Whitelist
![]()


