Accumulation of Heavy Metals in Farmed Lates Calcarifer of a Tropical Coastal Lagoon
Tengku Nur Alia T. K. A1, Nurulnadia M. Y1, Zaleha K2, Ahmad A3, Pradit S4 and Ong M. C*1

1School of Marine and Environmental Sciences, Universiti Malaysia Terengganu, 21030 Kuala Nerus, Terengganu, Malaysia.
2Kulliyyah of Science, International Islamic University Malaysia, 25200 Kuantan, Pahang, Malaysia.
3Marine Fishery Resources Development and Management Department, Southeast Asian Fisheries Development Center (SEAFDEC), 21080 Chendering, Terengganu, Malaysia.
4Coastal Oceanography and Climate Change Research Center, Marine and Coastal Resources Institute, Prince of Songkla University, 90110, Thailand.
Corresponding Author E-mail: ong@umt.edu.my
DOI : http://dx.doi.org/10.13005/ojc/350339
Download this article as:
![]()
Heavy metals content in seafood, especially fish species has been of increasing concern to the human health. Nowadays, with increasing dependency towards farmed fish for sources of dietary protein and essential minerals, this heavy metals contamination in fishes are still questionable. This study aimed to investigate the accumulation of heavy metals in farmed fish, Lates calcarifer different organs from Setiu tropical coastal lagoon, Terengganu, Malaysia throughout its out-growing phase in the farm from the fingerling release up to their marketable size. Selected heavy metals namely Cu (Max:291.5±99.31), Zn (Max: 84.89±12.76), As (Max: 26.01±5.170), Cd (Max: 1.634±0.014), Hg (Max: 0.165±0.029) and Pb (Max: 0.634±0.550) in the fish was analyzed using ICP-MS after Teflon bomb closed digestion. The metal accumulation in each organ were generally found in the order of liver > gill > muscle. The concentrations of Cd and Zn in the liver were found to increase with fish size in each organ based on the association found in the principal component analysis (PCA). Meanwhile the overall findings observed negative correlation with L. calcarifer growth in fish size for all other heavy metals and organs. The amount of As in the fish muscle throughout its growth can be potentially harmful to humans with the highest averaged concentration at 3.29±0.65 mg/kg dw above the standard set by the Malaysian Food Regulation (1985) of more than 1 mg/kg. Meanwhile, all the other heavy metals were relatively safe and the concentrations well below the standard set by both national and international guidelines.
KEYWORDS:Farmed Later Calcarifer; Heavy Metals; Human Health Risk; Tropical Coastal Lagoon
Introduction
Heavy metal pollution have been well-discussed in the past decade to be a persistent issue that has come with global industrialization (Tarley et al., 2001). Heavy metals though naturally available has since been found at much elevated levels with many anthropogenic input in the environment where by the aquatic environment has largely taken the impact of such pollution. As inorganic chemical substances that are non-biodegradable, heavy metals accumulate in the environment that eventually ends up in the body of organisms which would continue to magnify as it moves up each trophic level such as fishes and ultimately to us humans. Some metals are essential to living organisms but they can be toxic at elevated levels in the body and some in which have no known biological function and are toxic even at low concentration. Most water bodies of rivers, lakes, lagoons which eventually lead out to ocean become a natural sink for these metal pollutants to collect and accumulate. Setiu Lagoon is surrounded by mangrove-dominated swamps which has become predominant sites for aquaculture where it becomes potential collecting sites for industrial disposal and urban wastes causing the aquatic environment there to act as a pollution sink (Moiseenko and Kudryavtseva, 2001; Poh et al., 2019).
In a study by Ahmad et al. (2016), 78% of Malaysians consumes fish at least twice per week and with fish consumption of 54 kg/person/year (Teh, 2012). Fishes have been known to bioaccumulate metals therefore fish consumption might be the one of the main source of metal intake into the human body. And as many of the fisheries resources have shown increased reliance towards aquaculture which have been slowly overtaking capture fisheries, there is little research which focuses on the metal pollution and bioaccumulation in fishes from that of cultured origin. However, there has been one study conducted in Malaysia by Taweel et al. (2011) on the tilapia fish in selected sites of Bangi, Selangor where the study compares metal content in the fish from those of cultured pond, rivers and lakes. A more recent study by Sobihah et al. (2018) have also observed the importance of heavy metals accumulation in estuarine maricultured fish from Pulau Ketam, Malaysia. Other notable studies focusing on marine fish aquaculture can be found from China (Liang et al., 2017; Wong et al., 2001) and Malaysia (Mok et al., 2012). Though fishes may accumulate metals through its dietary intake, as well as the bioavailability of the metals in its water environment and surrounding sediments (Bervoets and Blust, 2003), the size of organism have been found to affect their penchant towards metal accumulation (Kalay and Canli, 2000; Canli and Atli, 2003; Farkas et al., 2003), and this leads to the need to understand the relationship between organism size and metal accumulation.
There is yet to have any definite relationships established between metal concentration and fish size though it has been found that the accumulation in fish reaches a steady state at a certain age (Bervoets and Blust, 2001). Therefore this study aims to investigate the effect of fish growth on the metal accumulation in fish in a farmed environment. This would help in identifying at which size the metal levels in the fish could be of concern to the human health.
Materials and Methods
Sample Collection and Preparation
The fishes were taken from 3 cage farms where the fingerlings from the same batch of seedlings were grown out to their maturity. The first fish samples taken were for fishes in their first month after the seedling release (> 100mm) into the farm where the fishes have already acclimatized to the surrounding lagoon. The farming of the L. calcarifer follows a rotation system where they are sorted into different fish sizes as they grow at different rates.
The fish samples were always taken in the morning after feeding with disregard to the lagoon’s tidal influence. A total of 20 samples L. calcarifer were collected every month for a period of 7 months throughout their out-growing phase in the farm from their fingerling release up to their marketable size of about 400g. Increasing fish bodyweight of the fish taken every consecutive month is taken as the proxy of age of the fish farmed in the area. Figure 1 depicted the flow of the sample collection throughout each subsequent growth in fish size. Samples collected were then be transported back to the laboratory immediately in pre-cleaned polyethylene bags.
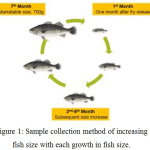 |
Figure 1: Sample collection method of increasing fish size with each growth in fish size. |
The samples were measured in standard length, weighed (to the nearest 0.1g) and then dissected for different organs of the gills, liver and muscle. All the samples were then dried in the oven at 60°C until a constant weight is achieved (dry weight) and then later homogenized by grounding into powder. Milli-Q water or de-ionized water was used to prepare all aqueous solutions. All the glassware and plastics were cleaned (acid-washed) in 10% nitric acid solution before being used.
Sample Analysis
0.05g of the homogenized fish tissue sample was weighed into the acid-washed Teflon digestion vessels. 1.5mL of suprapur nitric acid (HNO3) acid, Merck KGaA, Germany were then added into each vessel via closed Teflon bomb digestion, custom made, Japan (Ong et al., 2014; Ong et al., 2015; Ong et al., 2017). The prepared samples would then be placed in the oven for 8 hours at 100°C to allow complete digestion of the fish tissues. The digested samples were then transferred into centrifuge tubes and diluted with Milli-Q water up to 10 mL. The samples would then be ready for the determination of metal concentrations measured using the Inductively Coupled Plasma Mass Spectrometry, ICP-MS, Perkin Elmer ELAN 9000, USA (Kamaruzzaman et al., 2009; Ong et al., 2013). for selected metal elements (Cu, Zn, As, Cd, Hg and Pb). The principal component analysis (PCA) is the statistical analysis applied to analyze the relationship between the heavy metal accumulations in each organs of the fish with increasing fish size.
Result and Discussion
Average Fish Size
The measurements of fish growth are categorized by size in which the increase in fish size over time act as a proxy of age of the fish farmed in the area. The categorized fish growth can be seen in Table 1 where the first fish size is from the first month after fingerling release up to the average marketable size. After fish size 5 is the size at which the fishes would be typically harvested and sold in the market and thus, the size commonly accessible for consumers.
Table 1: Growth in fish size from fingerling up to their marketable size.
|
Growth Phase (n=20) |
Weight (g) |
|
1 |
27.50±2.600 |
|
2 |
68.49±14.00 |
|
3 |
144.3±31.20 |
|
4 |
237.9±34.90 |
|
5 |
473.2±85.90 |
| 6 |
513.4±72.80 |
| 7 |
591.2±122.6 |
The average fish weight was recorded with an exponential growth where the fish samples peaked at an average of about 600g in the last stage as depicted in Figure 2. This is the fish size that would be typically harvested and sold in the market and thus, the size commonly accessible for consumers. The average size of the fish taken from the fish farm is summarized in Table 2.
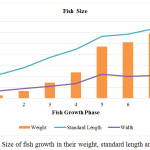 |
Figure 2: Size of fish growth in their weight, standard length and width. |
Table 2: Summary of average fish size.
|
Growth Phase (n=20) |
Weight (g) | Standard Length (cm) | Width (cm) |
|
1 |
27.50±2.600 | 10.79±0.300 | 3.300±0.100 |
|
2 |
68.49±14.00 | 14.04±1.800 | 4.495±0.600 |
|
3 |
144.3±31.20 | 18.60±1.600 | 5.530±0.600 |
| 4 | 237.0±34.90 | 22.38±1.000 |
6.730±0.500 |
| 5 | 473.2±85.90 | 29.35±2.300 |
10.00±0.800 |
| 6 | 513.4±72.80 | 28.30±1.400 |
11.08±0.700 |
| 7 | 591.2±122.6 | 31.80±1.800 |
10.50±1.100 |
Metal Accumulation with Fish Growth
The heavy metal accumulation in the fish organs is distinguished by each growth phase showed in Table 3. The heavy metal accumulation trend in the organs can be from highest in the order of liver > gills > muscle throughout the growth in fish sizes. Meanwhile the values of heavy metal in the L. calcarifer were in the order of Cu > Zn > As > Pb > Hg > Cd.
Copper, Zn and Cd were found to accumulate highest in the liver compared to all other organs. The levels of As, Hg and Pb however were found highest in the fish muscle that can be worrying to the human health from their consumption. Most of the heavy metals were found to accumulate higher in smaller fish sizes and much lower in larger fish sizes to the point of the heavy metals detected were found below the detection limit (BDL). This can be seen for Cu, Zn, and Cd in the muscle in growth phase 5 and 6, almost all heavy metals in the gills in fish sizes 6 and 7 (except Zn) and for As, Hg and Pb in the liver during growth phase 6 and 7.
Table 3: Average heavy metal concentrations in each organ with increasing growth phase, (n=20).
|
Organ |
Growth Phase |
Heavy Metal Concentration |
|||||
|
(mg/kg *dw) |
|||||||
|
Cu |
Zn |
As |
Cd |
Hg Pb |
|||
|
Muscle |
1 |
0.320±0.610 |
2.210±4.920 | 0.180±0.480 | 0.004±0.021 | 0.019±0.007 |
0.525±2.302 |
|
2 |
2.910±1.210 |
24.88±6.730 | 26.01±5.170 | 0.009±0.006 | 0.246±0.094 |
0.314±0.217 |
|
|
3 |
0.570±0.940 |
21.89±7.570 |
17.17±2.700 |
0.006±0.006 |
0.026±0.018 |
0.406±0.518 |
|
|
4 |
2.840±11.72 |
13.27± 2.810 |
16.93±3.680 |
0.001±16.93 |
0.136±0.016 |
0.030±0.102 |
|
|
5 |
**BDL (<0.026) |
12.29±7.120 | 20.02±3.660 | 0.003±0.009 |
0.165±0.029 |
0.062±0.049 |
|
|
6 |
BDL |
BDL (<0.120) | 6.410±6.360 |
BDL (<1×10⁻⁵) |
0.073±0.087 |
0.045±0.193 |
|
|
7 |
BDL |
3.470±3.110 | 12.88±9.530 | BDL | 0.082±0.138 |
0.130±0.118 |
|
|
Gills |
1 |
5.040±3.570 |
49.32±29.66 | 1.270±1.590 | 0.020±0.017 | 0.030±0.015 |
0.438±0.738 |
|
2 |
4.890±1.790 | 76.33±9.610 | 2.130±0.540 | 0.020±0.060 | 0.091±0.129 |
0.388±0.361 |
|
|
3 |
4.920±9.040 |
57.85±6.150 | 1.510±0.290 | 0.010±0.060 | 0.021±0.008 |
0.218±0.256 |
|
|
4 |
0.840±1.000 | 48.62±4.270 | 1.550±0.260 | 0.010±0.018 | 0.026±0.011 |
0.127±0.262 |
|
|
5 |
1.390±0.720 | 53.24±7.610 | 3.290±0.650 | 0.009±0.050 | 0.049±0.011 |
BDL (<2×10⁻⁵) |
|
|
6 |
2.290±2.490 | 73.88±23.24 | BDL (<0.007) | 0.002±0.013 | BDL (<9×10⁻⁵) | 0.380±0.285 | |
| 7 | BDL | 58.17±13.80 | BDL | BDL | BDL |
BDL |
|
|
Liver |
1 |
90.59±46.30 |
40.04±14.93 | 2.240±1.740 | 0.059±0.029 | 0.022±0.010 |
0.634±0.550 |
|
2 |
291.5±99.31 |
84.89±12.76 | 3.770±1.650 | 0.276±0.101 | 0.098±0.027 |
0.229±0.150 |
|
|
3 |
111.4±54.56 |
37.24±6.450 | 1.630±0.290 | 1.634±0.014 |
0.023±0.007 |
0.126±0.136 |
|
|
4 |
206.2±121.3 |
62.90±13.30 |
5.380±1.700 | 0.217±0.061 | 0.062±0.019 |
0.006±0.057 |
|
|
5 |
35.88±25.87 |
47.31±8.300 |
6.540±2.370 |
0.145±0.056 |
0.072±0.013 |
0.001±0.069 |
|
| 6 | 128.4±103.9 | 77.49±20.57 | BDL | 0.493±0.116 | BDL |
0.080±0.095 |
|
| 7 | 147.9±215.3 | 75.66±21.76 | BDL | 0.906±0.356 | BDL |
BDL |
|
*dw – dry weights; **BDL – below detection limit.
The accumulated heavy metal concentration accumulated was compared through each growth in fish size (1-7) to better understand the accumulation trends towards each organ as the L. calcarifer grows bigger in size. Each growth phase represents a certain mark in fish growth, where possible changes in metabolic capabilities and function in the organs is possible as they further develop and grow. The figure 3 shows the plot of loadings of the heavy metals in each organ along with the changes in fish size in two principal components (PCs), where PC1 (35.37% of variance) and PC2 (14.46% of variance) accounting for 49.84% of the total variance (Figure 4.2).
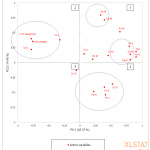 |
Figure 3: Plot of loadings on the first two principal components. |
Looking into the changes and growth in fish size on the heavy metal accumulation in the fish the study finds that the heavy metals studied showed to have little association between them with the exception of Cd and Zn in the liver as seen from the loading plot in Figure 3. Cd and Zn in the liver were the only heavy metals found to be closely associated and is greatly influenced by the overall growth in fish size of their length and weight. This indicates that the changes in fish size have an effect on the accumulation of Cd and Zn in the fish liver for the L. calarifer farmed in Setiu Lagoon. This was similarly observed of bream Abramis brama L. from a low contaminated site where the associations related to age and size were negative for Zn (Farkas et al., 2003).
The level of As an Hg in the muscle were found to be closely associated where their close association can also be seen in their similar levels in the liver as seen in Figure 3. The fish muscle has been noted to accumulate higher levels of As and is an efficient site of As storage which may lead to the higher As accumulation in the fish muscles than in the liver (Ciardullo et al., 2008; Mok et al., 2012). A study by Mok et al. (2012) observed that higher As levels in farmed L. calcarifer in the East Peninsular Malaysia were found to be mainly influenced by the culture system in the area of net cages in the sea than anthropogenic sources. Other fishes studied in Terengganu waters have also observed relatively higher levels of As accumulated in the fish muscle despite the studied comparison between seasons (Ong et al., 2018). Arsenic levels in two fish species from Miankaleh Wetland were also found to be the highest in the muscle (Alipour et al., 2016).
The level of As concentration in the liver and muscle were found to exceed the permissible level of more than 1.0 mg/kg wet weight (MFR, 1985) and as they accumulate with increased fish size this pose to be a worrying threat to fish health and inevitably human health from its consumption. Arsenic levels in each organ were accumulated in the order of liver > muscle > gills. Arsenic can be found naturally and especially more in the marine environment though there is no known biological function or metabolic roles and can be toxic in excess amount (Yudovich and Ketris, 2005). Though much less toxic to fishes compared to other heavy metals, As pose a threat to human health as it is a known carcinogen that can cause cancer to the skin, bladder, lung and liver (de Rosemond et al. 2008, Farrell et al. 2012). Despite being a non-essential element and a known toxic carcinogen to humans, As is often found high in seafood and is less acutely toxic in fishes as they are stored in organic form as Arsenobetaine (de Rosemond et al. 2008, Wood et al. 2012).
The higher levels of As and Hg in the fish muscle in this study are of worrying concern to the overall human health from the consumption of the L. calcarifer farmed in Setiu Lagoon. The increase in levels of As and Hg in the fish muscle with increase in fish size was however found to not be influenced by the overall increase in fish size as seen in the PCA loading plot in Figure 4.2.
Negative relation between heavy metal concentration and fish size were also observed where the metal levels decrease with increasing fish growth (Gracia-Montelongo et al., 1994; Canli and Atli, 2003; Farkas et al., 2003). One study had showed the negative relationship between heavy metal accumulations with fish size where the heavy metals (Cr, Mn, Ni, and Pb) levels were found to decrease with increase in fish length of Labeo umbratus (Nussey et al., 2000). Coincides to that, the similarly lowered Pb concentration with increased in Poecilia reticulate fish size were also reported by Widianarko et al. (2000). This is suggested by the growth dilution effect where fish growth as well as possible lowered metabolic activity could possibly lead to dilution of heavy metal concentration in the fish tissues (Mok et al., 2012). This is unless the heavy metal levels in the surrounding environment supersedes than the capacity of these factors in which may cause increase in heavy metal accumulation in the fish.
The overall outcome of this study has depicted no significant influence from the changes in fish size on the levels of heavy metal concentrations and have only showed to affect Cd and Zn in the liver.
Positive relationship between fish size and heavy metals accumulation have been observed where increasing fish size influences increased concentrations of heavy metals in the fish. The order of Hg levels in each organ were found as muscle > liver > gills. Typically, Hg are found to accumulate higher in concentration with increase in fish size and age (Björnberg et al., 2003; Erdoğrul and Erbilir, 2006; Łuczyńska and Brucka-Jastrzębska, 2006; Fokeena et al., 2015; Ahmad et al., 2016; Le et al., 2018) though despite such this study showed otherwise for Hg accumulation in all 3 organs. Instead, the accumulation of Hg in the liver and gills were found to have a significant negative relationship with increasing fish size where lowered Hg levels were found in larger fish sizes. Catfishes from Yangtze River also observed similar negative relations for Hg levels with increasing fish size which were assumed to be influenced by its metabolic activities (Yi and Zhang, 2012). Hg have been found to be relatively higher in the muscles compared to other organs which makes it ideal as an indicator of Hg contamination (Łuczyńska and Brucka-Jastrzębska, 2006). A study on farmed O. niloticus (tilapia) showed similar results where Hg was the most accumulated with the highest concentration in the muscle were the where it was also found to exceed the permissible limit in fish (Kaoud and El-Dahshan, 2010).
Metal accumulation in the fish have showed to vary in concentration changes with fish growth and have pointed how different organs have varying accumulation trend as the fish grows in size. Metabolic activity is a major factor in influencing the metals accumulation in the fish. Metabolic activity in younger and smaller individuals are usually higher than in older and larger individuals which may lead to higher metal accumulation in smaller and younger fishes as most metabolic rate in organisms are more than often size-specific (Nussey et al., 2000; Widianarko et al., 2000; Mok et al., 2012). Each organs have different and varying metabolic rates where the gills and liver with much higher metabolic rates tend to accumulate more metals than those less capable as in the muscle tissue. The liver is an active site for metal metabolism with specialized tissues and binding protein metallothionein allowing for higher metal accumulating capacity while the fish muscle is less active site for metabolic activities and are typically not the main site for metal accumulation with the exception of organic mercury (Ploetz et al. 2007; Bashir and Alhemmali, 2015).
Based on the national and international standards as in Table 4, the permissible amount of metal elements throughout the fish growth were found to meet the standards available with the exception of Arsenic. Despite the relatively higher levels of Hg in the fish muscle, they were still found to be within the limits set.
Table 4: Comparison with national and international standard limits (mg/kg wet weight.).
| MFR (1985) | EU(2006) | FAO/WHO(1989) | FSANZ(1987) | |
|
Cu |
– | – | – | – |
|
Zn |
– | – | – | – |
|
As |
1 | – |
– |
2 |
| Cd | 1 | 0.05 | 2 |
2 |
| Hg | 1 | 0.5 | 0.5 |
1 |
| Pb | 2 | 0.3 | 0.3 |
0.5 |
The permissible limit of As levels found in food and fish product should be a at a minimum of 1.0 mg/kg wet weight. (MFR, 1985) base on Table 4. But this study found that the L. calcarifer in Setiu Lagoon were at three times higher than the permissible limit. A study on heavy metal accumulation in commercial fishes in south west Malaysian coast also showed similar results (Kamaruzzaman et al., 2011). Then mud crabs from the same area in Setiu Wetland (Ong et al., 2017) were also found to have high levels of Cu and Zn that were above the permissible limit by Malaysian Food Regulation though they were still found within permissible limit in this study. Organic As (arsenobentine) absorption into the body from consumption of fish and crustaceans however have showed to be efficient in its absorption (>70%) and appears in the urine after 2 days (European Food Safety Authority, 2009). Despite such, urinary As is limited to only its recent exposure and uptake through consumption (Cascio et al., 2011) or as the consequential production from the metabolism of arsenosugars and arsenolipids found in seafood (Lai et al., 2004, Taylor et al., 2017). Therefore, considerations should be taken for the consumption of this L. calcarifer fish farmed in the area without neglecting the importance of fish in our daily diet.
Conclusion
The study findings showed that fish growth and subsequently the fish size does affect the heavy metal accumulation in the fish where the relationship in each organ varies with each heavy metal. Positive relationship was observed for Cd and Zn in the liver as the main site for metabolic activity and in regulating contaminants in the body. Meanwhile the overall findings observed negative correlation with L. calcarifer growth in fish size for all other heavy metals and organs. Despite such, the all the heavy metals accumulated in the fish throughout its growth were all well within the permissible limit set by national and international standards with the exception of As that far exceeded the Malaysian Food Regulation (1985) of 1 mg/kg. The high levels of As in the fish muscle were prominent even at earlier stages of its growth phase and found to only accumulate further as the fish grows in size. The heavy metal accumulation in each organ were found in the following order of liver > gills > muscle.
Conflicts of Interest
There is no conflict of interest.
Acknowledgements
This research was conducted with the funding from the Ministry of Education Malaysia, under the Niche Area Research Grant Scheme (NRGS) project number 53131. First of all, the authors wish to acknowledge their gratitude to the anonymous reviewers who gave freely time and effort, constructive recommendations that enhanced the value of this manuscript. The authors also wish to express their gratitude to Oceanography Laboratory, School of Marine and Environmental Sciences staff for their invaluable assistance and providing the facilities to carry out the research. The authors also would like to thank to Mr. Joseph Bidai for his assistant in detection heavy metals using ICPMS at Institute of Oceanography and Environment.
References
- Ahmad, N. I.; Wan Mahiyuddin, W. R.; Tengku Mohamad, T. R.; Ling, C. Y.; Daud, S. F.; Hussein, N. C.; Abdullah N.A.; Shaharudin R.; Sulaiman, L. H. Nutr. Res. 2016, 60(1), 32697.
- Alipour, H.; Pourkhabbaz, A.; Hassanpour, M. Water Quality, Exposure and Health. 2015, 7(2), 179-185.
- Bashir, F. A.; Alhemmali, E. M. In The Second Symposium on Theories and Applications of Basic and Biosciences(Vol. 5), September 2015. Misurata, Libya.
- Bervoets, L.; Blust, R. Pollut. 2003, 126(1), 9-19.
- Björnberg, K. A.; Vahter, M.; Petersson-Grawe, K.; Glynn, A.; Cnattingius, S.; Darnerud, P. O.; Atuma, S.; Aune, M.; Becker, W.; Berglund, M. Health Perspect. 2003, 111(4), 637.
- Canli, M.; Atli, G. Pollut. 2003, 121(1), 129-136.
- Canli, M.; Furness, R. W. Environ. Res. 1993, 36, 217–36.
- Cascio, C.; Raab, A.; Jenkins, R. O.; Feldmann, J.; Meharg, A. A.; Haris, P. I. J Environ Monit . 2011, 13(2), 257-265.
- Ciardullo, S.; Aureli, F.; Coni, E.; Guandalini, E.; Iosi, F.; Raggi, A.; Rufo, G.; Cubadda, F. Agric. FoodChem.. 2008, 56(7), 2442-2451.
- Commision, E. C. Commission Regulation (EU) No 1881/2006 of 19 December 2006 setting maximum levels for certain contaminants in foodstuff. 2006, 2006R1881-EN-01.09. 2014-014.001-1.
- De Rosemond, S.; Xie, Q.; Liber, K. Monit. Assess.2008, 147(1-3), 199-210.
- Erdoğrul, Ö.; Erbilir, F. Monit. Assess. 2006, 130(1-3), 373-379.
- European Food Safety Authority (2005). Opinion of the Scientific Panel of Contaminants in the food chain related to mercury and methylmercury in fish. Retrieved from http://www.efsa.europa.eu/EFSA/efsa_locale-1178620753812_1178620763245.html
- FAO/WHO. Evaluation of certain food additives and the contaminants mercury, lead and cadmium. WHO Technical Report Series No. 505. 1989.
- Farkas, A.; Salánki, J.; Specziár, A. Water Res. 2003, 37, 959–64.
- Farrell, N. Springer Science & Business Media. 2012, 4-6.
- Fokeena, W. B.; Jamaluddin, R.; Khaza’ai, H. Asian J. Clin. Nutr.2015, 7(2), 45-54.
- FSANZ (Food Standards Australia and New Zealand). (1987). Food standards code. Authority/Information Australia.
- García-Montelongo, F.; Díaz, C.; Galindo, L.; Larrechi, M. S.; Rius X. Mar. 1994, 58, 179–183.
- Kalay, M.; Canli, M. J. Zool. 2000, 24: 429–436.
- Kamaruzzaman, B. Y.; Ong, M. C.; Jalal, K. C. A.; Shahbudin, S.; Nor, O. M. Environ. Biol.. 2009, 30(5), 821.
- Kamaruzzaman, B. Y.; Rina, Z.; John, B. A.; Jalal, K. C. A. res. j. environ 2011, 5(6), 595-602.
- Kaoud, H. A.; El-Dahshan, A. R. Sci.2010, 8(4), 147-156.
- Lai, V. W. M.; Sun, Y.; Ting, E.; Cullen, W. R.; Reimer, K. Appl. Pharmacol. 2004, 198(3), 297-306.
- Le, D. Q.; Satyanarayana, B.; Fui, S. Y.; Shirai, K. Biol Trace Elem Res. 2018, 1-8.
- Liang, P.; Feng, X.; You, Q.; Gao, X.; Xu, J.; Wong, M.; Peter, C.; Wu, S. C. Environ Sci Pollut R. 2017, 24(33), 25923-25932.
- Łuczyńska, J.; Brucka-Jastrzębska, E. J. Food Nutr. Sci. 2006, 15(2), 141-146.
- MFR (Malaysian Food Regulation). Malaysian law on food and drugs. 1985 Retrieved from https://extranet.who.int/nutrition/gina/sites/default/files/MYS%201985%20Food%20Regulations_0.pdf
- Moiseenko, T. I.; Kudryavtseva, L. P. Pollut. 2001, 114(2), 285-297.
- Mok, W. J.; Senoo, S.; Itoh, T.; Tsukamasa, Y.; Kawasaki, K. I.; Ando, M. Food Chem. 2012, 133(4), 1326-1332.
- Nussey, G.; Van Vuren, J. H. J.; Du Preez, H. H. Water SA. 2000, 26(2), 269-284.
- Ong, M. C.; Joseph, B.; Shazili, N. A. M.; Ghazali, A.; Mohamad, M. N. J Asian Earth Sci 2015, 8(3), 74.
- Ong, M. C.; Menier, D.; Shazili, N. A. M.; Kamaruzzaman, B. Y.Orient j. chem.. 2013, 29(1), 39-45.
- Ong, M.C.; Gan, S.L. Pollut. Bull. 2017, 124(2), 1001-1005.
- Ong, M.C.; Norhazirah, A.A.; Shazili, N.A.M.; Kamaruzzaman, B.Y. Sustain. Sci. Manag. 2018, 13, 29-38.
- Ong, M.C.; Yong, J.C.; Khoo, X.Y.; Tan, Y.F.; Joseph, B. Environ. Biol. 2014, 8(14), 91-98.
- Ploetz, D. M.; Fitts, B. E.; Rice, T. M. Environ. Contam. Toxicol. 2007, 78(2), 134-137.
- Poh, S. C.; Ng, N. C. W.; Suratman, S.; Mathew, D.; Tahir, N. M. Environ Monit Assess. 2019, 191(1), 3.
- Sobihah, N. N.; Zaharin, A. A.; Nizam, M. K.; Juen, L. L.; Kyoung-Woong, K. Chemosphere. 2018, 197, 318-324.
- Tarley, C.; Coltro, W.; Matsushita, M.; de Souza, N. Food Compos. Anal. 2001, 14(6), 611-617. http://dx.doi.org/10.1006/jfca.2001.1028
- Taweel, A.; Shuhaimi-Othman, M.; Ahmad, A. K. J. Biotechnol. 2011, 10(55), 11562-11566.
- Taylor, V.; Goodale, B.; Raab, A.; Schwerdtle, T.; Reimer, K.; Conklin, S.; Karagas, M. R.; Francesconi, K. A. Sci Total Environ. 2017, 580, 266-282.
- Teh, E. SEA VIEWS, 2012. 10, 1-4.
- Widianarko, B.; Van Gestel, C. A. M.; Verweij, R. A.; Van Straalen, N. M. Ecotoxicol Environ Saf. 2000, 46(1), 101-107.
- Wong, C. K.; Wong, P. P. K.; Chu, L. M. (2001). Environ. Contam. Toxicol. 2001, 40(1), 60-69.
- Woody, C. A.; O’Neal, S. L. The Nature Conservancy. 2012. Alaska
- Yi, Y. J.; Zhang, S. H. Procedia Environ. Sci. 2012, 13, 1699-1707.
- Yudovich, Y. E.; Ketris, M. P. Int. J. Coal Geol. 2005, 61(3-4), 141-196.
Accepted on: 12-06-2019


![]()


