Antioxidant Potential of Zingiber Officinale Rhizome and Fagara Zanthoxyloides Root Extracts and Their Application in Soybean Oil During Accelerated Storage
Abimbola Peter Oluyori , Inyinbor Abosede Adejumoke, Dada Adewumi Oluwasogo, Oyedepo Grace Olapeju, Abodunrin Temitope Olabisi and Awolesi Oluwafemi
Department of Physical Sciences, Landmark University, Omu-Aran, Kwara State.
Corresponding Author E-mail: oluyori.abimbola@lmu.edu.ng.com
DOI : http://dx.doi.org/10.13005/ojc/350239
Article Received on : 16-10-2018
Article Accepted on : 17-03-2019
Article Published : 03 Apr 2019
The oxidative instability of vegetable oils which contain polyunsaturated fatty acids and the health implication of synthetic antioxidants is the reason for the current intensive search for safer natural antioxidants. Hence, the total phenolic content and 2,2-diphenyl-1-picryhydrazyl (DPPH) radical scavenging activity of Fagara zanthoxyloides root and Zingiber officinale rhizome have been comparatively evaluated. Zingiber officinale cold extract (GC) exhibited highest DPPH scavenging activity as well as the highest TPC while the hot extract from Fagara zanthoxyloides root (FH) had more phenolic content than its cold counterpart. Consequently, the anti-oxidative potential of refined soybean oil fortified with GC and FH was investigated at 65°C (accelerated storage temperature) for a lenght of 24 days. Established indicators such as peroxide, p-anisidine and total oxidation value (TOTOX) were used to monitor the extent of lipid deterioration with butylated hydroxyanisole (BHA) as the positive control. Generally, GC was more effective in stabilizing the soybean oil. After 24 days of storage, soybean oil fortified with GC, FH and BHA achieved 68.58%, 57.50% and 67.56% retardation in the formation of primary oxidation products respectively. The lowest TOTOX (146.38) value was also observed in GC supplemented oil, suggesting that GC could be effectively employed as a replacement for BHA in soybean oil preservation. Hence, extracts from Zingiber officinale rhizome and Fagara zanthoxyloides roots can be explored as sources of natural antioxidants for application in the food industry.
KEYWORDS:Antioxidants; Fagara Zanthoxyloides; Ginger; Preservation; Soybean Oil
Download this article as:| Copy the following to cite this article: Oluyori A. P, Adejumoke I. A, Oluwasogo D. A, Olapeju O. G, Olabisi A. T, Oluwafemi A. Antioxidant Potential of Zingiber Officinale Rhizome and Fagara Zanthoxyloides Root Extracts and Their Application in Soybean Oil During Accelerated Storage. Orient J Chem 2019;35(2). |
| Copy the following to cite this URL: Oluyori A. P, Adejumoke I. A, Oluwasogo D. A, Olapeju O. G, Olabisi A. T, Oluwafemi A. Antioxidant Potential of Zingiber Officinale Rhizome and Fagara Zanthoxyloides Root Extracts and Their Application in Soybean Oil During Accelerated Storage. Orient J Chem 2019;35(2). Available from: https://bit.ly/2CLXLL1 |
Introduction
In the face of obvious advantages associated with the consumption of polyunsaturated fatty acids, lipid peroxidation has continued to be a major challenge.1 Lipid peroxidation occurs at different stages: during manufacturing, storage, distribution and during food preparation. Among the strategies employed for stabilizing food/ preventing lipid oxidation, addition of antioxidants has been reported to be most effective, convenient and economical.2 Currently, many food industries make use of synthetic antioxidants such as butylated hydroxyl anisole, butylated hydroxyl toluene, propyl gallate, and tert-butyl hydroxylquinone, some of which have been suspected to possess carcinogenic tendencies.3 Therefore, the replacement of these synthetic antioxidants with natural antioxidants such as plant extracts or fractions therefrom in food products will make for better acceptability and consumer safety.
Several plant extracts such as thyme, green tea, rosemary,4 grape seed, pine bark, oleoresin rosemary, Ferulago angulata essential oil,1 edible wild mushroom (crude extract and fractions),5 and polyphenols in apple peels6 have been successfully investigated for their antioxidant effects in lipid products such as meat, vegetable oil, etc. However, ginger rhizome and fagara zanthoxyloids root have not been investigated as was done in this study. Previous studies only established varying amount of antioxidant activity in ginger rhizome and Fagara zanthoxyloides roots.7,8 Hence, the aim of this research is to investigate the effectiveness of these two popular spices, which have found different oral applications, in the stabilization of soybean oil.
Materials and Method
Sample Preparation
Fagara zanthoxyloides root needed for this study was collected from a local farm in Omu-Aran, kwara State while Zingiber officinale rhizome and the soybean oil were sourced locally from markets in Omu-aran (Kwara State) and Ibadan (Oyo State) respectively. The rhizomes/ roots were air-dried and afterwards cut into little chips in preparation for extraction.
Extraction
Dry chipped sample (50 g) of each plant was extracted with 500ml of absolute ethanol. The hot ethanolic extraction was carried out using the soxhlet apparatus while the cold extraction was carried out by maceration. Extracts obtained from the hot extraction were concentrated at 95⁰C via simple distillation while the extracts from maceration were concentrated at 50⁰C with the aid of a rotary evaporator.
Qualitative Phytochemical Screening
Established qualitative phytochemical tests were employed out to detect the presence of alkaloids, flavonoids, terpenoids, saponins, and phenolics in both categories of extracts using established procedures.9,10
Estimation of Total Phenolic Content
The total phenolic content of Ginger rhizome and Fagara zanthoxyloides root extracts was determined by following the Folin-ciocalteu procedure reported by Zhao and Hall.11 In brief, 1 cm3 of the plant extract was placed in a boiling tube and 1 cm3 of Folin-Ciocalteu’s solution (diluted by 10) was added. After 3 minutes, 1 cm3 of 7.5% sodium carbonate solution was added and the entire mixture was made up to 30 cm3 with deionized water. After vigorous shaking, the mixture was allowed to stand at room temperature in a dark environment for 90 minutes. Using a spectrophotometer (UV-VISIBLE SPECTROPHOTOMETER, JENWAY-6705), the ultraviolet absorbance of the whole solution was taken against blank reagent at 765nm. Gallic acid calibration curve was prepared by using 1000, 500, 250, 130 and 70 µg/ml gallic acid concentrations and the results were expressed in mg/g Gallic acid equivalent of extract. All experiments were performed in duplicate.
DPPH Radical Scavenging Activity
The quantitative determination of the free radical scavenging potential of each extract was carried out spectrophotometrically using the DPPH radical as described by Ayoola et al.,12 with some modification. Exactly 3ml of 0.1mM DPPH was placed in a test tube containing 1ml of the extract. The mixture was kept in a dark environment for 30 minutes and afterwards, the absorbance of the resulting solution was recorded at 517nm using methanol as blank. All experiments were carried out in duplicate and the percentage DPPH radical scavenging potential was calculated using the following equation:
Where Cb is the absorption of DPPH in methanol and Ca is the absorption of the solution containing the extract.
Determination of Oxidative Stability
Sample Preparation
The oxidative stability of soybean oil samples was enhanced with plant extracts and monitored under accelerated storage condition at 65°C over a 24 day period as described by Iqbal and Bhanger13 with a little modification. In brief, 250 cm3 samples of preheated soybean oil (50°C for 3 hours) were supplemented with 200ppm of each plant extract, homogenized with a magnetic stirrer on a hot plate and monitored for a period of 24 days (One day in the oven = One month of storage at room temperature).
BHA was used as reference at its legally allowable limit (200 ppm). All the bottles were wrapped with aluminium foil to create a dark environment before they were stored in the oven.
The determination of peroxide and p-anisidine values was used to monitor oxidative changes at 6 days interval throughout the accelerated storage period.
Peroxide Value
The peroxide value was determined by adopting an AOAC method 965.33 as described by O’Keefe and Pike14 with little modification. To 5.00 gsoybean oil sample, 30 cm3 of glacial acetic acid:chloroform (3:2, v/v) followed by 0.5 cm3 of saturated potassium iodide solution was added. The mixture was allowed to stand with occasional shaking for a minute. Thereafter, 30 cm3 of distilled water was added and the solution was slowly titrated against freshly prepared 0.05M sodium thiosulphate (Na2S2O3) solution until a reduction in the intensity of the yellow color is observed. After adding 0.5 cm3 of 1% starch solution, the titration was continued until the blue color of the mixture disappears. The end point used to calculate the PV by using the formula,
where V is the volume of (Na2S2O3) used and C is the concentration of (Na2S2O3) in mol/dm3.
Peroxide value was expressed as milliequivalent/kg of the various oil samples.
Para-Anisidine Value
The para-anisidine value (pAnV) of oil samples was also determined by using an AOCS method (Cd 18-90) as described by O’Keefe and Pike (14). In summary, 2 g of the soybean oil sample was dissolved in 25 cm3 of isooctane and 5cm3 of the mixture above was mixed with 1cm3 of 0.25% solution of para-anisidine in glacial acetic acid (w/v). The mixture was shaken vigorously and kept in the dark for 10 minutes after which the absorbance of the mixture was recorded at 350nm in a UV spectrophotometer and the pAnV was calculated as follows:
Where Ar = absorbance of test solution after its reaction with p-anisidine reagent
Calculation of Total Oxidation Value
Total oxidation values (TOTOX values) of all oil samples were calculated by substituting for PV and pAnV values in the equation:
TOTOX value = 2PV + pAnV
Statistical Analysis
Each measurement was duplicated and the results were expressed as mean ± standard deviation. Two-way analysis of variance and Dunnett’s multiple comparisons test were carried out to compare the mean values using Prism 6-Graphpad 2018 (Japan) at 95% confidence level (p < 0.05).
Results and Discussion
Extraction and Phytochemical Tests
The hot and cold extractions were successful, yielding various extracts: Ginger Cold (GC), Ginger Hot (GH), Fagara zanthoxyloides Cold (FC) and Fagara zanthoxyloides Hot (FH) with 2.13%, 3.49%, 2.65 % and 4.68% percentage yields respectively. Thus, the yield of the hot extraction was higher than the cold in both experiments. Furthermore, the preliminary phytochemical screening revealed the presence of some important classes of secondary metabolites (Table 1).
Table 1: Qualitative phytochemical screening of extracts from Ginger rhizome and Fagara zanthxyloides roots.
The presence of saponins and terpenoids in ginger could imply advantageous antimicrobial properties while the prominent detection of flavonoids and phenolics is directly suggestive of prominent antioxidant quality.10,15
Total Phenolic Content
Phenolic compounds usually scavenge free radicals by using their hydrogen moiety. Hence, in this study, the quantitative presence of phenolic constituents in all the extracts was estimated using Folin-Ciocalteu method. The garlic acid calibration curve generated from the analysis can be expressed by the following linear equation: y = 0.3721x + 0.162; R2 = 0.964 and the results are represented in figure 1.
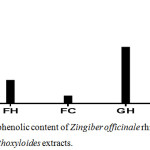 |
Figure 1: Total phenolic content of Zingiber officinale rhizome and Fagara zanthoxyloides extracts. |
Generally, the estimated phenolic content of presence in Zingiber officinale rhizome extract was higher than that of Fagara zanthoxyloides root. The total phenolic content of GC and GH in mg GAE/g were found to be of 618.45 and 462.24 of dry extract respectively while that of FC and FH were 59.00 and 188.46 mg GAE/g of dry extract respectively. Extraction process exhibited a distinct effect on the concentration of phenolics in each extract just as was earlier observed by Gallardo et al.16
Although the percentage yield of GH was higher than that of GC, the GH phenolic content was lower than that of GC suggesting that some of the phenolic compounds could be thermolabile. However, the phenolic content in FH was higher than that of FC, indicating that the inherent phenolic compounds are thermally stable. This observation is in line with the report of Semwal et al.17 which showed that gingerol, a major constituent of ginger rhizome, is thermolabile while some antioxidant benzoic acid derivatives which have been previously reported in Fagara zanthoxyloides roots are relatively thermally stable.24,25
In a previous research, the total phenolic content of methanolic ginger extract was 181.41 mgGAE/g ginger extract18 while Stoilova et al.,19 in their investigation of total phenolic content of ginger extract estimated the total phenolic content of ginger rhizome to be as high as 871 mgGAE/g ginger extract. Our findings in this research closely associates with the result of Stoilova et al.19 Factors responsible for such variation in phenolic content include plant genetics, soil, growth condition, maturity, and storage conditions.20
DPPH Radical Scavenging Activity
The percentage DPPH radical scavenging activities of different concentrations of ginger rhizome and Fagara zanthoxyloides root extracts from hot and cold extraction process is depicted in Figure 2. At a concentration of 0.2 mg/ml, GC extract among all the plant extracts exhibited the highest free radical scavenging activity of 88.72% (IC50 value of 0.048 mg/ml), followed by GH with a lower free radical scavenging activity of 83.84% (IC50 value of 0.056). Generally, Fagara zanthoxyloides root extracts exhibited a low radical scavenging activity when compared to ginger rhizome extract. FH ethanolic extract exhibited a radical scavenging activity of 16.98% (IC50 value of 0.174 mg/ml) while the DPPH radical scavenging activity of FC extract was found to be 15.23% (IC50 value of 0.248 mg/ml) which appears to be the lowest among all the investigated plant extracts. It is important to note that higher phenolic content corresponded to higher DPPH scavenging activity just as was earlier reported.10
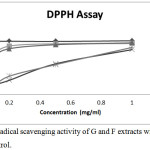 |
Figure 2: DPPH radical scavenging activity of Zingiber officinale and Fagara zanthoxyloides root extracts. |
Soybean Oil Stabilization
The results from the total phenolic content determination and DPPH scavenging activity revealed that GC and FH possessed the higher phenolic content and the higher DPPH radical scavenging potential among both set of plant extracts. Hence, the two were investigated further for their ability to provide stabilization in soybean oil under accelerated condition using peroxide and p-anisidine values as indicators.
Peroxide Value (PV)
Peroxide value is a parameter which helps to evaluate the degree of initial oxidation of oils and fats. Thermally induced oxidation had significant effects on the rate of deterioration of soybean oil as indicated by the PV (p < 0.0001). Interestingly, GC exhibited better inhibition towards the formation of primary oxidation products compared to BHA as shown in Figure 3.
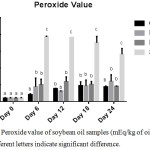 |
Figure 3: Peroxide value of soybean oil samples (mEq/kg of oil sample), n=2; Different letters signify significant difference. |
The PV of GC-SBO increased with time until day 18 (47.56 mEq/kg) after which a decline was observed on the 24th day (44.37 mEq/kg). The observed decrease in PV after the 18th storage day may be due to the volatile nature of the oxidation products which peroxide value generally indicates.13 These primary oxidation products (Lipid hydroperoxides) are consequently broken down into volatile/ non-volatile secondary products leading to drastic reduction in oil quality (21). The highest PVs observed in each experiment were 47.56 mEq/kg at day 18, 60.03 meq/kg at day 24, 59.45 mEq/ kg at day 12, and 192.85 mEq/kg at day 6 for GC, FH, BHA and S respectively. Particularly, the rise in the PV of SBO was drastic within the first 6 days of storage (6 months of storage at ambient temperature) after which a gradual decline followed. This further shows the important need to fortify consumption oriented soybean oil with natural antioxidants.
The maximum PV recorded in this research (192.85 mEq/kg oil) is comparable to the maximum PV (179.1 mEq O2 / kg oil) reported by Franco et al.,22 at day 16 of unfortified soybean oil under accelerated storage. On day-24 (the end of this storage period), the PV of BHA-SBO was retarded by 67.56%, while the percentage retardation of the formation of peroxide was 57.5% for FH-SBO and 68.58% for GC-SBO, relative to SBO.
This comparatively higher antioxidant effect of GC extract in the inhibition of hydroperoxides is definitely due to the presence of higher quantity of phenolic compounds in the ethanolic extract of ginger rhizome while the TPC of both cold and hot extracts of Fagara zanthoxyloides root are less effective. Since notable antioxidant efficiency was recorded in GC-SBO and FH-SBO, the extracts can be rated high on the list of plant and animal sources which have been successfully investigated as substitutes to synthetic antioxidants in soybean oil stabilization.23
P-Anisidine Value
pAnV is an indicator of hydroperoxide decomposition products which are known as secondary lipid oxidation products (aldehydes and ketones). The lower the pAnV value, the better the quality of the oil in question. Generally, the p-AnVs for all samples gradually increased throughout the storage period. No significant difference was observed until day 24. (Figure 4).
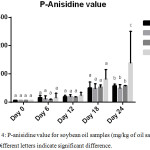 |
Figure 4: p-anisidine value for SBO and fortified SBO samples (mg/kg of each oil sample), n=2; Different letters signify significant difference. |
On the final day of the accelerated storage period, the percentage retardation of the formation of carbonyls are 58.74%, 64.60% and 58.57% for BHA, FH and GC fortified soybean oil samples respectively indicating the potential of different antioxidants to retard lipid oxidation to varying degrees. BHA was more effective in slowing down the formation of secondary oxidation products than FH and GC within the first 12 days of storage (an equivalence of one year of storage at room temperature) as shown in figure 4. Afterwards, both FH and GC exhibited comparable antioxidant efficiency for the remaining days of the accelerated storage (49.26 – 57.64 meq/ kg oil). These pAnvs are comparable to the values reported by Hip et al.,5 in the supplementation of sunflower oil with Pleurotus porrigens extract during accelerated storage where slightly lower p-Anisidine values were recorded.
Interestingly, FH in SBO was better in slowing down the conversion of primary oxidation products to secondary on day 24 storage compared to GC and BHA. The better antioxidant effects of plant extracts in vegetable oils may be attributed to the synergy between potent phenolic compounds in each extract.24 Again, GC and FH extracts can offer efficient antioxidant protection for unsaturated vegetable oils thus preserving the quality of such oil and prolonging their shelf-lives.
Calculation of Total Oxidation Value
Total oxidation (TOTOX) value gives a broad view of the early and the later oxidative deterioration of the oil by combining PV (primary oxidation product indicator) and the pAnV (secondary oxidation product indicator) as shown in the earlier stated equation for determining TOTOX value.14 The lower the TOTOX value the slower the advancement of the oil towards rancidity.
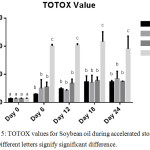 |
Figure 5: TOTOX values for Soybean oil during accelerated storage, n=2. |
The overall oxidative deterioration of the soybean oil employed in this research is shown in Figure 5. In general, GC-SBO showed the lowest TOTOX value compared to FH-SBO and BHA-SBO until day 6. At day 24, SBO had the highest TOTOX value, followed by FH-SBO, BHA-SBO, and GC-SBO respectively. However, on day 18, the TOTOX value of BHA-SBO decreased significantly unlike SBO and FH-SBO. The TOTOX value as depicted in figure 5, shows that at day 24 (2 years of storage at ambient temperature), GC and FH compare well with BHA in offering stabilization to soybean oil.
Conclusion
The findings in this research present Zingiber officinale and Fagara zanthoxyloides roots as sources of natural antioxidants with potential for the replacement of synthetic antioxidants such as butylated hydroxyanisole (BHA). Although the comparative study was conducted at 200 ppm, the maximum allowable limit for BHA, higher concentrations of these plant extracts can be employed for better antioxidant activity in soybean oil without any legal constraint or health implication. Such fortified vegetable oils will enjoy high consumer acceptability. Fractions and isolates from these extracts will be applied for possible better antioxidative preservation of vegetable oils in future.
Acknowledgements
The authors are grateful to Landmark University Management for the provision of reliable power supply and an enabling laboratory environment.
Conflict of Interest
There is no conflict of interest.
References
- Ehsan, S.; Farahnaz, K.; Alireza, E. J. Food process preserv. 2017, 41(1), e12745. https://doi.org/10.1111/jfpp.12745
- Wanasundra, P. K. J. P. D.; Shahidi, F.. Antioxidants: Science, Technology and Applications. In Shahidi, F. (Eds), Bailey’s industrial oil and fat products, 2005, pp. 431-489. Hoboken, NJ , USA: John Wiley & Sons, Ltd.
- Taghvaei, M.; Jafari, S. M. J. Food Sci Technol. 2015, 52(3), 1272–1282. http://doi.org/10.1007/s13197-013-1080-1
- Hęś, M.; Gramza‐Michałowska, A. J. Food process preserv.2017, 41(3), e12989.
- Hip, S.Y.; Fook, Y.C.; Mei, L.L.; Chun, W.H. Chiang Mai J. Sci. 2013, 40(1), 34-48.
- Satvir, S.L. Sumudu, N.W.; Vasantha, R. and Fereidoon, S. Food Chemistry. 2013, 140, 189-196.
- Adekunle, A.S.; Kamdem, J.P.; Rocha J.B.T. Report and Opinion. 2012, 4(3), 6-13.
- Ammar, M.A.A.; Mawahib, E.M.E.; Sakina, M.Y. Journal of Genetic Engineering and Biotechnology (In press). 2018, doi.org/10.1016/j.jgeb.2018.03.003.
- Harborne, J.B., 1993. Phytochem. Academic Press, London.
- Oluyori, P.A., Olatunji, G.A. J. Int. Res. Med. Pharm. Sci. 2016, 6(4), 157-164.
- Zhao, B.; Hall, C.A.,. Food Chem. 2008, 108(2), 511-8. doi: 10.1016/j.foodchem.2007.11.003.
- Ayoola, G.A.; Coker, H.A.B.; Adesegun, S.A.; Adepoju-Bello, A.A.; Obaweya, K.; Ezennia, E.C.; Atangbayila, T.O. Tropical J. Pharm Res. 2008, 7 (3), 1019-1024.
- Iqbal, S.; Bhanger, M.I. Food Chemistry 2007, 100(1), 246–254. https://doi.org/10.1016/j.foodchem.2005.09.049.
- O’Keefe, S.F; Pike, O.A. 2010. Fat Characterization; in Nielsen S.S., ed., Food Analysis, 4th Edn.,Springer Science+Business Media, New York. 239-260.
- Adelani-Akande, A.T.; Chidimma, A.L.; Olatunde, D.S.; Oluyori, A.P. African J. Biotechnol. 2015, 14(14), 1224-1229.
- Gallardo, C.; Jimenéz, L.; García-Conesa, M.T. Food Chem. 2006, 99, 455-463.
- Semwal, R.B.; Semwal, D.K.; Combrinck, S.; Viljoen, A.M. Phytochemistry 2015, 117:554-68. doi: 10.1016/j.phytochem.2015.07.012
- Mošovská, S.; Dominika, N.; Michal, K. Acta Chimica Slovaca. 2015, 8(2), 115-119. doi:10.1515/acs-2015-0020
- Stoilova, I.; Krastanov, A.; Stoyanova, A. Food Chem J. 2007, 102, 764-770.
- Jaffery, E.H.; Brown, A.F.; Kurilich, A.C.; Keck, A.S.; Matusheski, N.; Klein, B.P.; Juvik, J.A. J Food Compost Anal. 2003, 16, 323-330.
- Ramona, K.; Haema, T. Asian J. Pharm. Sci. 2017, 12(5), 401-411.
- Franco, D.; Rodríguez-Amado, I.; Agregan, R.; Munekata, P.; Vázquez, J.A.; Barba, F.J.; Lorenzo, J.M. LWT – Food Sci. Technol. 2017, doi: 10.1016/j.lwt.2017.09.027.
- Mostafa, T.; Seid, M.J.; Alireza, S.M.; Alireza, M.N.; Neda, R.; Javad, H.; Nasim, M. LWT-Food Sci.Technol. 2014, 56(1), 124 130 doi.org/10.1016/j.lwt.2013.11.009
- Lindquist, E.; Yang, Y., J Chromatogr A. 2010, 1218(15), 2146-52. doi: 10.1016/j.chroma.2010.08.054
- Pierre, L.L.; Moses, N.M.; Peter, C.M. Nat Prod Chem Res. 2015, 3, 176. doi:10.4172/2329-6836.1000176.

This work is licensed under a Creative Commons Attribution 4.0 International License.
![]()
A New Edition of Web of Science
Journal Impact Factor
2022: 0.5
Five Year: 0.8
Journal is Indexed in

Cabells Whitelist
![]()


