Development and Validation of Stability-Indicating RP-HPLC Method for the Estimation of Lenalidomide and its Impurities in Oral Solid Dosage form
 and A. Naga Babu1
1Department of Chemistry, Koneru Lakshmaiah Education Foundation, Vaddeswaram, Guntur District, Andhra Pradesh-522502, India.
2Department of Chemistry, Koneru Lakshmaiah Education Foundation, Vaddeswaram, Guntur District, Andhra Pradesh-522502, India.
Corresponding Author E-mail: drkrishnamohangv@kluniversity.in
DOI : http://dx.doi.org/10.13005/ojc/350115
Download this article as:
![]()
In this study, a novel, simple and precise RP-HPLC method has been developed for the quantitative analysis of Lenalidomide (LLM) in pharmaceutical formulations using analytical quality by design approach. An X-bridge-C18 column (150 mm × 4.6 mm × 3.5 µ) with mobile phases containing a Potassium dihydrogen orthophosphate anhydrous buffer and methanol in the ratio of (90:10 v/v) and (35:65 v/v) are used for the estimation of LLM and its degradation products. The flow rate of 0.8 mL/min is maintained and all degradation studies are performed at 210 nm using photodiode array (PDA) detector. Method Validation is carried out according to International Council for Harmonisation (ICH) guidelines and the parameters namely; precision, accuracy, specificity, stability, robustness, linearity, limit of quantitation (LOQ) and limit of detection (LOD) are evaluated. The present developed RP-HPLC method shows the purity angle of peaks is less than their threshold angle, signifying that it to be suitable for stability studies. Hence, the developed method can be used for the successful separation of LLM and its impurities in the pharmaceutical dosage formulations.
KEYWORDS:Degradation Products; ICH Guidelines; Lenalidomide; Method Validation; RP-HPLC
Introduction
Lenalidomide (Revlimid®) is an immune modulatory drug with an extraordinary medical activity in the treatment of Myelodysplastic Syndrome (group of cancers) patients.1-3 It is a structural analogue of thalidomide but has an enhanced side effect profile and high immunomodulatory activity than its native composite thalidomide.4,5 Lenalidomide (LLM) is chemically designated as 3-(4-amino-1-oxo 1,3-dihydro-2-H-isoindole-2-yl) piperidine-2,6-dione with the molecular formula and molar mass of C13H13N3O3 and 259.261 g/mol respectively. In 2006, LLM has granted approval by US-FDA for the treatment of patients with multiple myeloma, transfusion-dependent anaemia and myelodysplastic syndromes in combination with dexamethasone.6 Further, it has been employed to clinical trials for the treatment of advanced cancers such as blood cancers: Hodgkin’s lymphoma and non-Hodgkin’s lymphoma, bone marrow cancer: Chronic lymphocytic leukaemia and solid tumour cancers: Carcinoma and Pancreas.7,8 Basically, LLM increases the functional capacity of the T-cells and inhibits the angiogenesis in vitro in human systems.9 The recommended dose of LLM is 10.0 mg for daily but it can be abridged to 5.0 mg all other days if neutropenia or thrombocytopenia occurs. Hence, there is an increasing demand for appropriate analytical technologies to ensure the quality of LLM formulations.
In the recent past, different analytical techniques have been developed with various detectors in the pharmaceutical analysis.10 Few analytical methods are reported in the literature for the estimation of LLM and it impurities by using HPLC, HPLC assay and LC-MS methods.1,11-13 These methods are associated with some major drawbacks such as lack of selectivity and the methods doesn’t deal with the forced degradation studies. Moreover, some of the related substance methods are found highly pH sensitive due to the buffer solution which is used in the mobile phase.
Hence, to overcome this problem, attempted to validate and develop a simple, precise, sensitive and stability indicating RP- HPLC method for determination of Lenalidomide related substance with the inclusion of another lenalidomide Impurity-III by using Qbd approach to overcome this risk-sensitive to pH of buffer solution. The method is comprehensively validated as per the guidelines of International Conference on Harmonisation (ICH).14-16 The molecular structure of the LLM is presented in the Fig.1.
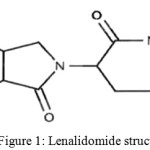 |
Figure 1: Lenalidomide structure. |
Materials and Methods
Instruments and Chemical Reagents
Waters High-performance liquid chromatography system (HPLC) with Photodiode Array (PDA) detector was used throughout the analysis. This can be used for in-vitro diagnostic testing to analyze many compounds, including diagnostic indicators and therapeutically monitored compounds. The minimum of five pure standards were employed to calibration of the instrument and the concentration range has been covered the entire range of typical specimens, quality-control samples and atypical specimens. Waters Empower Networking Software was employed for obtaining the chromatographic data and the electronic analytical balance (Thermo Fisher Scientific, Hyderabad, India) was used for weighing purposes. Standard Lenalidomide (purity, ≥99.9%) and all impurities were acquired from Dr. Reddy’s Laboratories Ltd., Hyderabad, India. Anhydrous potassium dihydrogen orthophosphate and orthophosphoric acid were used for the preparation of buffer solutions and methanol and acetonitrile were HPLC and analytical grade chemicals purchased from Merck KGaA (Darmstadt, Germany). High purified Millipore water from MilliQ water system was used.
Chromatographic Conditions
Waters HPLC instrument with PDA detector was used for the method development and validation of the samples at 210 nm. A stationary phase was developed with the C18 column (4.6 mm internal diameter, 150 mm length and 3.5µ particle size) to separate the impurities of LLM. Two mobile phases A and B were used for the rapid separation of impurities. The temperature of the column was kept at 27°C and gradient flow mode was sustained throughout the analysis. The 10.0 µL volume of the sample was injected into the system per run by maintaining the flow rate of mobile phase 0.8 mL/min. The diluents were prepared by mixing the Buffer and Methanol solutions in the ratio 90:10 and 35:65 for extraction of LLM and its impurities from formulation matrix.
Preparation of Solutions
Mobile Phase- A & B
Buffer and Methanol solutions were mixed in the ratio of 90:10 v/v and 35:65 v/v to prepare the Mobile phase-A and mobile phase-B respectively. The concentration of buffer solution in mobile phase-A is more than the concentration of buffer solution in mobile phase-B to separate all the impurities and the concentration of the organic solution in mobile phase-B is high than mobile phase-A to elude all impurities.
Standard LLM Solution
Accurately weighed about 20 mg of LLM was transferred into a 100 mL volumetric flask and 70 mL of diluents was added to the flask. Then, the volumetric flask was sonicated until the complete digestion of the drug and make up the volume with diluent. The prepared stock solution of 5.0 mL was taken into a 50 mL volumetric flask and makeup to the volume with the same diluent.
Preparation of Sample Solution
About 25 mg of Lenalidomide tablet powder was taken into a 50 mL volumetric flask, and then 35 mL of diluents was added, sonicated for 15 min at 4000 RPM and makeup with the prepared diluent. Centrifuged and filtered the sample and filtrate were used to inject into the HPLC system.
Preparation of Impurity Stock Solution
1.0 mg of each impurity-I, impurity-II and impurity-III standards were accurately weighed and transferred to a 20 mL volumetric flask. Then the each impurity was dissolved with diluent and the solution was makeup to the mark with diluent.
Preparation of Spiked Sample
Accurately weighed 25 mg of LLM tablet powder was transferred into the 50 mL volumetric flask and 35 ml of the diluent was added to the flask. Then, 1.0 mL of stock impurity solution was added. The resulting solution was sonicated until the complete drug digestion, make up the volume with diluent and mix well. Centrifuge the above solution for 5 more minutes at 4000 RPM.
Specificity
The LLM and its impurities were injected into the optimized system to demonstrate the specificity of the developed method in the formulation of LLM (ICH 2005). The effectual separation of known impurities and degradants of LLM peak by forced degradation studies of LLM tablets were conducted at different stress conditions like acid (0.5 N HCl), base (0.2 N NaOH), peroxide (30% H2O2), water (80°C on water bath), thermal (80oC in hot air oven), humidity (90% RH in humidity chamber) and photolytic stress (photostability chamber at 200 watt-hour/square meter).
Results and Discussion
Optimization of Chromatographic Conditions
Several mobile phase compositions and different stationary phases were investigated in the preliminary studies to get the best resolution between LLM and its impurities. All analytes have the different retention behaviours and hence it is a challenging development to separate all analytes in the shorter method without interfering Placebo components and degradation impurities. Based on the Design of Experiments (DOE), the final chromatographic conditions were optimized which gives a powerful suite for a statistical methodology and the obtained findings are presented in Table 1 and Table 2. The DOE was performed using fractional design by in view of the pH of the buffer in mobile phase-A, flow rate, the percentage of methanol in mobile phases- A and B and resolution between the close eluting impurities (Impurity-I&II) as responses.
Table 1: CMP, CQA, and QTMP of LLM related substance stability-indicating analysis method.
| CMP(Critical Method Parameter) | Range of each parameters used for DOE | QTMP (Quality Target Method Profile) | CQA (Critical Quality Attribute) | ||
| Low | As such | High | Targeted QTMP | ||
| A) pH of the buffer in mobile phase -A | 3.4 | 3.6 | 3.8 | Resolution b/w Impurity-I&II not less than-1.5 | Resolution b/w Impurity-I&II |
| B) % Methanol in mobile phase-B | 60 | 65 | 70 | ||
| C) % Methanol in mobile phase-A | 5 | 10 | 15 | ||
| D) pH of the buffer in mobile phase -B | 3.4 | 3.6 | 3.8 | ||
Table 2: Design of Experiments runs – LLM related substance method.
| Std Order | Run Order | Canter Point | pH of M.P-A | %Methanol in M.P-B | %Methanol in M.P-A | pH of M.P-B | Resolution b/w Impurity-I&II |
| 3 | 1 | 1 | 3.4 | 70 | 5 | 3.8 | 2.2 |
| 2 | 2 | 1 | 3.8 | 60 | 5 | 3.8 | 4.2 |
| 9 | 3 | 0 | 3.6 | 65 | 10 | 3.6 | 3.8 |
| 1 | 4 | 1 | 3.4 | 60 | 5 | 3.4 | 2.1 |
| 6 | 5 | 1 | 3.8 | 60 | 15 | 3.4 | 3.5 |
| 5 | 6 | 1 | 3.4 | 60 | 15 | 3.8 | 2.5 |
| 7 | 7 | 1 | 3.4 | 70 | 15 | 3.4 | 1.8 |
| 8 | 8 | 1 | 3.8 | 70 | 15 | 3.8 | 2.1 |
| 4 | 9 | 1 | 3.8 | 70 | 5 | 3.4 | 3.9 |
The main effect chart for the resolution between LLM Impurity-I&II is presented in the Fig.2 and further, the interaction plot for the resolution between LLM Impurity-I&II is presented in the Fig.3. Minitab software was used for evaluating the effects of factors on resolutions and to generate the Pareto chart with three-dimensional plots. pH of the buffer solution in mobile phase-A and percentage of methanol in mobile phase-B plays a major role in the separation of impurities. Further, the acquired data was employed for setting the upper and lower boundaries for all variables. Moreover, the design space was demonstrated and experimentally proposed values were nearer to the suggested parameters. Interactive effects were carried out from various overlay graphs plotted between two parameters at a time using visual inspections and modelled data. The parameters of the developed and validated HPLC method are presented in Table 3. The Pareto chart for standardized effects on the resolution between LLM Impurity-I&II is presented in the Fig.4 and the contour plot for the resolution between Acetyl and Diacryloyl impurities are presented in the Fig.5.
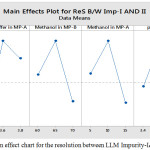 |
Figure 2: The main effect chart for the resolution between LLM Impurity-I&II. |
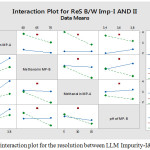 |
Figure 3: The interaction plot for the resolution between LLM Impurity-I&II. |
Table 3: Optimized HPLC method conditions.
| Column | X-Bridge-C18 150 x 4.6 mm, 3.5µm | ||
| Flow rate | 0.8 mL /min | ||
| Column oven temperature | 27°C | ||
| Wave length | 210 nm | ||
| Injection Volume | 10 µL | ||
| Run time | 65 minutes | ||
| Gradient program | Time (min) | % Mobile Phase-A | % Mobile Phase-B |
| 0 | 100 | 0 | |
| 5 | 100 | 0 | |
| 35 | 60 | 40 | |
| 45 | 50 | 50 | |
| 58 | 50 | 50 | |
| 58.1 | 100 | 0 | |
| 65 | 100 | 0 | |
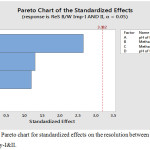 |
Figure 4: The Pareto chart for standardized effects on the resolution between LLM Impurity-I&II. |
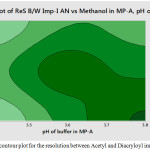 |
Figure 5: The contour plot for the resolution between Acetyl and Diacryloyl impurities. |
Based on the recovery and shape of the peak, the diluents were finalized, and test concentrations and injection volumes were optimized to contain greater reporting threshold than the limit of quantification (LOQ). The gradient was optimized to get the best resolution among main analyte and all impurities. Fig. 6. presents the typical chromatogram of standard solution, Fig. 7. Presents the typical chromatogram of impurity Spiked chromatogram and furthermore, the Fig. 8. presents the typical chromatogram of spiked test chromatogram.
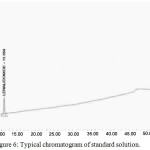 |
Figure 6: Typical chromatogram of standard solution. |
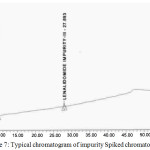 |
Figure 7: Typical chromatogram of impurity Spiked chromatogram. |
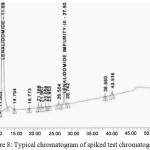 |
Figure 8: Typical chromatogram of spiked test chromatogram. |
System Suitability
The standard level of the LLM test solution was introduced into HPLC system and found that system suitability parameters are within the limits. The percentage of relative standard deviation (RSD) was calculated for peak areas and USP plate count. The repeated injection of RSD percentage was observed as 0.2%, where the acceptance criteria were not more than 10.0%. The obtained results are presented in Table 4.
Table 4: System suitability results table.
| System suitability parameters | Observed Value | Acceptance criteria |
| The relative standard deviation of peak areas of Lenalidomide from three replicate injections of standard solution. | 0.2 | Not more than 10.0% |
| The Tailing factor for Lenalidomide peak from Standard | 1.1 | Not more than 1.5 |
| The number of theoretical plates for Lenalidomide peak | 23503 | Not less than 2500 |
Specificity
Placebo Interference
A study was conducted to establish the placebo interference. As per the test method, samples were prepared by taking the placebo, equivalent to the weight in a portion of test preparation and then injected into HPLC system. Interference was not found for the chromatograms of placebo solution, empty cell solution and impurities solution at the retention time of LLM and its impurities. The obtained chromatogram is presented in Fig. 9.
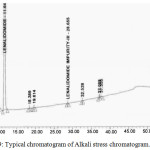 |
Figure 9: Typical chromatogram of Alkali stress chromatogram.Click here to view figure |
Interference from Degradation Products
The samples were subjected to various stress circumstances for the efficient separation of all degradants from forced degradation of LLM. Separate portions of LLM capsules were exposed to following stress conditions to induce degradation and the detailed findings are depicted in Table 5.
Acid Degradation- Kept on a water bath at 80°C for 16 h with 0.5N HCl
Base Degradation- Kept on bench top for 15 min with 0.2N NaOH.
Peroxide Degradation – Kept on the bench top in dark for 14 h with 30% H2O2 solution.
Water Degradation- Kept on a water bath at 80°C for 16 h.
Thermal Degradation – Kept in a Hot-air oven at 80°C for 7 days.
Humidity Degradation – Kept in Humidity chamber at 90% RH for 7 days at 25°C.
Photolytic Degradation – Exposed to 200-watt h/m2 and 1.2 million lux hours in photostability chamber for 16 h.
Table 5: Interference from degradation Products.
| S. No. | Stress condition | % Net degradation (% imp of stressed sample – % imp of unstressed sample) | Purity angle | Purity threshold | Purity flag (yes/no) |
| 1. | Unstressed sample | 0.1929 | 4.205 | 10..055 | No |
| 2. | Kept on water bath at 80°C for 16Hrs with 0.5N HCl | 12.0141 | 2.487 | 8.536 | No |
| 3. | Kept on bench top for 15min with 0.2N NaOH | 3.4424 | 4.178 | 10.643 | No |
| 4. | Kept on bench top in dark for 14Hrs with 30% H2O2 solution. | 11.2247 | 2.642 | 8.721 | No |
| 5. | Kept on water bath at 80°C for 16Hrs. | 24.0716 | 1.867 | 7.354 | No |
| 6. | Kept in Hot-air oven at 80°C for 7 days. | 0.1879 | 4.321 | 11.363 | No |
| 7. | Kept in Humidity chamber at 90% RH for 7 days at 25°C. | 0.1924 | 4.069 | 12.375 | No |
| 8. | Exposed to 200-watt hour/m2 and 1.2 million lux hours in Photo stability chamber for 16Hrs. | 0.2730 | 4.497 | 12.969 | No |
To find the purity of the main analyte and impurity peaks, the all stressed samples were subjected to HPLC system with PDA detector. Chromatograms of the stressed samples were evaluated for peak purity of LLM and all impurities using Waters Empower Networking Software. Impurity degradant peaks in chromatograms of all stressed samples and LLM were resolved. The purity angle was found fewer than the purity threshold for the all forced degradation samples. This shows that there is no interference and co-elution from degradants in the quantification of impurity in the drug product. Hence, this method is “Stability Indicating” and extremely specific. The assay and mass balance of degradation samples are presented in Table 6.
Table 6: Mass Balance of degradation sample.
| S. No. | Stress condition | % Degradation | % Assay | Mass balance |
| 1. | Unstressed sample | 0.1929 | 100.00 | 100.19 |
| 2. | Kept on water bath at 80°C for 16Hrs with 0.5N HCl | 12.0141 | 86.44 | 98.46 |
| 3. | Kept on bench top for 15min with 0.2N NaOH | 3.4424 | 95.87 | 99.31 |
| 4. | Kept on bench top in dark for 14Hrs with 30% H2O2 solution. | 11.2247 | 84.33 | 95.55 |
| 5. | Kept on water bath at 80°C for 16Hrs. | 24.0716 | 79.90 | 103.98 |
| 6. | Kept in Hot-air oven at 80°C for 7 days. | 0.1879 | 100.87 | 101.05 |
| 7. | Kept in Humidity chamber at 90% RH for 7 days at 25°C. | 0.1924 | 100.76 | 100.96 |
| 8. | Exposed to 200-watt hour/m2 and 1.2 million lux hours in Photo stability chamber for 16Hrs. | 0.2730 | 100.00 | 102.00 |
Linearity and Range
The linearity was examined between the series of 0.2 mg/L to 3.4 mg/L for the main analyte and all impurities. The prepared six dissimilar linearity solutions were injected into the HPLC system, and the obtained findings are presented in Table 7.
Table 7: Precision of the LLM impurities.
| S.No | % Impurity-I | % Impurity-II | % Impurity-III |
| 1 | 0.1749 | 0.2030 | 0.2407 |
| 2 | 0.1766 | 0.2040 | 0.2383 |
| 3 | 0.1766 | 0.2058 | 0.2396 |
| Average | 0.1764 | 0.2043 | 0.2395 |
| %RSD | 0.77 | 0.69 | 0.50 |
Limit of Detection (LOD) and Limit of Quantitation (LOQ)
In order to examine the LOD and LOQ, dissimilar concentrations of solutions were prepared by spiking known amounts of impurities and spiked LLM in the diluent. The signal-to-noise (S/N) approach was used to determine the detection limits and quantitation limits and the average S/N ratio was used for calculating the all analyses at each concentration level. The concentration which gives S/N 3 can be readily detected was reported as the LOD. The slope method was used for estimation of LOD and LOQ and the equations used are LOQ=10×σ/S and LOD=3.3×σ/S, where, S is the calibration curve slope, and σ is the standard deviation of the response. The observed values are presented in Table 8.
Table 8: LOQ values of LLM impurities.
| S.No | Spike level | Impurity-I | Impurity-II | Impurity-III | |||
| % Recovery | Mean % Recovery | % Recovery | Mean % Recovery | % Recovery | Mean % Recovery | ||
| 1 | Limit of Quantification level | 94.7 | 93.9 | 102.0 | 102.0 | 102.6 | 101.9 |
| 2 | 92.4 | 102.0 | 102.6 | ||||
| 3 | 94.7 | 102.0 | 100.4 | ||||
| 1 | 100% level | 91.1 | 92.6 | 104.0 | 104.7 | 104.4 | 103.6 |
| 2 | 93.0 | 104.6 | 103.0 | ||||
| 3 | 93.0 | 105.6 | 103.5 | ||||
| 1 | 150% level | 98.1 | 97.9 | 106.6 | 106.6 | 101.9 | 102.1 |
| 2 | 98.3 | 106.7 | 102.7 | ||||
| 3 | 97.2 | 106.6 | 101.8 | ||||
Stability
The stability of the LLM and its impurities in the spiked sample was examined at room temperature for 96 h. All the spiked samples were kept in the air-tight volumetric flask on bench-top for observing the stability of the samples and found that all prepared samples are stable up to 96 h.
Accuracy and Precision
Six samples were prepared at 0.2% of the targeted test solution by spiking the impurities. The obtained chromatogram is presented in Fig. 9. Recovery studies were carried out for the LLM and its impurities, and the values were obtained between 92.6-106.6 %. The linearity of detector response was calculated for three impurities along with LLM and the obtained values were presented in Table 9. The accuracy was calculated as %bias (divergence between measured concentrations and nominal concentrations), and the precision was calculated within the intra-day (single run) and inter-day (different runs). The ensuing percentage of Relative Standard Deviation (RSD) values of LLM impurities were observed below 2.0 (n=6). Therefore, the method is precise and accurate.
Table 9. Linearity of Detector Response of LLM impurity-I.
| S.No | Concentration in mg/L | Area Response | Slope (m) | Intercept (C) | Correlation Coefficient (R) | Bias at 100% Response |
| 1 | 0.26 | 11037 | 42811.464 | 24.881 | 1.0000 | 0.02 |
| 2 | 0.52 | 22108 | ||||
| 3 | 1.55 | 66822 | ||||
| 4 | 2.58 | 110520 | ||||
| 5 | 3.61 | 154393 | ||||
| 6 | 5.15 | 220502 | ||||
| Impurity-II | ||||||
| 1 | 0.25 | 10717 | 41432.997 | 649.190 | 1.0000 | 0.62 |
| 2 | 0.50 | 21272 | ||||
| 3 | 1.51 | 63698 | ||||
| 4 | 2.51 | 104810 | ||||
| 5 | 3.51 | 145877 | ||||
| 6 | 5.02 | 208580 | ||||
| Impurity-III | ||||||
| 1 | 0.25 | 18930 | 74135.872 | 553.407 | 1.0000 | 0.29 |
| 2 | 0.51 | 37796 | ||||
| 3 | 1.53 | 114761 | ||||
| 4 | 2.54 | 189152 | ||||
| 5 | 3.56 | 264368 | ||||
| 6 | 5.09 | 377665 | ||||
Conclusion
The RP-HPLC method developed in this study for the analysis of Lenalidomide (LLM) is simple, precise, accurate, selective and economical. The method was found to be robust within the defined design space. Samples are subjected to different forced degradation studies and found that impurity degradant peaks in chromatograms of all stressed samples and LLM are resolved. The %RSD for all parameters was found to be within the limit. The validated method shows the satisfactory data for all tested parameters. Thus, this developed method can be used for the purpose of quality control in the pharmaceutical dosage formulations.
Acknowledgements
The author thanks the management of Dr. Reddy’s Laboratories Ltd. for their valuable support to carry out and publish the work.
Conflicts of Interest
The authors declare that there is no conflict of interests regarding to the publication of the paper.
References
- Saravanan, G.; Rao, B.M.; Ravikumar, M.; Suryanarayana, M.V.; Someswararao. N.; Acharyulu, P.V.R. Chromatographia, 2007, 66, 287–290.
- List, A.; Kurtin, S.; Roe, D.J. The New England Journal of Medicine, 2005, 352, 549–57.
- Nourah, Z.; Alzoman, A. Journal of Chromatographic Science, 2016, 54, 730–735.
- Mitsiades, C.S.; Mitsiades, N. Current Opinion in Investigational Drugs, 2004, 5, 635–647.
- Rao, K.V. Am. J. Health System Pharmacists, 2007, 64, 1799-1807.
- Celgene Corporation, Revlimid® in combination with dexamethasone sNDA granted approval by FDA for treatment of multiple myeloma, 2006.
- US National Institutes of Health, Phase II Study of Lenalidomide for the Treatment of Relapsed or Refractory Hodgkin’s Lymphoma. Clinical Trials.gov., 2009.
- US National Institutes of Health, 276 current clinical trials world-wide, both recruiting and fully enrolled, as of 27 February 2009. Clinical Trials.gov., 2009.
- Vallet, S.; Palumbo, A.; Raje, N.; Boccadoro, M.; Anderson, K.C. Leukemia & Lymphoma, 2008, 49, 238–245.
- Masoom Raza Siddiqui; Zeid A. AlOthman; Nafisur Rahman. Arabian Journal of Chemistry, 2017, 10, S1409-S1421.
- Maheswara, R.L.; Janardhan, R.K.; Bhaskar, R.L.; Raveendra Reddy, P. E-J. Chem., 2012, 9, 1165-1174.
- Hadir M. Maher; Nourah Z. Alzoman; Mona M. Alshehri; Haya I. Aljohar; Shereen Shehata; Manal Alossaimi; Norah O. Abanmy. RSC Adv., 2015, 5, 98600-98609.
- International Conference on Harmonisation ICH – Q1A (R2), Stability Testing of New Drug Substances and Products, 2003.
- International Conference on Harmonisation ICH – Q1B, Photo Stability Testing of New Drug Substances and Products, 1996.
- Premanand, R.; Gunasekaran, V.; Indrajeet, S.; Javed Ansari, M. Saudi journal of biological sciences, 2018, In press, doi.org/10.1016/j.sjbs.2018.02.006
- International Conference on Harmonisation ICH – Q2 (R1), Guideline on Validation of Analytical Procedure: Text and Methodology, 2005.
Accepted on: 12-01-2019


![]()


