Carbon Dots Modification for Escherichia Coli Detection: Variation of Colistin Sulphate Concentration
1Department of Chemistry, Faculty of Mathematics and Natural Science, Universitas Gadjah Mada, Sekip Utara Kotak Pos 21 BLS, Yogyakarta 55281, Indonesia.
2Department of Biology, Faculty of Biology, Universitas Gadjah Mada, Sekip Utara Kotak Pos 21 BLS, Yogyakarta 55281, Indonesia.
3New Business Development Office, Corporate R and D Division, Ushio INC. 1-6-5 Marunouchi, Chiyoda-ku, Tokyo 100-8150, Japan.
4Department of I and E Visionaries, Kyushu University, 744 Motooka, Nishi-ku, Fukuoka Japan.
Corresponding Author E-mail: suherman.mipa@ugm.ac.id
DOI : http://dx.doi.org/10.13005/ojc/350105
Download this article as:
![]()
Escherichia coli (E. coli) bacteria widely recognize as a major treatment in water quality as diarrhea disease becoming one of leading causes of mortality worldwide. Carbon dots (CDs) modification study for detection of E. coli with the variation of colistin sulphate concentration has been conducted. The purpose of this research is to evaluate the effect of colistin sulphate concentration variation on fluorescence intensity for detecting E. coli bacteria in water samples. This study started by synthesizing CDs and CDs colistin variation concentrations of 1.0; 1.5; 2.0 and 2.5 mmol through carbonization of ammonium citrate and the addition of colistin. All precursors are characterized by using FT-IR. Morphological forms were evaluated with scanning emission microscopy (SEM) and transmission electron microscopy (TEM). CDs and CDs colistin solutions were measured their spectras with a UV-Vis spectrophotometer. Each of these CDs colistin was determined at the excitation wavelength ranges of 310-450 nm using a spectrofluorophotometer. Subsequently, CDs colistin was used for bacterial detection in samples with variation in E. coli bacteria concentration, thus analyzed by spectrofluorophotometer with an optimum excitation wavelength. The results showed that the highest intensity of fluorescence on CDs colistin occurred at the wavelength excitation of 360 nm. CDs colistin with the variation of colistin concentration 2.5 mmol revealed the highest fluorescence intensity. For the detection of E. coli, all CDs colistin produced the same trends of fluorescence spectra as the higher concentration of E. coli in the samples produced the higher intensity of emission.
KEYWORDS:Carbon Dots; Colistin; Escherichia Coli; Fluorescence
Introduction
Water is one of the most important resources for living things. Nowadays the availability of a good quality water difficult to be found due to the lack of human attention to the pollution of the aquatic environment. One of the pollution that occurs due to human activity is waste water pollution and could be found by the number of coliform bacteria in water especially E. coli. These bacteria decompose organic substances in food into inorganic substances, that is CO2, H2O, energy and minerals. In the environment, this decaying bacteria serves as a decomposer and provider of nutrients for plants.1
Water Quality Survey on 20152 have revealed drink water condition in Yogyakarta needs to be concerned. Water Quality Survey portrays that 87.8% drinkable founts and 73% water pipe are contaminated by E. coli bacteria.
CDs is a new nanomaterial carbon class that has 10 nm size. The material was obtained during the purification from single-walled carbon nanotube through electrophoresis process. In this research, we try to synthesize CDs colistin to know the effect of colistin variations in CDs modification by observing its fluorescence and how the fluorescence intensity of CDs colistin in detecting detect Escherichia coli in water samples. The CDs synthesis was conducted by microwave method. In general, the classification of method for CDs synthesis divided into top-down and bottom-up methods. In top-down method the larger carbon structures to be broke into CDs, for example electrochemical oxidation, arc-discharge and laser ablation technique. In bottom-up method including combustion/thermal/hydrothermal, supported synthesis, microwave, chemical dissolution methods are carried out as long as the CDs is formed from raw or precursor material.3
Colistin, also known as polymyxin E is a polycationic peptide antibiotic with two hydrophilic and lipophilic groups. Colistin has significant activity against multi-resistant g-negative bacteria, including Pseudomonas aeruginosa, Acinetobacter baumannii, Klebsiella species of pneumonia and Escherichia coli.4 In the Carrillo-Carrión5 study, colistin is used not only as an anti-bacterial agent, but also used as a detector of g-negative bacteria against E. coli bacteria. The cationic region of colistin interacts with lipopolysaccharides
and phospholipids in the outer cell membrane of g-negative bacteria by replacing the calcium-ionic magnesium and ionic counterions in lipopolysaccharides, resulting in cytoplasmic leakage and cell death. Hydrophobic/hydrophilic areas interact with cytoplasmic membranes dissolving membranes in aqueous environments. This effect is capable of killing bacteria. Chandra et al.6 has conducted a simple carbon dioxide synthesis study and then modified choline on the CDs on dot surface for selective detection of g-negative bacteria. While Bhaisare et al.7 developed magnetic carbon dot using magnetic nanoparticles functionalized amine group from chitosan to detect pathogenic bacteria. In this way, the bacteria will approach and can be detected by fluorescence.
Nandi et al.8 has conducted a research about bacteria detection using CDs that proposed as a carrier for biological study because its chemical stability, the surface can be easily functioned or modified, and the range of their wide emission/excitation spectrum. CDs also can be used as a markers of bacterial cells that exhibit a high affinity for cell membranes.
In this research, we try to synthesize CDs colistin to know the effect of colistin variation concentrations in CDs modification by observing its fluorescence spectras and how their performances in detecting E. coli in water samples.
Materials and Methods
Materials and Instrumentations
Ammonium citric was purchased from Chemix, colistin sulphate 250,000 IU (Colistin Actavis) were purchased from Alfa Kimia-Indonesia, PBS buffer solution pH 7.4 was acquired from faculty of Biology-UGM, g-negative Escherichia coli 108 cfu/mL cultured in PBS solution (pH 7.4) were obtained from Microbiology Laboratory, Faculty of Veterinary Medicine-UGM.
Some instrumentations used were centrifuge (Sorvall Biofuge Primo from Germany), test tube, test tube shelf dropper pipette 1 mL, orbital shaker, measuring glass 10 mL, vial bottle, analitycal balance, vortex, spectrophotometer UV-VIS (Evolution 201 from China), Scanning Electron Microscopy (JSM-6510LA from Japan), Transmission Electron Microsocopy (JEOL JEM-1400 from Japan), spectrofluorophotometer (RF-6000 Shidmadzu from Japan) and spectrophotometer Fourier Transform InfraRed (IRPresige-21 Shimadzu from Japan).
Methods
Synthesis of CDs
CDs were synthesised in solid phase by pyrolysis method, 20 mg ammonium citric was pounded in pestle, then heated at 180°C for 1 h. The brown residue that formed was cooled and analyzed using FT-IR. The material was dissolved in 10 mL aquadest then poured into falcon bottle. The solution cells were separated from suspension by centrifuge at 8500 rpm for 10 min. The absorbance were measured using spectrophotometer UV-Vis to get the highest peak at certain wavelength.
Synthesized of CDs with Colistin Variation Concentration
CDs colistin were syntesised by the same pyrolysis method. Ammonium citric 20 mg and colistin sulphate (1.3; 1.8; 2.5 and 3.1 g) was pounded in pestle, heated at 180°C for 1 h. The brown residue of CDs colistin (2.5 g colistin sulphate) were analyzed by FT-IR, SEM and TEM. Then, the material was dissolved in 10 mL aquadest and poured in falcon bottle. The solution was centrifuged at 8500 RPM for 10 min. The absorbance of each solution were measured using UV-VIS spectrophotometer to get the highest peak at certain wavelength.
Fluorescence Analysis
The emissivity of CDs 1; 1.5; 2 and 2.5 mmol were measure using spectrofluorophotometer excitation at 310-450 nm. The wavelength excitation that have highest intensity (360 nm) use to E. coli detection analysis.
E. Coli Detection
Amount of 1 mL 108 cfu/mL E. coli solution was added to water sample. Then PBS pH 7.4 solution was added to give dilution series till have 104 cfu/mL and the variation concentration were 104; 7.5×10³; 2.5×10³ dan 102 cfu/mL. Each sample at 1 mL was added to falcon bottle and CDs colistin 0.1 mL was added. The mixtures were vortex for 5 min and fit into orbital shaker at 200 RPM for 60 min at room temperature. After that, the solution was centrifuged at 8000 RPM for 10 min and analyzed by spectrofluorophotometer at 360 nm.
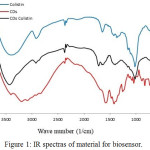 |
Figure 1: IR spectras of material for biosensor. |
Results and Discussion
IR Study
Precursor and CDs colistin were characterized by FTIR spectroscopy, as shown in Fig. 1. The spectrum of CDs showed a broad band at 3473 cm-1 indicate O-H stretching vibration of carboxylic, hydroxyl functional group and stretching vibration of N-H from CDs colistin as well. Then, there is a sharp peak at 1680 cm-1 that indicate stretching vibration of C=O from amide.9 Besides, in the spectrum of CDs, the stretching vibration of C=O was shifted from 1728 cm-1 to 1680 cm-1, this due to the formation of amide bond. Simultaneously, peak at 1410 cm-1 which is indicate vibration stretching of C-N. Stretching vibration at 1243 cm-1 indicate C-OH phenolic, while at 1184 cm-1 indicate C-OH from tertiary alcohol. Functional groups that contain oxygen would help the CDs to have a good-properties to disperse polar solvent like water and PBS solution which would make CDs easier for biosystem application. Slightly shifting of the stretching carbonyl at 1721 cm-1 frequency of CDs to carbonyl stretching of CDs colistin that indicated colistin was succesfully attached to the surface of the CDs or attachment of the colistin to the surface of CDs was confirmed.
Study of TEM and SEM Images
The TEM image shows that CDs colistin fits perfectly with the spherical morphology (Fig. 2). The things that can be seen are the CDs colistin that is formed is most of the spherical spots that spread all over the area.
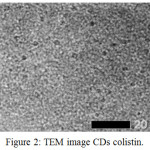 |
Figure 2: TEM image CDs colistin. |
The SEM image (Fig. 3) clearly showed that CDs colistin has a morphology similar to previous research6 with cracks appearance on the entire surfaces.
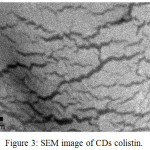 |
Figure 3: SEM image of CDs colistin. |
Study of UV-Vis CDs and CDs Colistin
As shown in Fig. 4 as UV-Vis spectra, CDs solution exhibit an absorbance peak at 340 nm, indicating the presence of carbonyl or conjugated carbonyl groups. It means transition n-π* from C=O and C=N3. Thus, the CDs solution appears a yellowish color under visible light.10
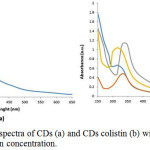 |
Figure 4: UV-Vis spectra of CDs (a) and CDs colistin (b) with variation of colistin concentration. |
Furthermore, in Fig. 4 (b) the peak absorbance of UV-Vis CDs colistin shifts in the wavelength range from 300 to 350 nm from the initial peak of CDs wavelength, this signifies as n-π* from transition C=O. The broad peak at 340 nm CDs is associated with the amount of excited trapped energy. The peak absorption shift occurs in CDs to carbon dot colistin, this is due to the presence of additional colistin to the surface of the CDs6. Electrons in a non-bonding orbitals (n) have high energy bonded by bonding orbital π. In “n” the electron or non-bonding electron is located on the oxygen of the carbonyl group of colistin. So, transition from n to π* associated with the excitation of electrons from one unpaired to the orbitals π*. Transition n-π* tend to be weak because an overlap was occurred between n (non-bonding orbital) and π* (anti-bonding orbital) in unsaturated compounds that bind to atoms that have free electron pairs. The organic compounds that undergo this transition are carbonyl compounds (C=O). Ultraviolet-visible light wavelength ranges between 200 – 400 nm had ΔE which is smaller and therefore absorbs at longer wavelengths compare to optimum wavelength for carbonyl at around 270-280 nm.
Study of Fluorescence Spectra of CDs Colistin
The fluorescence emission spectrum of CDs colistin all variations of concentration at different excitation wavelengths ranging from 310–450 nm shown in the Fig. 5.
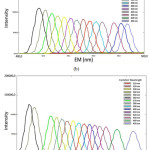 |
Figure 5: Spectra fluoresence for CDs 1 mmol (a), CDs 1,5 mmol (b) CDs 2 mmol (c) CDs 2,5 mmol (d). |
The results showed that the fluorescence emission peaks from 1 mmol CDs colistin occurred at the wavelength emission from 410 – 485 nm, with the highest peak on 410 nm. Peak fluorescence CDs colistin of 1.5 mmol occurs at the emission of wavelengths 415–485 nm, with the highest peak on 415 nm. Peak fluorescence emission from CDs colistin 2 mmol occured at the emission of wavelengths 410–510 nm, with the highest peak on 410 nm. Peak fluorescence emission from CDs colistin 2,5 mmol occurs at 425–495 nm, with the highest peak on 425 nm. The intensity of the fluorescence depends on the excitation, the different wavelength excitation is given to find out on which part of the captured emission surface will be dominant, so that the highest emission peak is found. Based on these results, the maximum intensity of the observed maximum fluorescence peaks occured at the excitation wavelength at 360 nm for each CDs colistin. This is in accordance with previous research that the wavelength excitation used for the highest fluorescence intensity is 360 nm. The trapped excitation energy produces a large number of emissions at 360 nm excitation in the fluorescence emission spectrum.11 The fluorescence spectra also showed that differences in colistin variation in CDs colistin affected the emission wavelength emissivity range of emission peak. Peak emission range is in blue region, that is 400–550 nm. This is due to the conjugation of the colistin molecule with CDs by the covalent bond. Conjugation by carboxylic group linkages to CDs and amino colistin clusters can reduce dipole–dipole interactions and shorten the Stokes shift, which leads to a blue change from the emission peak5. The presence of colistin on the surface of the CDs may interfere with excisional radiative excision, resulting in lower CDs colistin fluorescence compared with CDs. This means that the more colistin attached to the CDs, the lower intensity occured. However, on CDs colistin 2.5 mmol intensity is highest. This is possibly due to CDs colistin at 2.5 mmol has a short life time so that the reaction damage could occured due to radiative excision recombination; where an electron occupying a higher energy state went through the transition to a lower energy state and released light by the energy difference between the two states. This process causes increased in fluorescence intensity.12
CDs Colistin Test Varied Colistin Concentration of E. Coli Detection
CDs colistin is designed to recognize g-negative bacteria based on an affinity bond between colistin and bacteria. This interaction is a transduction event that recombinates genes between bacterial cells using phage virus, then the interaction of these changes is observed in fluorescence from carbon dot colistin after binding with bacterial cells. The bond between the carbon dot and colistin accomodated through one of the amino groups in the peptide.
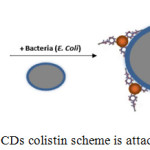 |
Figure 6: The CDs colistin scheme is attached to E. coli. |
Lipopolysaccharides (LPS), which is about 8-10 nm thickness, contains three major structural components: lipid A, oligosaccharide core, and polysaccharide. Lipid A is a hydrophobic part, rich in lipids that are the most retained part of the structure13. The bonds that occur between colistin and LPS involve hydrophobic interactions. Thus the side chain of fatty acids from colistin can be accessed to interact with lipid A on the surface of the g-negative bacteria seen in Fig. 6. The colistin molecule can retain the binding ability of bacteria on the CDs surface. This property allows CDs colistin to be used for bacterial sensors. The binding scheme of colistin with E. coli is well described by Carrillo-Carrión et al.5
Intensity of CDs colistin 2,5 mmol higher than the other three CDs colistins. The greater concentration of colistin in CDs colistin is associated with the high content of the colistin molecule on the surface of the CDs. The intensity of the fluorescence of E. coli samples obtained from different concentrations was measured at a 360 nm wavelength excitation after addition with CDs colistin. So the number of E. coli causes a lot of CDs colistin trapped or attached to bacteria.
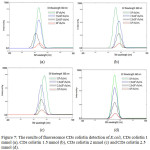 |
Figure 7: The results of fluorescence CDs colistin detection of E.coli, CDs colistin 1 mmol (a), CDs colistin 1.5 mmol (b), CDs colistin 2 mmol (c) and CDs colistin 2.5 mmol (d). |
Bacteria concentration at higher than 104 cfu/mL revealed cloudy sample solution resulting in an excitation light dispersion, which would interfere the fluorescence measurements. For that reason, concentration is limited only from concentration 104 to 102 cfu/mL. The fluorescence response of each CDs colistin detection of E. coli bacteria in this range is shown in Fig. 7. The higher concentration of E. coli bacteria produced higher fluorescence intensity for each CDs colistin concentration variation, respectively. It is also noticed that the peak emissions are in the wavelength emission of 400–460 nm. Based on these results, it can be said that many CDs colistin particles possible to bind each bacteria in a sample with higher concentration of E. coli bacteria, resulting in a strong fluorescence response.
Conclusion
Based on the results, it can be concluded that CDs colistin with the largest concentration of colistin (2.5 mmol) yielded the highest intensity of fluorescence emission at 360 nm wavelength excitation compared to other CDs colistins. In the detection of E. coli, all CDs colistin produce fluorescence spectras with the increasing of fluorescence emissions is in line with the increased of E. coli concentrations. Further research about variation of other precursors used and utilization test by other gram negative bacteria detection still in progress.
Acknowledgements
The authors thanks to Ministry of Research, Technology and Higher Education of the Republic Indonesia for financial support through the PKLN research scheme grant with the contract number of 1670/UN1/DITLIT/DIT-LIT/LT/2018.
References
- Kusuma, S.A.F. Escherichia coli, Undergraduate Paper, University of Padjadjaran, Bandung, 2010.
- Anonim, Water Quality Survey of Yogyakarta city. Central Buraeu of Statistics Indonesa, Yogyakarta, 2015.
- Liu, R.; Zhao, J.; Huang, Z.; Zhang, L.; Zou, M.; Shi; B.; Zhao, S. Sens. Actuators B., 2017, 240, 604–612.
- Li, J.; Nation, R.L.; Milne, R.W.; Turnidge, J.D.; Coulthard, K. Int. J. Antimicrob. Agents, 2005, 25, 11–25.
- Carrillo-Carrión, C.; Simonet, B.M.; Carrillo-Carrión, M.V.C.; Simonet, B.M.; Valcárcel, M. Biosens. Bioelectron., 2011, 26, 4368–4374.
- Chandra, S.; Mahto, T.K.; Chowdhuri, A.R.; Das, B.; Sahu, S.K. Sens. Actuators B., 2017, 245, 835–844.
- Bhaisare, M.L.; Gedda, G.; Khan, M.S.; Wu, H.-F. Anal. Chim. Acta, 2016, 920, 63–71.
- Nandi, S.; Ritenberga, M.; Jelinek, R. Analyst, 2015, 140, 4232–4237.
- Ding, H.; Zhang, P.; Wang, T.-Y.; Kong, J.-L; Xiong, H.-M. Nanotechnology, 2014, 25, 205604–205604.
- Cui, X.; Wang, Y.; Liu, J.; Yang, Q.; Zhang, B.; Gao, Y.; Wang, Y.; Lu, G. Sens. Actuators B., 2017, 242, 1272–1280.
- Zhang, R.; Chen, W. Biosens. Bioelectron., 2014, 55, 83–90.
- Aslandas, A.M.; Balcı, N.; Arık, M.; Sakiroglu, H.S.; Onganer, Y.; Meral, K. Appl. Surf. Sci., 2015, 356, 747–752.
- Li, Y.; Cheng, P.; Gong, J.; Fang, L.; Deng, J.; Liang, W.; Zheng, J. Anal. Biochem., 2012, 421, 227–233.
Accepted on: 30-01-2018


![]()


