Adsorption Isotherms Study of Methylene Blue Dye on Membranes from Electrospun Nanofibers
Wedad J. Fendi and Juman A. Naser
University of Baghdad/College of Education for Pure Science- Ibn Al-Haitham, Department of Chemistry, Baghdad, Iraq.
Corresponding Author E-mail: juman_chem@yahoo.com
DOI : http://dx.doi.org/10.13005/ojc/340628
Article Received on : 24-09-2018
Article Accepted on : 10-10-2018
Article Published : 05 Dec 2018
P-cresol formaldehyde resin was prepared and characterized by FTIR technique, then composited with polystyrene in order to produce electrospun nanofiber membrane by the electrospinning method. Zinc oxide nanoparticles was prepared and characterized by FTIR, XRD SEM and EDX techniques in order to modified first membrane. Both prepared nanofiber membranes characterized by SEM and EDX techniques and used as adsorbents to adsorb methylene blue dye from their aqueous solutions. The factors of adsorption were investigated, contact time, initial concentration, adsorbent dosage, ionic strength and temperature. The adsorption isotherms described by Langmuir and Freundlich models. So, thermodynamic functions ∆G, ∆H and ∆S of adsorption were estimated.
KEYWORDS:Adsorption; Electrospinning; Membrane; Methylene Blue Dye; Nanofiber
Download this article as:| Copy the following to cite this article: Fendi W. J Naser J. A. Adsorption Isotherms Study of Methylene Blue Dye on Membranes from Electrospun Nanofibers. Orient J Chem 2018;34(6). |
| Copy the following to cite this URL: Fendi W. J Naser J. A. Adsorption Isotherms Study of Methylene Blue Dye on Membranes from Electrospun Nanofibers. Orient J Chem 2018;34(6). Available from: http://www.orientjchem.org/?p=53404 |
Introduction
The water toxicity resulting from contamination with synthetic dyes is a major threat to human health, the sustainability of living resources and ecosystems.1 Methylene blue MB is the most common dye used in the wood, cotton and silk industry. It causes eye burns and may be responsible for an eternal eye injury. Its inhalation can lead to rapid or slow breathing while ingestion by mouth produces a sensation of burning which causes nausea, vomiting, excessive sweating, mental confusion and methemoglobinemia.2,3 Thus, attention should be focused on treatment of the wastewater containing methylene blue dye.
Various techniques were used to treat the problem of synthetic dyes pollution such as precipitation, extraction, coagulation, filtration, flotation, oxidation, adsorption, ion exchange, reverse osmosisphoto-catalytic degradation.4-9
Adsorption is one of the most effective and economic methods which applied for treatment wastewater. Different types of classical adsorbents were used for the removing of pollutants fromwastewater such as activated carbons, clays, zeolites and polymers etc.10-14 In principle, several types of nanomaterials were used as adsorbents to remove heavy metal ions and organic pollutants from wastewater, such as carbon nanotubes, graphene, metal nanoparticles and metal oxides nanoparticles.15
Electrospun nanofiber membranes ENMs are excellent adsorbents due to their high surface area, highly porous structure and strong mechanical properties.16 Where the production of this nanofiber membranes by elctrospinning technology that requires a high-voltage power source, a nozzle and a collector, the difference in voltage between the nozzle and the collector leads to polymer fiber extension, so the solvent evaporates during this process and infinitesimal nanofibers are collected.17,18
The obtained results previously by our research team, presented a new look in development of electrospun nanofibers as adsorbents by compositing phenol formaldehyde resin with polystyrene.19
In this study, p-cresol formaldehyde resin was prepared and composited with polystyrene in order to produce nanofiber membrane (Mem.1) by the electrospinning technique. Then zinc oxide nanoparticles was prepared and characterized by FTIR, XRD SEM and EDX techniques, in order to functionalize nanofiber membrane with it and produce modified nanofiber membrane (Mem.2). Both prepared membranes characterized by SEM and EDX techniques. Besides, the isotherms and thermodynamic functions of methylene blue dye adsorption on prepared nanofiber membranes from their aqueous solutions were studied.
Materials and Methods
Materials
Methylene blue dye C16H18ClN3S Fig. 1, acetic acid and hydrochloric acid, formaldehyde 40%, p-cresol, N,N-dimethylformamide (DMF) zinc sulfate hydrate, sodium hydroxide and polystyrene(PS) with average Mw 200,000 were purchased from Sigma-Aldrich company.
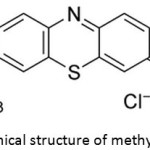 |
Figure 1: Chemical structure of methylene blue dye. |
Methods
Preparation of P-Cresol Formaldehyde Resin
P-cresol formaldehyde resin has been prepared by mixing 2mL of concentrated acetic acid with 1mL of formaldehyde, 4g of p-cresol added with continuous stirring. 5 drops of hydrochloric acid added drop wise gradually to the previous mixture. The reaction container putted in a water bath at 70ᵒC with continuous heating and stirring, until a homogeneous gelatin mass was obtained. Finally, the product polymer was collected and dried in a vacuum oven at 50°C for half an hour.
Preparation of Zinc Oxide Nanoparticles
Zinc oxide nanoparticles were prepared by sol-gel method. An aqueous solution 0.02 M 500 mL of hydrous zinc oxide ZnSO4.7H2O salt putted in glass beaker. The solution heated until it reached 80°C, then 0.04 M 500 mL of aqueous solution of sodium hydroxide added drop wise with continuous stirring and maintain temperature. After the end of the additive, the mixture was cooled while the stirring continued. The product was then collected and washed with distilled water and ethanol to several times to remove the salt and alkaline residue. Finally, the product was calcined by furnace oven at 500°C for 3 hours.
Electrospinning Process
The first membrane (Mem.1) prepared by mixing composite polymer solution of prepared P-cresol formaldehyde and polystyrene polymers which dissolved in dimethyl form amide DMF as a solvent with ratio 25% w/v. Then the previous polymer solutions were mixed by 3:7 v/v by mechanical stirrer at 60rpm for smoothing them with each other. Then 15mL of the mixed polymer solution was transferred to a plastic syringe with a 20mL capacity which connected to a nozzle with 0.9mm diameter. The electrospinning device was set at 30rpm for the collector cylinder, which wrapped with aluminum foil, the voltage is 40kv and the distance between the electrodes was 20cm. After finishing the electrospinning process, the nanofiber membrane putted in vacuum oven at 60°C for one an hour in order to remove the solvent residue.
The second membranes (Mem.2), was prepared by doped the first electrospinning solution with a ratio 3% w/v of zinc oxide nanoparticles. The new mixture was homogenized by a mechanical stirrer at 60rpm and produced in the same conditions of the electrospun first membrane.
Preparing of Adsorbents Membranes
A mechanical cutter with a 20 mm diameter was used to cut the nanofiber membranes (Mem.1) and (Mem.2), which were used in the adsorption experiments of this study as adsorbent surfaces. Fig. 2 shows the circular membrane parts and the tool used.
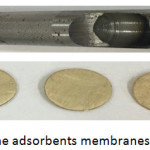 |
Figure 2: The adsorbents membranes and cutter. |
Adsorption Isotherms
The adsorption experiments were carried out through the preparation of six aqueous solutions of methylene blue dye with concentration 3, 6, 9, 12, 15 and 18 mg/L. Thereafter 25 mL from each one of the previous concentrations was putted in a glass round flask with volume 50 mL. Then a piece of electrospun nanofiber membrane was added with weight 0.015 g and diameter 2cm to these initial concentrations and placed in a water bath. The effect of adsorbent dose, contact time, ionic strength and temperature was studied and thermodynamic parameters were described.
The concentrations of methylene blue dye were determined by UV-VIS spectrophotometer PG-T80+ at 660 nm. The quantity of adsorbed dye qe mg/g was estimated according to equation (1):
where C◦ is the initial concentration of dye mg/L, Ce is the equilibrium concentration of dye mg/L, V is the solution volume of dye L and w is the membrane weight g.
Resuils and Dscussion
FTIR Analysis
FTIR Spectrum of P-Cresol Formaldehyde Polymer
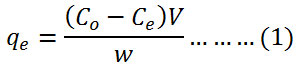
The FTIR spectrum of prepared p-cresol formaldehyde polymer is shown in Fig.3 There is a broad band at 3500-3100 cm-1 returns to the stretching vibration of phenolic O-H group. The successive three bands at 3016 cm-1, 2920 cm-1 and 2862cm-1 attributed to stretching and bending vibration of C-H bond in bridge methylene CH2 and methyl CH3 groups. The stretching bands of C=C group in aromatic ring appeared at 1603 cm-1 and 1508 cm-1. While, the band at 1477 cm-1 attributed to stretching vibration of ring C=C group that bonded with bridge methylene group. On the other hand, the band of bending vibration of the O-H phenolic group appeared at 1375 cm-1. The symmetric stretching vibration of C-O bond in C-C-OH group at 1230 cm-1 was observed. While appearance of two bands at 1103 cm-1 and 1014 cm-1 was attributed to stretching vibration of C-O bond in C-C-OH group. It is also noted that appearance of bands at 816 cm-1 and 756 cm-1 due to the out of plane bending vibration of C-H in both bridge methylene and phenolic groups.
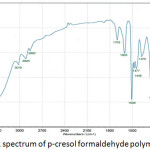 |
Figure 3: FTIR spectrum of p-cresol formaldehyde polymer. |
Ftir Spectrum of Zinc Oxide Nanoparticles
The FTIR spectrum of prepared zinc oxide nanoparticles is shown in Fig. 4.A large and powerful band was observed at 3408 cm-1 due to the stretching vibration of physical O-H group, while the band at 1618 cm-1 was attributed to the bending vibration of the H-OH group. So, the bands at 1645 cm-1 and 1122 cm-1 were due to the presence of carbon dioxide. Generally, all this bands were returned to presence of moisture and CO2 in the atmosphere which adsorbed on the surface of ZnONPs. The characterizing bands of Zn-O group were appeared in the range 604-434cm-1.20
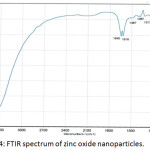 |
Figure 4: FTIR spectrum of zinc oxide nanoparticles. |
SEM Analysis
The scanning electron microscope shows the shape, porosity and diameters of electrospun nanofiber membranes. Fig. 5 and Fig. 6 showed the micrograph of both prepared membranes (Mem.1) and (Mem.2), where a net of homogeneous smooth fibers were observed. In Fig.5, noticed the diameter average of fiber which was approximately 200nm for the first membrane (Mem.1). So, Fig.6 showed the nanofiber net of the modified membrane with ZnONPs. These fibers appeared to be more swollen with average diameter approximately 500nm, this was due to the viscosity increasing of the prepared polymer solution for the spinning process. Finally, Fig. 7 showed the surface morphology of the prepared zinc oxide nanoparticles. It was high magnets which led to the adhesion of small grains and aggregated in the flake shape. Besides, the particle size of ZnONPs was approximately 60 nm.
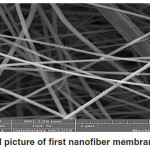 |
Figure 5: SEM picture of first nanofiber membrane (Mem.1). |
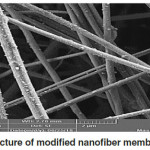 |
Figure 6: SEM picture of modified nanofiber membrane (Mem. 2). |
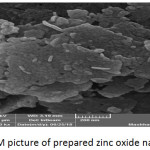 |
Figure 7: SEM picture of prepared zinc oxide nanoparticles. |
XRD Analysis
Fig. 8 showed the XRD patterns of the zinc oxide particles prepared by the sol-gel method which mentioned above. All x-ray diffraction peaks confirm the hexagonal structure of these particles. There are no additional diffraction peaks have been shown indicating the purity of the prepared particles. So, a line broadening of the diffraction peaks was observed indicating that the zinc oxide particles were in the nanometer scale.
The average of crystallite size was calculated by Debye Scherrer’s equation (2) using the full width at the half maximum of 36.2518, 31.8012 and 34.4447 of X-ray diffraction peaks.21
where D is the size of crystallite nm, λ is the wavelength of X-ray (nm), β is the full width at the half maximumand θ is the diffraction angle. The calculated average crystallite size of prepared zinc oxide nanoparticles was 60 nm.
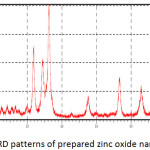 |
Figure 8: XRD patterns of prepared zinc oxide nanoparticles. |
EDX Analysis
Fig. 9, Fig. 10 and Fig. 11 illustrate the X-ray dispersion patterns of the nanofiber membranes and prepared zinc oxide nanoparticles respectively. Fig.9 and Fig. 10 showed presence of carbon and oxygen ratio as main elements of the membrane (Mem.1) and (Mem.2), while a ratio of zinc was observed in the modified membrane (Mem.2) due to doping it with zinc oxide nanoparticles. Fig. 11 referred to presence of zinc and oxygen ratio which confirmed the composition and purity of prepared ZnONPs.
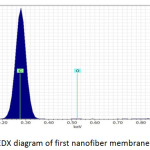 |
Figure 9: EDX diagram of first nanofiber membrane (Mem.1). |
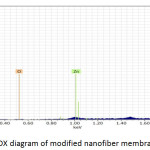 |
Figure 10: EDX diagram of modified nanofiber membrane (Mem. 2). |
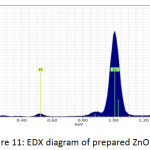 |
Figure 11: EDX diagram of prepared ZnONPs. |
The Effect Factors on the Adsorption
Effect of Contact Time
The effect of contact time on the adsorption of methylene blue dye on membranes (Mem.1) and (Mem. 2) was studied with an initial concentration 18 mg/L, 25°C and 0.01 g of both membranes, as shown in Fig. 12. It was observed that the adsorption capacity increases with increasing time until reaches a constant value after 90 min for both studied membranes. A rapid increase in adsorption capacity is observed at the initial stage, which is related to the availability of free active sites of the adsorption on the membrane surface. Then the adsorption becomes limited after a certain period of time, which was due to the occupancy of these active sites. It was also noticed that the modified membrane (Mem.2) was faster adsorbent that due to the action of zinc oxide nanoparticles as an additional active sites for adsorption.
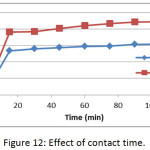 |
Figure 12: Effect of contact time. |
Effect of Adsorbent Dose
The effect of adsorbent membranes dose was studied on the adsorption of methylene blue on prepared membranes (Mem.1) and (Mem.2) with an initial concentration 18 mg/L and at 25°C as shown in Fig. 13. A gradual increase in the adsorption quantity qe of dye was observed with increasing dose of the adsorbent membrane which due to abundance of the effectiveadsorption sites that related with the increasing of surface area. The highest value was 0.015 g for both studied membranes, after that the dose becomes ineffective, as a result to the saturation of most adsorption sites.
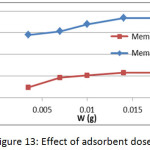 |
Figure 13: Effect of adsorbent dose. |
Effect of Initial Concentration
The effect of initial concentration on the adsorption of methylene blue dye on membranes (Mem.1) and (Mem.2) was investigated to a set of initial concentrations 3, 6, 9, 12, 15 and 18 mg/L at 25°C and 0.015 g of both membranes as shown in Fig. 14. It was generally observed that the adsorption capacity decreased with the increasing of dye concentration for both studied nanofiber membranes, this due to the increase of the dye molecules in the volume unit, which impedes their arriving and accumulation on the surface of membrane.
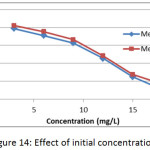 |
Figure 14: Effect of initial concentration. |
Effect of Ionic Strength
The effect of Ionic strength on the adsorption of methylene blue dye on prepared membranes (Mem.1) and (Mem.2) was determined by using NaCl and KCl aqueous solutions with concentrations 0.2, 0.4, 0.6 and 0.8 M at initial concentration 18 mg/L, 25ᵒC and 0.015 g of both adsorbent membranes, as shown in Fig. 15. The adsorption data showed that the increase in ionic strength led to increasing adsorption capacity, due to the aggregation of dye molecules by the salt in solution, thus reducing the size of molecules and increasing their hydrophobicity.22
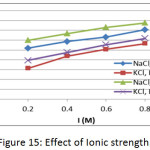 |
Figure 15: Effect of Ionic strength. |
Effect of Temperature
The effect of temperature on the adsorption of methylene blue dye on prepared membranes (Mem.1) and (Mem.2) was studied in a range of temperature 298, 303, 308, 313 and 318K at initial concentration 18 mg/L and 0.015 g of both adsorbent membranes, as shown in Fig. 16. It was observed that the adsorption capacity of the dye increases by increasing the temperature, which means the adsorption process is endothermic, which suggests that there is an absorption process in addition to the adsorption process. As the temperature increases, the dye molecules permeate inside the pores of the nanofiber membrane.23
 |
Figure 16: Effect of temperature. |
Adsorption Isotherms
The adsorption system can be described by the adsorption isotherms to guess the adsorption mechanism and type. In this research, Freundlich and Langmuirmodels were applied to adsorption of methylene blue dye on the prepared nanofiber membranes (Mem.1) and (Mem.2) from their aqueous solutions at a different for a range of temperatures 298, 303, 308, 313, and 318K at initial concentrations 3, 6, 9, 12, 15 and 18 mg/L and contact time 90 min.
Firstly, Freundlich isotherm model was investigated which commonly used to describe heterogeneous adsorption systems as represented according the following equation24:
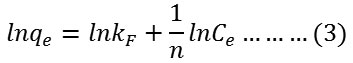
where qe is the amount of adsorbed dye at equilibrium mg/g, Ce is the concentration of absorbed dye at equilibrium mg/L and kF or n is the experimental Freundlich constants. kF and n can be estimated from intercept and slope of plotting ln qe versus ln Ce respectively.
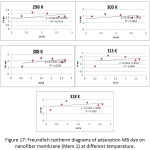 |
Figure 17: Freundlich isotherm diagrams of adsorption MB dye on nanofiber membrane (Mem.1) at different temperature. |
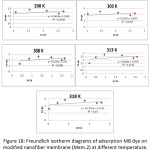 |
Figure 18: Freundlich isotherm diagrams of adsorption MB dye on modified nanofiber membrane (Mem.2) at different temperature. |
It is noted from Table 1 and Table 2, that the values of the constant kF generally increase by increasing the temperature of both studied nanofiber membranes, this means the adsorption capacity of membranes increases by increasing the temperature. So, n constant which refers to adsorption intensity, there was a an increase in its value observed by increasing the temperature of both membranes, thus leaded to the solubility Increasing of dye molecules in water, thereby the adsorption was increased on the surface of the nanofibre membranes. The modified membrane (Mem.2) had kF higher values in comparison to the first membrane (Mem.2), this was due to the thermodynamic improvement in the membrane properties which resulting from doping with zinc oxide nanoparticles. Besides, the intensity of adsorption n was had higher values in case of using the modified membrane as an adsorbent, except the last two temperatures. On the other hand, the numerical average of correlation coefficient R2 was 0.224 and 0.211 for (Mem.1) and (Mem.2) respectively. It is deduced that Freundlich isotherm model is not suitable for the studied adsorption systems.
Table 1: Freundlich constants of adsorption MB dye on nanofiber membrane (Mem.1) at different temperature.
|
Temperature K |
kf mg/kg |
n |
R2 |
|
298 |
2.610 |
2.739 |
0.2723 |
|
303 |
3.723 |
3.509 |
0.2861 |
|
308 |
4.499 |
3.670 |
0.2393 |
|
313 |
6.260 |
5.485 |
0.1043 |
|
318 |
7.530 |
5.724 |
0.1569 |
Table 2: Freundlich constants of adsorption MB dye on nanofiber membrane (Mem.2) at different temperature.
|
Temperature K |
kf mg/kg |
n |
R2 |
|
298 |
4.755 |
4.144 |
0.2931 |
|
303 |
5.130 |
4.288 |
0.2559 |
|
308 |
5.362 |
5.133 |
0.2082 |
|
313 |
7.972 |
5.417 |
0.1739 |
|
318 |
8.594 |
5.580 |
0.1900 |
Secondly, Langmuir isotherm model was applied which normally used to describe the monolayer adsorption systems as given in the following equation25:
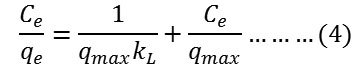
where qe is the amount of adsorbed dye at equilibrium mg/g, Ce is the concentration of absorbed dye at equilibrium mg/L and qmax or kL is the experimental Langmuir constant. The Langmuir constants were extracted from plotting Ce/qe versus Ce. The values of qmax were obtained from the slope of the straight line equation while the values of kL were extracted from the intercept of that straight line.
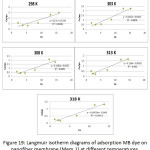 |
Figure 19: Langmuir isotherm diagrams of adsorption MB dye on nanofiber membrane (Mem.1) at different temperatures. |
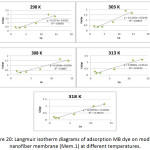 |
Figure 20: Langmuir isotherm diagrams of adsorption MB dye on modified nanofiber membrane (Mem.1) at different temperatures. |
Table 3 and Table 4 showed an increase in the value of kL with increasing temperature for both studied membranes, this indicated on the adsorption increasing of dye as the temperature increases. The adsorption system of modified membrane (Mem.2) had higher values than the first membrane (Mem.2) for all temperatures. This was due to the improvement in the adsorption properties which resulted from the doping with zinc oxide nanoparticles. On the other hand, there is an increase in the value of the amount of adsorption qe max was observed as the temperature increases for both the studied membranes. The modified membrane also had higher values than first membrane at different temperatures.
In general, the correlation coefficient values of the modified membrane were more consistent with the Langmuir isotherm model than the first membrane, where was 0.878 for the first membrane while 0.916 for the modified membrane. This means zinc oxide nanoparticles increased the fitting of the adsorption system on the Langmuir model.
When thecomparison accrued between the correlation coefficient values of Freundlich and Langmuir, it was founded that the latter is most suitable to describe the adsorption isotherm.
Table 3: Langmuir constants of adsorption MB dye on nanofiber membrane (Mem.1) at different temperatures.
|
Temperature K |
kLL\mg |
qe max mg\kg |
R2 |
|
298 |
1.288855 |
5.882353 |
0.8186 |
|
303 |
2.330658 |
6.887052 |
0.8878 |
|
308 |
2.967593 |
7.800312 |
0.8401 |
|
313 |
6.373626 |
8.62069 |
0.9020 |
|
318 |
10.86667 |
10.22495 |
0.9453 |
Table 4: Langmuir constants of adsorption MB dye on nanofiber membrane (Mem.2) at different temperatures.
|
Temperature K |
kLL\mg |
qe max mg\kg |
R2 |
|
298 |
3.606232 |
7.85546 |
0.8958 |
|
303 |
4.98374 |
8.156607 |
0.8937 |
|
308 |
8.220588 |
8.944544 |
0.8887 |
|
313 |
7.306452 |
11.03753 |
0.9433 |
|
318 |
13.01515 |
11.64144 |
0.9619 |
Thermodynamic Functions
The thermodynamic functions of the adsorption of methylene blue dye on the nanofiber membranes (Mem.1) and (Mem.2) were estimated, Table 5 and Table 6 showed the calculated values of these functions. The standard enthalpy value ∆Hᵒ was abstracted from the slope of van’t Hoff equation when plotted lnk versus 1/T according the following equation:
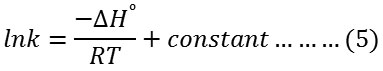
where k is thermodynamic equilibrium constant, ∆Hᵒ is the adsorption enthalpy, R is the universal gasconstant, T is the absolute temperature K. The standard free Gibbs energy ∆Gᵒ was estimated from the following equation:
∆Gᵒ = – RTlnk … … …(6)
The value of the standard entropy change (ΔS°) was also founded by a Gibbs equation of equilibrium:
∆Gᵒ =∆Hᵒ -T∆Sᵒ … … …(7)
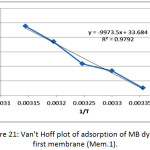 |
Figure 21: Van’t Hoff plot of adsorption of MB dye on first membrane (Mem.1).Click here to View figure |
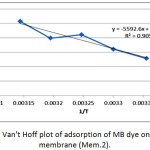 |
Figure 22: Van’t Hoff plot of adsorption of MB dye on modified membrane (Mem.2).Click here to View figure |
Table 6: The thermodynamic function values of adsorption of MB dye on nanofiber membrane (Mem.1).
|
Temperature K |
∆G⁰ J/mol |
∆H⁰ J/mol |
∆S⁰ J/mol |
|
298 |
-628.694 |
+82919.679 |
+82919.679 |
|
303 |
-2131.574 |
|
+266.6274 |
|
308 |
-2785.417 |
|
+260.1762 |
|
313 |
-4819.865 |
|
+249.5202 |
|
318 |
-6307.438 |
|
+240.919 |
Table 7: The thermodynamic function values of adsorption of MB dye on modified nanofiber membrane (Mem.2).
|
Temperature K |
∆G⁰ J/mol |
∆H⁰ J/mol |
∆S⁰ J/mol |
|
298 |
-3177.891 |
+46496.8764 |
+145.365 |
|
303 |
-4046.197 |
|
+140.1013 |
|
308 |
-5394.503 |
|
+133.4493 |
|
313 |
-5175.308 |
|
+132.0178 |
|
318 |
-6784.426 |
|
+124.8819 |
The thermodynamic functions are shown in Tables 6 and Table 7, for the both studied nanofiber membranes, the positive values of ∆Hᵒ showed that the adsorption process was endothermic, so it included a diffusion process of dye molecules within the internal pores of the nanofiber membranes to reach the effective internal sites and this diffusion increases with temperature.26 Also, when comparing the two values of the two studied nanofiber membranes, it was noticed the value of (Mem.1) is higher than its value for the modified membranes (Mem.2), which means that zinc oxide nanoparticles reduce the energy consumed by the adsorption process.
The experimental results of the negative values of Gibbs function for both membranes and all temperatures indicated that the adsorption process was spontaneous at all stages. These values for the first membrane were higher than the modified membrane, demonstrating that ZnONPs increased the process spontaneously.
The measured positive ∆Sᵒ values of the studied membrane referred that the dye molecules are in a continuous movement on the surface of the nanofiber membrane than in the solution. This supports the adsorption process combined with a diffusion process. In general the entropy values of the modified membrane were lower compared to the first membrane at different temperatures may be attributed to the order increasing of the dye molecules on the surface of the membrane which due to the presence of zinc oxide nanoparticles that acted as nuclei for the aggregation of molecules.
Conclusion
Two types of electrospun nanofiber membranes were prepared by electrospinning technique and used as adsorbents surfaces to adsorb methylene blue dye from their aqueous solutions at different temperatures. Then, the optimization of adsorption process was investigated. The adsorption isotherms described by Freundlich and Langmuir models,it was founded that the latter is most suitable to describe the adsorption isotherm. So, thermodynamic functions values ∆G, ∆H and ∆S of adsorption were estimated.
Acknowledgements
We are very pleased to thank the Laboratory Service Central located in College of Education for Pure Science- Ibn Al-Haitham/ University of Baghdad.
References
- Nasuha, N.; Hameed, B. H., Adsorption of methylene blue from aqueous solution onto NaOH-modified rejected tea, Chemical engineering journal, 2011, 166(2), 783-786.
CrossRef - Auerbach, S. S.; Bristol, D. W.;Peckham, J. C.;Travlos, G. S.; Hébert, C. D.;& Chhabra, R. S., Toxicity and carcinogenicity studies of methylene blue trihydrate in F344N rats and B6C3F1 mice, Food and chemical toxicology, 2010, 48(1), 169-177.
CrossRef - Jack Clifton, I. I.;Leikin, J. B., Methylene blue, American journal of therapeutics, 2003, 10(4), 289-291.
CrossRef - Wu, J. S.; Liu, C. H.; Chu, K. H.;Suen, S. Y., Removal of cationic dye methyl violet 2B from water by cation exchange membranes, Journal of membrane science,2008, 309(1-2), 239-245.
CrossRef - Fan, L.; Zhou, Y.; Yang, W.; Chen, G.; Yang, F., Electrochemical degradation of aqueous solution of Amaranth azo dye on ACF under potentiostatic model, Dyes and pigments, 2008, 76(2), 440-446.
CrossRef - Banerjee, P.;DasGupta, S.; De, S., Removal of dye from aqueous solution using a combination of advanced oxidation process and nanofiltration, Journal of hazardous materials,2007, 140(1-2), 95-103.
CrossRef - Ren, R.; Liu, D.; Li, K.; Sun, J.; Zhang, C., Adsorption of quaternary ammonium compounds onto activated sludge. Journal of water resource and protection, 2011, 3(2), 105-113.
CrossRef - Iqbal, J.; Kim, H. J.; Yang, J. S.;Baek, K.; Yang, J. W., Removal of arsenic from groundwater by micellar-enhanced ultrafiltration (MEUF), Chemosphere,2007, 66(5), 970-976.
CrossRef - Ahsan, S.;Kaneco, S.;Ohta, K.; Mizuno, T.;Kani, K., Use of some natural and waste materials for waste water treatment,Water research,2001,35, 3738-3742.
CrossRef - Crini, G., Non-conventional low-cost adsorbents for dye removal: a review, Bioresource technology,2006, 97(9), 1061-1085.
CrossRef - Figueiredo, S. A.; Matos Freitas, O.,Adsorption kinetic of removal of yellow lanasol dyestuff using gallinaceo us feathers, Environmental engineering &management journal (EEMJ),2013, 12(11).
- Nasuha, N.; Hameed, B. H.; Din, A. T. M., Rejected tea as a potential low-cost adsorbent for the removal of methylene blue, Journal of hazardous materials,2010, 175(1-3), 126-132.
CrossRef - Suteu, D.;Rusu, L.,Removal of methylene blue dye from aqueous solution using seashell wastes as biosorbent, environmental engineering &management journal (EEMJ),2012, 11(11).
- Wang, L.; Zhang, J.; Wang, A., Fast removal of methylene blue from aqueous solution by adsorption onto chitosan-g-poly (acrylic acid)/attapulgite composite, Desalination,2011, 266(1-3), 33-39.
CrossRef - Tiwari, D. K.; Bhabhi, J.; Sen, P., Applications of nanoparticles in wastewater treatment, J. World applied Sci.,2008, 3(3) , 417-433.
- Matlock-Colangelo, L.;Colangelo, N. W.;Fenzl, C.; Frey, M. W.;Baeumner, A. J., Passive mixing capabilities of micro-and nanofibreswhen used in microfluidic systems, Sensors,2016, 16(8), 1238.
CrossRef - Ayodele, A. T.;Valizadeh, A.;Adabi, M.;Esnaashari, S. S.;Madani, F.;Khosravani, M.;Adabi, M.,Biointerfaceresearch in applied chemistry. Ultrasound,2017, 69, 70.
- Adabi, M.; Saber, R.;Faridi-Majidi, R.;Faridbod, F., Performance of electrodes synthesized with polyacrylonitrile-based carbon nanofibers for application in electrochemical sensors and biosensors, Materials science and engineering: C,2015, 48, 673-678.
CrossRef - Naser, J. A.;Himdan, T. A.;Ibraheim, A. J., Adsorption kinetic of malachite green dye from aqueous solutions by electrospunnanofiber Mat, Orient.J.chem,2017, 33(6), 3121-3129.
- Jurablu, S.;Farahmandjou, M.;Firoozabadi, T. P., Sol-gel synthesis of zinc oxide (ZnO) nanoparticles: study of structural and optical properties, Journal of Sciences, Islamic republic of Iran,2015, 26(3), 281-285.
- Aytimur, A.;Uslu, İ.;Çınar, E.;Koçyiğit, S.;Özcan, F.;Akdemir, A., Synthesis and characterization of boron doped bismuth–calcium–cobalt oxide nanoceramic powders via polymeric precursor technique, Ceramics international,2013, 39(2), 911-916.
CrossRef - Ahmad, K. S., Evaluating the adsorption potential of alachlor and Its subsequent removal from soils via activated carbon, soil and sediment contamination: An international journal,2018, 1-18.
- Ravi, V. P.;Jasra, R. V.; Bhat, T. S., Adsorption of phenol, cresol isomers and benzyl alcohol from aqueous solution on activated carbon at 278, 298 and 323 K, Journal of chemical technology &biotechnology: International research in process, environmental &clean technology,1998, 71(2), 173-179.
- Maderova, Z.;Baldikova, E.;Pospiskova, K.;Safarik, I.;Safarikova, M., Removal of dyes by adsorption on magnetically modified activated sludge, International journal of environmental science and technology,2016, 13(7), 1653-1664.
CrossRef - Langmuir, I., The adsorption of gases on plane surfaces of glass, mica and platinum, Journal of the americanchemical society,1918, 40(9), 1361-1403.
CrossRef - Davis, K. M.;Deuchar, J. A.;Ibbitson, D. A, Adsorption of phenols from non-polar solvents on to silica gel, Journal of the chemical society, faraday transactions 1: Physical chemistry in condensed phases,1973, 69, 1117-1126.

This work is licensed under a Creative Commons Attribution 4.0 International License.
![]()
A New Edition of Web of Science
Journal Impact Factor
2022: 0.5
Five Year: 0.8
Journal is Indexed in

Cabells Whitelist
![]()


