An Investigation of Textile Wastewater Treatment using Chlorella Vulgaris
P. S. Subashini and P. Rajiv
Department of Biotechnology, Karpagam Academy of Higher Education, Coimbatore, India.
Corresponding Author E-mail: rajivsmart15@gmail.com
DOI : http://dx.doi.org/10.13005/ojc/340538
Article Received on : 16-04-2018
Article Accepted on : 03-08-2018
Article Published : 12 Sep 2018
An uptake system for the bio-remediation of textile wastewater using Chlorella vulgaris DPSF01. Chlorella vulgaris is mass cultured in raw textile wastewater diluted with normal tap water and the growth was assessed. The research work focus on to evaluate the potential of C. vulgaris on reduction of physicochemical properties and azo compounds in textile wastewater. Treatment of textile wastewater with C. vulgaris is carried out for 28 days. The microalga is inoculated on four dilutions (15%, 30%, 45% & 60%) of textile wastewater. Cell count of C. vulgaris and physicochemical parameters of the treated and untreated wastewater is enumerated once in seven days interval of 28 days. Degradation of azo compounds on treated and untreated wastewater by C. vulgaris was confirmed by GCMS and FTIR analysis. The results confirm that C. vulgaris DPSF01 has improved the quality of textile wastewater to meet its permissible limits for discharge into the environment.
KEYWORDS:Azo Compounds; C. Vulgaris; FTIR; GCMS; Physicochemical Properties; Textile Wastewater
Download this article as:| Copy the following to cite this article: Subashini P. S, Rajiv P. An Investigation of Textile Wastewater Treatment using Chlorella Vulgaris. Orient J Chem 2018;34(5). |
| Copy the following to cite this URL: Subashini P. S, Rajiv P. An Investigation of Textile Wastewater Treatment using Chlorella Vulgaris. Orient J Chem 2018;34(5). Available from: http://www.orientjchem.org/?p=49594 |
Introduction
Textile industries are one of the rapid growing sectors in India. There are 21,076 textile units in India of which 5,285 units in Tamilnadu.1 Textile processing includes sizing, de-sizing, scouring, bleaching, dyeing, rinsing and finishing. Thus, the textile effluent consists of different pollutants (dyes, surfactants, acid, bases, salts, heavy metals and addictives like anti-foaming and whitening agent, etc.,2 One kilogram of cloth production requires 45 to 60 L of water hence textile industry is one of the high consumer of water in all over the world.3
In the treatment of textile effluent, bio-technological methods reveal the best comparing to the physical and chemical methods. Due to the long growth and less decolourization factor, fungal system becomes unfit for the bioremediation of textile effluent.4 In case of bacteria, decolourization of textile dye is 60 to 80% on cultivation of 44 hrs.5 Micro-algae are the best in the remediation of textile effluent by removal of nitrogen, phosphorus and carbon from wastewater, thereby reducing eutrophication.6 Micro-algae are capable of sequestering carbon dioxide in seawater, industrial wastewater, salt marshes, sewage wastewater and diverse wastewater by which reduces greenhouse effect.7
The use of micro-algae or macro-algae for the removal of pollutants from wastewater is known as phycoremediation. Number of micro-algae like Chlorella marina, Isochrysis galbana, Tetraselmis sp, Nanochloropsis sp and Dunaliella salina are concluded as the best tool in the removal of textile dye from the effluent.8 The objective of the current research is to investigate the reduction of physicochemical parameters pH, EC, Biological Oxygen Demand (BOD), Chemical Oxygen Demand (COD), Total Solids (TS), Total Dissolved Solids (TDS), Total Hardness (TH), Chloride, Bicarbonate, Magnesium, Ammoniacal nitrogen and Phosphate), heavy metals (Copper, Zinc Chromium, Iron and Nickel), and functional groups from the textile wastewater.
Methodology
Stock Culture of Micro-Algae
Chlorella vulgaris DPSF01 was obtained from the Department of Marine Science, Bharathidasan University, Tiruchirappalli, Tamilnadu, India. The culture was grown on Bold’s Basal Medium (BBM) at optimum condition of 20±23ºC with 12 hrs light and 12 hrs dark.9 All the chemicals were purchased from MERCK, Mumbai, India.
Collection and Source of Textile Wastewater
The wastewater was collected from a textile garment located at Tiruppur, Tamilnadu. Tiruppur is the fourth largest city in Tamilnadu with latitude 11.1085° N and longitude 77.3411° E. The garment undergoes physical, chemical and biological methods to treat the textile wastewater before final discharge. The wastewater was collected in a sterile cane and was stored at 4ºC for further deactivation. The physical (pH and EC) and chemical parameters (BOD, COD, TS, TDS, TH, chloride, magnesium, phosphate, ammoniacal nitrogen and bicarbonate) of the wastewater were analysed according to the APHA methods (1989).
Experimental Procedure of Phycoremediation
Four dilutions of textile wastewater were done which are 15% of textile wastewater was diluted with tap water (D1), 30% of textile wastewater was diluted with tap water (D2), 45% of textile wastewater was diluted with tap water (D3), 60% of textile wastewater was diluted with tap water (D4), 75% of textile wastewater was diluted with tap water (D5) and 100% raw textile wastewater (D6).11 75% and 100% were not used in the experiment because of micro-alga growth was not observed.
Analysis of Algal Cell Count
The cell count was determined using haemocytometer and microscope. The procedure for the cell count was followed by Lackey Drop Micro Transect method.12 Algal count was enumerated at the interval of seven days (7th, 14th, 21st and 28th day).
Chlorophyll Estimation
A 20 ml of culture was centrifuged at 10,000 rpm for 10 min. The pellet was mixed with DMSO and again the mixture was centrifuged at 5000 rpm for 10 min for re-extraction. After centrifugation, the supernatant was measured at 645 nm and 663 nm absorbance in spectrophotometer according to Arnon (1949).
Analysis of Physicochemical Parameters
The collected wastewater was subjected to physical and chemical tests such as pH, EC, BOD, COD, TS, TDS, TH, chloride, magnesium, phosphate, ammoniacal nitrogen and bicarbonate. The physicochemical parameters were estimated by APHA (1989) at the interval of seven days (7th, 14th, 21st and 28th day). pH and electrical conductivity of the treated and untreated wastewater was assessed using ELICO model – 107 and ELICO model – 180 respectively. To analyse BOD, the sample and blank (dilution water) was incubated at 20ºC for five days. Initial DO was measured for both blank and sample before five days and final DO was measured after five days. BOD is the difference between initial DO and final DO. The COD was quantified by stirring the sample with ferroin indicator and titrating against ferrous ammonium sulphate solution. The variation in the volume of blank and sample on titration is the measure of COD. Total hardness of the treated and untreated wastewater was estimated using EDTA-trimetric method. The amount of CaCO3 in the water represents the total hardness of the water. Protocol of Nesslerisation method was followed to determine the ammoniacal nitrogen of treated and untreated wastewater. Chloride ion is the major inorganic anion in wastewater and was measured by titrating the sample against silver nitrate solution. Estimation of phosphate in treated and untreated wastewater was done using membrane filtration technique. Total solids and total dissolved solids were analysed before and after treatment using the Whatmann filter paper. Heavy metals were analysed using Atomic Adsorption Spectrophotometer (1983-400 HGA 900/AS 800 Perkin Elmer) and Multi-Element Standard (MERCK-112837) during the time interval of 7days.14
Statistical Analysis
Experiments were carried out with three replications. Results were presented with the means ± standard errors for all the three replicates.
FTIR and GCMS Analysis
Fourier transformed infrared spectral analysis was used to determine the functional groups on the cell surface of micro-algae before and after treatment. The spectra were recorded on the wavelength between 4000 – 400 cm-1 using FTIR spectroscopy of model Perkin-Elmer 1725x. Raw and treated wastewater were mixed with the mixture of methanol and water (9:1) and incubated in shaker for overnight at room temperature. The sample was filtered using Whatmann filter paper and dried in hot air oven. After drying, the pellet was collected.15 Degradation of azo compounds was determined by GC-MS Thermo MS DSQ II, gas carrier helium (1.0 ml/min), capillary column.16
Results and Discussion
Analysis of Algal Growth
Algal cell count was found to be 785 × 103 cells mL-1 in D1 on the 28th day whereas in D3 and D4 limited growth was observed. High growth of algae in textile wastewater was observed due to the presence of carbon, nitrogen, phosphorus, salt and toxicants like benzidine and naphthalene limited the growth of algae.17,18 The lowest algal cells (442 × 103 cells mL-1) were found in D4 dilution (figure-1).
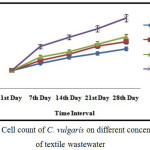 |
Figure 1: Cell count of C. vulgaris on different concentration of textile wastewater. |
Chlorophyll Count on Textile Wastewater
Chlorophyll count was found to be high in D1 and D2, due to higher dilution (figure-2). Maximum count of chlorophyll a was 0.73 µg/ml and chlorophyll b was 0.26 µg/ml in D1 dilution on the 28th day of the treatment. The colour change of textile wastewater from dark green to algal green was due to the high count of chlorophyll a and b.19
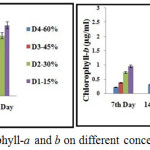 |
Figure 2: Estimation of chlorophyll-a and b on different concentration of textile wastewater. |
Physicochemical Parameters of Raw and Treated Textile Wastewater
Physicochemical parameters of treated and untreated wastewater were shown in the Table 1 & 2. The change in pH from neutral (6.25) to basic (8.63) was due to the photosynthesis of microalga which reduces the concentration of dissolved CO2.20 The electrical conductivity of textile wastewater was reduced from 11.08 dsm-1 to 1.84 dsm-1 after the treatment with C. vulgaris. High value of BOD made the water unable to receive the dissolved oxygen leading to anaerobiosis which killed the aquatic organisms.21 In the present study, C. vulgaris was able to reduce BOD from 782 mg L-1 to 121 mg L-1 after the treatment thereby, reducing the toxicity level. The bioconversion of carbon in organic pollutants to CO2 by C. vulgaris was reduced COD from 1700 mg L-1 to 243 mg L-1.22 Removal of TDS from 4923 mg L-1 to 753 mg L-1 was due to the unique mechanism of biosorption by C. vulgaris.23 The reduction of total hardness from 1054 mg L-1 to 368 mg L-1 was due to the precipitation of CaCO3 by micro-algae for their growth.24 The uptake of ammoniacal nitrogen from textile wastewater (10 mg L-1 to 5.86 mg L-1) was achieved by the process of denitrification by C. vulgaris.25 The uptake of phosphate from wastewater was mainly for the usage of phosphorus for ATP and nucleic acid production.26 After the treatment of textile wastewater with C. vulgaris the magnesium was reduced from 87 mg L-1 to 30 mg L-1. As the heavy metals were below the permissible limits of BIS-1994,27 in raw textile wastewater and the further analysis of heavy metals was not done.
Table 1: Physicochemical properties of textile wastewater before and after treatment.
| S.NO | Parameters | Raw Effluent | Treated Effluent |
| 1 | pH | 6.25±0.16 | 8.63±0.20 |
| 2 | EC (dsm-1) | 11.08±0.05 | 1.84±0.17 |
| 3 | Biological Oxygen Demand (mg L−1) | 782±8.02 | 121±8.50 |
| 4 | Chemical Oxygen Demand (mg L−1) | 1700±11.53 | 243±4.35 |
| 5 | Total Solids (mg L−1) | 5483±12.58 | 1209±6.65 |
| ± | |||
| 6 | Total Dissolved Solids (mg L−1) | 4923±8.96 | 753±6.42 |
| 7 | Chloride (mg L−1) | 286±7 | 106±7.37 |
| 8 | Total hardness (mg L−1) | 1054±6.42 | 368±7.93 |
| 9 | Bicarbonate (mg L−1) | 541±5.50 | 268±9.64 |
| 10 | Magnesium (mg L−1) | 87±4.93 | 30±2.88 |
| 11 | Ammoniacal Nitrogen (mg L−1) | 10±4.35 | 5.86±0.14 |
| 12 | Phosphate (mg L−1) | 12±4.61 | 6.87±0.21 |
| Heavy Metals (ppb) | |||
| 1 | Copper | 4.23±0.08 | – |
| 2 | Zinc | 3.32±0.04 | – |
| 3 | Chromium | 3.56±0.05 | – |
| 4 | Iron | 17.77±0.20 | – |
| 5 | Nickel | 0.29±0.03 | – |
| 0.13 | |||
Table 2: Evaluation of physicochemical parameters during phycoremediation of textile wastewater.
| Physical Parameters | |||||
| pH Variations | |||||
| Treatments | 1st day | 7th day | 14th day | 21st day | 28th day |
| Control | 6.25±0.16 | 6.25±0.10 | 6.25±0.06 | 6.25±0.08 | 6.25±0.09 |
| T3 (60%) | 6.88±0.20 | 6.90±0.13 | 6.95±0.05 | 7.22±0.10 | 7.52±0.13 |
| T4 (45%) | 7.02±0.15 | 7.21±0.16 | 7.46±0.17 | 7.64±0.06 | 7.83±0.18 |
| T5 (30%) | 7.55±0.12 | 7.92±0.22 | 8.12±0.14 | 8.28±0.09 | 8.38±0.22 |
| T6 (15%) | 8±0.09 | 8.21±0.15 | 8.33±0.11 | 8.46±0.10 | 8.63±0.20 |
| Electrical Conductivity (dSm-1) | |||||
| Control | 11.08±0.05 | 11.08±0.03 | 11.08±0.09 | 11.08±0.10 | 11.08±0.06 |
| T3 (60%) | 9.22±0.08 | 9.12±0.09 | 9.05±0.10 | 9.00±0.07 | 8.96±0.12 |
| T4 (45%) | 7.38±0.10 | 7.22±0.16 | 7.08±0.11 | 6.93±0.10 | 6.74±0.10 |
| T5 (30%) | 5.55±0.13 | 5.26±0.14 | 4.94±0.15 | 4.69±0.13 | 4.37±0.16 |
| T6 (15%) | 3.42±0.12 | 3.03±0.13 | 2.68±0.19 | 2.28±0.16 | 1.84±0.17 |
| Chemical Parameters | |||||
| Biological Oxygen Demand (mg L−1) | |||||
| Treatments | 1st day | 7th day | 14th day | 21st day | 28th day |
| Control | 782±8.02 | 782±9.26 | 782±8.08 | 782±11.06 | 782±12.74 |
| T3 (60%) | 760±13.86 | 711±11.93 | 666±10.65 | 615±15.94 | 566±13.65 |
| T4 (45%) | 744±8.76 | 663±9.90 | 577±13.89 | 494±11.40 | 419±15.02 |
| T5 (30%) | 737±12.49 | 620±8.14 | 501±8.38 | 386±11.62 | 268±10.69 |
| T6 (15%) | 725±9.26 | 574±10.10 | 426±12.42 | 271±10.52 | 121±8.50 |
| Chemical Oxygen Demand (mg L−1) | |||||
| Control | 1700±11.53 | 1700±15.27 | 1700±15.13 | 1700±10.58 | 1700±10.58 |
| T3 (60%) | 1669±7.57 | 1582±10.81 | 1491±6.35 | 1393±9.29 | 1297±5.85 |
| T4 (45%) | 1648±8.32 | 1480±6.42 | 1315±7.21 | 1147±7.93 | 976±6.80 |
| T5 (30%) | 1629±11.59 | 1379±5.50 | 1137±6.08 | 882±6.42 | 624±8.71 |
| T6 (15%) | 1609±8.50 | 1268±7 | 923±5.50 | 583±9.53 | 243±4.35 |
| Total Solids (mg L−1) | |||||
| Control | 5483±12.58 | 5483±13.07 | 5483±8.08 | 5483±9.84 | 5483±12.34 |
| T3 (60%) | 5297±6.35 | 5170±7 | 5038±7.81 | 4907±10.21 | 4776±7.37 |
| T4 (45%) | 5270±9.29 | 4857±10.40 | 4449±9.16 | 4039±8.71 | 3620±10.96 |
| T5 (30%) | 5129±10.96 | 4466±10.01 | 3796±8.38 | 3123±7.93 | 2431±8.50 |
| T6 (15%) | 5003±6.08 | 4055±10.58 | 3114±10.81 | 2163±6.80 | 1209±6.65 |
| Total Dissolved Solids (mg L−1) | |||||
| Control | 4923±8.96 | 4923±9.29 | 4923±7.81 | 4923±8.18 | 4923±7.26 |
| T3 (60%) | 4688±6.24 | 4584±6.65 | 4484±6.55 | 4375±5.19 | 4273±5.29 |
| T4 (45%) | 4620±7.23 | 4309±7.57 | 4003±7.21 | 3692±5.77 | 3377±8.14 |
| T5 (30%) | 4545±6.80 | 3694±5.68 | 3389±6.42 | 2809±7 | 2222±7.09 |
| T6 (15%) | 4453±5.68 | 3528±5.50 | 2600±7.51 | 1670±6.08 | 753±6.42 |
| Total Hardness (mg L−1) | |||||
| Control | 1054±6.42 | 1054±6.65 | 1054±6.08 | 1054±7.93 | 1054±7.81 |
| T3 (60%) | 1049±9.86 | 1028±8.41 | 1010±7.23 | 990±7.37 | 967±9.64 |
| T4 (45%) | 1044±7 | 990±7.81 | 931±6.80 | 873±5.85 | 831±6.92 |
| T5 (30%) | 1036±5.85 | 929±7.57 | 828±6.42 | 720±6.92 | 611±8.71 |
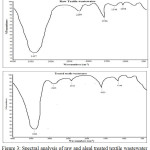 |
Figure 3: Spectral analysis of raw and algal treated textile wastewater. |
GC-MS Analysis of Treated and Untreated Textile Wastewater
Figure 4 a and b shows the degradation of azo compounds by C. vulgaris. Azo compounds present in raw textile wastewater are 4-Imidazolacetic acid butyl ester (Mol wt: 182; RT: 11.49), N-[2-(3-methylphenoxy)ethyl]-1H-1,2,4-triazole-5-carboxamide (Mol wt:246; RT: 30.99) and 5-(3,4-Bis[(trimethylsilyl)oxy]-1,5-cyclohexadien-1-yl)-3-methyl-5-phenyl-1-(trimethylsilyl)-2,4-imidazolidinedione (Mol wt: 516; RT: 34.29). After the treatment with C. vulgaris the textile wastewater is lack of these azo compounds completely. The azo reductase of C. vulgaris is responsible for the breakdown of N=N in azo compound.31
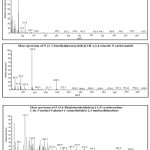 |
Figure 4a: GC-MS chromatogram of raw textile wastewater. |
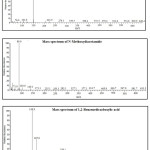 |
Figure 4b: GC-MS chromatogram of algal treated textile wastewater. |
Conclusion
The present study suggests that C. vulgaris is a suitable tool for the bio-remediation of textile wastewater. Degradation of azo compounds by C. vulgaris reduces the toxicity of textile wastewater to a considerable level. Treatment of textile wastewater using C. vulgaris is cost-effective and the treated wastewater can also be analysed for plant growth. The usage of C. vulgaris treated textile wastewater for industrial purposes and the mechanism of heavy metal removal will be reviewed in future.
Acknowledgment
The research was supported by Bharathidasan University, Department of Environmental Science which provided the C. vulgaris.
References
- Bal, A.S. Indian. J. Environ. Health 1999, 41, 264–290.
- Zaharia, C.; Suteu, D. Textile organic dyes characteristics, polluting effects, and separation/elimination procedures from industrial effluents. A critical overview. In: Puzyn, T.; Mostrag- Szlichtyng, A. Organic pollutants—ten years after the Stockholm convention. Environmental and analytical update. (Intech Publisher Inc.) eds. Rijeka., 2012, 55–86.
- Manu, B.; Chaudhari, S. Bioresour. Technol 2002, 82,225–231.
CrossRef - Banat, I.M.; Nigam, P.; Singh, D.; Marchant, R. Bioresour. Technol 1996, 58, 217–227.
CrossRef - Banat, I.M.; Nigam, G.; Mullam M.C.; Marchant, R. Environ. Int 1997, 23, 547–551.
CrossRef - Olguin, E.J. Biotechnol. Adv 2003, 22, 1–91.
CrossRef - Mata, T.M.; Martina, A.A.; Sikdar, S.; Costa, C.A.V. Clean. Technol. Environ. Policy 2011, 13, 655–671.
CrossRef - Dinesh Kumar, P.; Santhanam, P.; Nandha kumar, R. Afr. J. Biotech 2014, 22, 2288–2294.
- Nichols, H.E. Growth media freshwater. Handbook of phycological methods: Culture methods and growth measurements. (Cambridge University press, Cambridge) ed. Stein, J.1973, 7–24.
- Clesceri, L.S.; Greenberg, A.E.; Trussel, R.R. Standard methods for the examination of water and wastewater. (17th edn, American Public Health Association, Washington, DC). 1989.
- Cindrella, D.; Naseera, K.; Anirudh, R.; Ram Murti, M.; Nagappa, R. J. Appl. Phycol 2016.
- Dilek Yalcin, D.; Abel, U.; Udoh, Tulay, O.; Aydin, A.; Ilkay Acikgoz, E;. Kazim, Y.; Deniz, G. Afr. J. Biotech 2012, 11, 3817–3824.
- Durai, G.; Rajasimman, M. J Env. Sci and Technol 2011, 4, 1–17.
CrossRef - Brandenburg, K.; Seydel, U. Fourier transform infrared spectroscopy of cell surface polysaccharides. Infrared Spectroscopy of Biomolecules, (Wiley, Chichester) eds. Mantsch, H.H.; Chapman, D., 1996, 203–278.
- Lenore S Clesceri. Standard Methods for the Examination of Water and Wastewater;. 20th Edn, American Public Health Association, Washington, DC, USA. 1998.
- Arnon, D.I. Plant physiology 1949, 24, 1–15.
CrossRef - Fraile, A.; Penche, S.; González, F.; Blázquez, M.L.; Muñoz, J.A.; Ballester, A. Chemistry and Ecology 2005, 21, 61–75.
CrossRef - Sharma, S.; Shikha, R. Int. Res. J. Environ. Sci 2015, 4, 44–53.
- Elumalai, S.; Sarvanan, G.K.; Ramganesh, S.; Sakahivel R.; Prakasam, V. I. j.Sci. Inno. Dis 2013, 3, 31–37.
- Donmez, G.; Aksu, Z. Process. Biochem 2002, 38, 751–762.
CrossRef - Hanumantha Rao, P.; Ranjith Kumar, R.; Raghavan, B.G.; Subramanian, V.V.; Sivasubramanian, V. Water. SA 2011, 37, 7–14.
- S. Elumalai, G.K.; Saravanan, S.; Ramganesh, R.; Sakthivel, V.; Prakasam. I.J.S.I.D 2013, 3, 31–37.
- Choi, H-J.; Lee, S-M. Environ. Eng. Res 2012, 17, 3–8.
CrossRef - Abdel-Raouf , N.; Al-Homaidan, A.A.; Ibraheem, I.B.M. Saudi. J. Biol. Sci 2012, 19:257–275.
CrossRef - Nanda, S.; Sarangi, P.K.; Abraham, J. N. Y. Sci J 2010, 3, 37–41.
- Sengar , R.M.S.; Singh, K.K.; Singh, S. Ind . J. Sci. Res 2011, 2, 33–39.
- Becker, E.W. Microalgae-biotechnology and microbiology. Cambridge University Press, Cambridge. 1994.
- Bureau of Indian Standards (BIS). Quality tolerance for water for Tanning industry. IS: 4221, New Delhi. 1994.
- Benning, L.G.; Phoenix, V.R.; Yee, N.; Tobin, M.J. Geocimica et Cosmochimica Acta 2004, 68: 729–741.
CrossRef - Lau, P.S.; Lee, H.Y.; Tsang, C.C.K.; Tam, N.F.Y.; Wong, Y.S. Environ. Technol 1999, 20, 953–961.
CrossRef - Lin, J.; Liu Houtian. Environ. Pollut 1992, 75, 273–278.
CrossRef

This work is licensed under a Creative Commons Attribution 4.0 International License.
![]()
A New Edition of Web of Science
Journal Impact Factor
2022: 0.5
Five Year: 0.8
Journal is Indexed in

Cabells Whitelist
![]()


