Synthesis and Structural Profile Analysis of the MgO Nanoparticles Produced Through the Sol-Gel Method Followed by Annealing Process
I. Wayan Sutapa1 , Abdul Wahid Wahab2, Paulina Taba2 and Nursiah La Nafie2
1Department of Chemistry, Faculty Mathematic and Natural Science, University of Pattimura Jl. Ir. Putuhena Poka Ambon-Maluku- Indonesia.
2Department of Chemistry, Faculty Mathematic and Natural Science, University of Hasanuddin Jl. Perintis Kemerdekaan 90245, Makassar-Indonesia.
Corresponding Author E-mail: wayansutapa@fmipa.unpatti.ac.id
DOI : http://dx.doi.org/10.13005/ojc/340252
Download this article as:
![]()
MgO nanoparticle was synthesized by sol-gel method from magnesium acetate and oxalic acid dissolved in methanol followed by annealed process. Characterization of functional groups was performed using FTIR (Fourier Transforms Infrared spectroscopy), crystal profile analysis using XRD (X-ray Diffraction) and morphology using SEM (Scanning Electron Microscopy). The FTIR and XRD results indicated that the magnesium acetate converted into magnesium oxalate (Precursor), and then the anneal process was changed into MgO nanoparticles. The Scherrer’s equation used to determine the distribution of MgO nanoparticle crystals. Modified Williamson-Hall plot is used to determine the strain, stress and energy density value (micro structural properties) based on angle values 2θ and FWHM (Full width at half maximum) of XRD angles from 10° to 80°. The results of the XRD and SEM analysis show that magnesium complexes have changed. The solid layer formed by the Mg polymer complex network is transformed into a cubic structure.
KEYWORDS:Mgo Nanoparticles; Sol-Gel Method; Crystallite Sizes; Lattice Strain; Energy Density
Introduction
Metal oxides have become the attention of several researchers in last few years due to its potential in many field applications1–5. In recent year, researches have focused on synthesis of MgO nanoparticle due to have unique properties there are has a high ionic nature, the crystal structure and stoichiometry is simple, large specific surface area, highly reactive due to the large number of active sites, the size and shape of the particles can be varied as needed, and the surface has many crystal defects. Properties of these materials can be analyzed by computational or conventional method6–9.
MgO was used in many applications such as antibacterial against foodborne pathogen, catalyst and catalyst supports, ceramics, toxic waste remediation, paint, superconductor product and adsorbent1,3,10. Generally, various kinds of fabrication method are employed to synthesize MgO nanoparticles such as solution combustion method11, micro emulsion method12 deposition of chemical vapour method13, ablation using laser light method14, pulsed laser deposition (PLD) method15, microwave method16, hydrothermal method17, co-precipitation method18, solvothermal reduction19, thermal decomposition20, and sol gel method21,22.
Among these methods, the sol gel method is one of the most preferred method for synthesizing MgO nanoparticles due to several reason: simple process, high product yield, and low reaction temperature required23. In addition the sol gel is inexpensive method to get nano-size MgO with narrow size distribution and larger surface area is very important to solve the problem low reactivity and catalytic ability. The sol gel synthesis of MgO nanoparticle is generally followed by annealed process at the certain temperature. Increased defects of metal oxide crystals can occur in the annealing process because at high temperatures restructuring of the oxide will occurred. The formation of crystal defects on the solids surface will be able to produce active sites that serve as centers for donating their electrons, affecting the surface basicity of MgO produced and increasing the crystallite size24. Changes in the microstructures properties require further characterization and calculation to be understood in depth.
Previous studies, MgO nanoparticles was synthesized by sol gel method using magnesium acetate dissolved in ethanol, oxalate and tartrate acid as complexion agent. The formation MgO nanoparticle by this route can result the average crystallite size less than 100 nm for both complexion agent25. Based on our study no report the effect of methanol solution in synthesize of MgO nanoparticle. Likewise, the determination of microstructural properties of MgO nanoparticles until now has not been reported.
In this study we have synthesized MgO nanoparticle using methanol to dissolve of magnesium acetate and oxalate acid as complexion agent then annealed at 550°C for 6 hours. The study also investigated of average size of the crystal, particle size distribution, strain value calculation, stress value and amount of energy crystal density (microstructure properties) that resulted by nanoparticles products.
Materials and Methods
Materials
Mg(CH3COO)2.4H2O (Magnesium acetate tetrahydrate) (Merck, with purity 99.5%); C2O4.2H2O (oxalic acid dehydrate) (Merck, with purity >98 %); and CH3OH (methanol) (Merck, with purity 99.9%) is used to synthesize the Mg-oxalate precursor to be converted to MgO nanoparticles. All the chemicals used are of analytical grade only.
MgO Nanoparticle Synthesis Procedure
The synthesis procedure of MgO nanoparticles was carried out using the raw material of Mg(CH3COO)2.4H2O and C2O4.2H2O. Both of these materials were dissolved using methanol25. About 50 gram Mg(CH3COO)2.4H2O dissolved in 150 mL of methanol with stirring and heating constantly using magnetic stirrer. The stirring and heating process is stopped until a clear-colored mixture is obtained. The resulting mixture is adjusted to pH 5 by adding 1.0 m oxalic acid solution followed by stirring process until the white gel is obtained. The gel is kept in normal room condition and left for one night to make the gelation process is complete. The gel filtered using the filter paper Whatman-42 to separate the gel and its solution. The obtained solid heated at 200°C for 24 hours to remove water and acetate trapped in the formed solids. Furthermore, the dried product is slowly crushed by using mortar and pestle to produce fine powder then was sieved in ±100 mesh to produce a magnesium oxalate complex that serves as a precursor for producing MgO nanoparticles. The complex was formed then annealed at 550°C at the pressure 1 atm for 6 hours in the furnace. This process will produce nanoparticle crystals MgO.
Characterization Methods
FT-IR (Fourier Transform Infrared)
The functional group of precursor and nanoparticles MgO product was identified by FT-IR. FTIR spectra test is performed using Shimadzu FTIR-8400S spectrophotometer in range 250-4000 cm-1 using KBr pellet.
XRD (X-ray Diffraction)
To identify phases and patterns of the magnesium oxalate complex and MgO nanoparticles samples conducted using XRD (X-ray diffraction) the Shimadzu X-ray Diffractometer 9700 (40 kV, 30 mA) with radiation source is Cu Kα (λ=1.542 Å) and using the filter is nickel with a measurement range of 2θ angle is 10o-80o.
Morphology Analysis
The morphology of nanoparticle samples analyzed from images generated by SEM (scanning electron microscopy) with instrument type is JEOL JSM-7600F.
Results and Discussion
FTIR Analysis
FT-IR (Fourier Transform Infrared) spectroscopy was applied to identify of the function group and feature of Mg-oxalate and MgO nanoparticles. The sample is scanned at the range of wave numbers at 350 cm-1 to 4000 cm-1. The FTIR results after dried and annealed samples are presented in Figure 1. Figure 1A is shown the peaks at 3408.22 cm-1 with strong intensity generated by the O-H group (hydrogen bond) of the existance of hydroxyl groups on the solid surface is due to the presence of an acetate group as a by-product of this reaction. The medium peak at 1670.35, 1643.35 cm-1 derived from asymmetric vibrations (vas) of C-O in Mg-oxalate complex. The strong peak at 1371.39 cm-1 and the very strong peak at 1325.10 cm-1 are assigned to symmetry vibration (vs) C-O and δ(O-C-O). The sharp peak at 831.32 cm-1 is derived from vibration (v) of C-C and δ(O-C-O). The medium peak at 420.48 cm-1 is corresponding to vibration Mg-O.
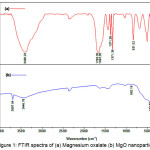 |
Figure 1: FTIR spectra of (a) Magnesium oxalate (b) MgO nanoparticles Click here to View figure |
Figure 1a is shown the medium peak at 3697.54 cm-1, 3446.79 cm-1 are the result of stretching O-H bound to the surface of solids derived from adjacent water molecules. The strong absorption at 443.63 cm-1 and the mediumpeak at 862.18 cm-1 are the wave number that characterizes stretching vibrations derived from Mg-O bonds26,27. Decreased of 3408,22 cm-1 strong peak (Figure 1a) in (Figure 1b), then peak at 443,63 cm-1 (Figure 1b) is stronger than 420,48 cm-1 (Figure 1a) due to antisymetric stretching in Mg(OH)2 crystal structure. In addition, this fact also serves as indication that the annealing process at 550oC with pressure 1 atm has resulted transformation of structure compound from hexagonal (Mg (OH)2 form) to cubic (MgO form).
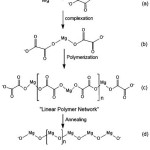 |
Figure 2: Growth mechanism for (a-c) Mg-oxalate and (d) MgO nanoparticles25 Click here to View figure |
XRD Analysis
Powder XRD method was applied to identify the phase and crystallite size of the MgO nanoparticle. The XRD patterns of Mg-Oxalate complex and MgO nanoparticle annealed at 500 oC for 6 hours are shown in Figure 3 and Figure 4. Figure 3 shows that the Mg-oxalate complex was formed in this process and these result by XRD. The X-ray result is good agreement to previous result28. The presence other peak diffraction the XRD patterns rise from acetate acid and water remained in the complex.
Figure 4 shows the XRD diffraction pattern of MgO nanoparticles resulted. There is a strong and sharp diffraction peak at 2θ angle of 38.30o, 42.78o, 55.51o, 62.13o, 74.47o, 78.40o corresponding to (1 1 1), (2 0 0), (2 2 0), (2 2 0), (3 1 1), and (2 2 2) plane respectively are indicated of MgO nanoparticle, while diffraction peak located at the 2θ value of 16.96o, 37.00o, 58.68o are indicated Mg(OH)2 compound29. The resulting MgO diffraction pattern then matched with The International Centre for Diffraction Data [ICDD No: 01-078-0430].
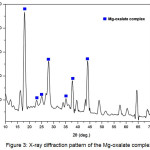 |
Figure 3: X-ray diffraction pattern of the Mg-oxalate complex Click here to View figure |
Subsequently, an average crystal size calculation was performed for each peak resulted on the XRD diffraction. The particle size of nanoparticles determined using Debye – Scherer equation30.
![]()
θ is angle value of each peak, β is the FWHM value, D is the average size of crystal particle, K is Debye-Scherer constant of 0.94, λ is wavelength value of CuKα radiation of 0.144 nm. The average size of crystal particle calculated for synthesis MgO nanoparticles was 7.51 nm. Based on Debye – Scherer equation also can be used determined the dislocation density (δ) of crystal.
The dislocation density (δ) is obtained by determining the length of the dislocation line divided by the crystal volume of the nanoparticles. The value (δ) denotes the number of crystal defects possessed by a solid material. To calculate the dislocation density (δ) can be done using equations31.
![]()
The result of the dislocation density (δ) of the synthesized MgO nanoparticles is 0.0097 (nm)-2. These results indicate MgO crystal have small dislocation density value. Based on dislocation density value of the MgO nanoparticles obtained in this study, confirmed that the MgO nanoparticle product has a good degree of crystallinity.
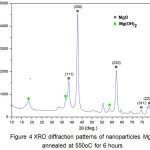 |
Figure 4: XRD diffraction patterns of nanoparticles MgO annealed at 550oC for 6 hours Click here to View figure |
Crystallite Size Distribution
The determination of the size distribution of a crystal is a model resulted from the crystal size effect by assuming the spherical domain sizes is long-normal distribution. Based on observation many researcher the distribution functions has been proven to be effective is defined as32.
![]()
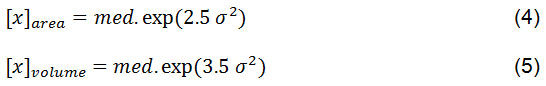
X is the value obtained from the distribution of crystal size, σ is the value of variance and med. is the median value obtained from the size distribution function. The volume-area-, is derived from the average value of the crystal size with assuming the crystal form is spherical. These two values are determined using the equation33:
The crystallite size distribution function of MgO nanoparticles on annealed temperature 550oC are plotted in Figure 5.
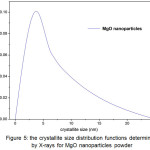 |
Figure 5: The crystallite size distribution functions determined by X-rays for MgO nanoparticles powder |
Based on Figure 5 can be seen that the MgO nanoparticles have distribution particles size lower than 10 nm. Based on calculation result obtained median value and value of variance 1.23 and 6.85 respectively. This means that the size of crystallite is on a nanometer scale range. While, the size value the area- and the volume- are 293.33 and 1.32 x 10³ nm, respectively. These value are relatively far each other, its fact also supported by size distribution is wide: σ = 1.23. The volume weight average size is about 1.32 x 10³ nm, its show that nanocrytalline grain-boundary region or the amorphous part of the specimen contribute mainly to the diffuse background33.
Strain, stress and Energy Density of crystal
Determination of Strain (ε)
Calculation of the strain, stress and density of crystal can be solved using W-H (Williamson–Hall) approach. The W-H approach used in this case involves a widened diffraction of peak value, which results from variations in crystal size and strain values. In addition, a widened peak value due to coherent scattering and internal stress values occurs during the sample preparation process. The calculation of the diffraction pattern generated by the widened peak is carried out using the equation 7,29 βhkl corresponding to each diffraction peak of MgO.
![]()
The amount of contribution derived from the size and strain value of material crystal shows the total value of broadening peak. This relationship can be written by the equation:
![]()
βD is a value derived from the size of the crystal, βc is generated by broadening peak due to the occurrence of the induced strain and βhkl is the FWHM value that has been corrected by broadening peak.
![]()
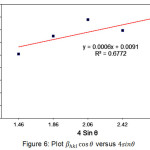 |
Figure 6: Plot βhkl cosθ versus 4sinθ |
Equation 9 is a form of UDM (uniform deformation model) which uses the assumption that crystals undergo the same strain in all directions of the crystal plane. In addition, this equation also assumes that the character possessed by the crystal is not affected in the direction specified and the crystal is isotropic29. The value of micro strain (ε) calculated using the values obtained from the slope of the graph in the linear regression (Figure 6) is 1.5 x 10⁻⁴. The calculation result of micro strain is very low and the straight lines with R2=0.6772 of the annealed MgO at temperatures of 500oC were almost horizontal, this suggesting that the nanoparticles product is a lack of strain34.
Determination Stress of crystal (σ)
Estimation of the stress of crystal is calculated using anisotropic approach, these make Williamson–Hall equation is modified into USDM (uniform stress deformation model). In USDM, using the assumption that the deformations that occur due to stress on all directions of the crystal plane is similar, the micro strain values that occur on particles is very small, and the proportional linearity between stress and strain values is used in Hook’s Law (σ =εY), σ derived from the stress crystal value, Y is Young modulus value (or) the elasticity of the crystal. Using the Hooke’s law and changing the value of strain (ε) in the equation 9, the new equation can be obtained:
![]()
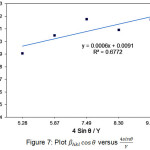 |
Figure 7: Plot βhkl cosθ versus 4sinθ/Y |
Application the equation can be conducted for materials that have small strain values. Based on the experiment data, Young (Y) Modulus for MgO nanoparticles that has a cubic structure is 248.73 GPa. These data it can be generated graph relation βhkl cosθ versus 4sinθ/Y as in Figure 7. The magnitude of stress owned by nanoparticles MgO calculated from the slope of the graph is 37.31 MPa.
Determination of crystal Energy Density (ued)
The crystal Energy Density of a crystal can be determined by UDEDM (uniform deformation energy density model). Equation (9), assumes that the nature of the homogeneity of the crystals and its isotropic properties. In addition, in this model also considered the energy density value of strain that make the proportionality constant of the relationship between strain-stress is dependent. In an elastic material such that Hooke’s law can be applied, the energy density of the material ued (energy per unit) can be determined by involving the functional value of the strain is ued =(ε2 Y) / 2. Thus, the Equation 11 is resulted from modification of energy relations and strains can be obtained.

 |
Figure 8: Plot βhkl cosθ versus 4sin (2/Y)1/2 |
Plots of βhkl cosθ versus
![]()
is the result of calculation from available data and then the linear regression conducted to obtain a straight line (Figure 8). Based on the slope value of the graph it can estimate the energy density of the MgO nanoparticles is 0.712 MPa.
Morphological Analysis
The SEM image of magnesium oxalate complex and MgO nanoparticle is shown in Figure 9. SEM analysis was remarkable method for showing the surface morphologies of solid materials. Figure 9a shows that the magnesium oxalate compound complexes produced by sol gel synthesis are solid layers formed by a linear polymer complex network. The process of formation of this linear network complex can be understood by the reaction mechanism of Figure 2 (a-c).
Figure 9.b shows the magnesium structure change from magnesium oxalate complex to Mg-O polymer (Figure 2d). These results show that changes in annealing temperature will affect the morphology and size of the material. After annealing at 550oC the magnesium morphology changes from the form of the solid layers to the cubic crystal structure. MgO nanoparticles produced through this route by using methanol solvent have a morphological and structural similarity to the process using ethanol solvent25.
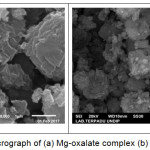 |
Figure 9: SEM of micrograph of (a) Mg-oxalate complex (b) MgO nanoparticles |
Estimation of Texture Coefficient TC(hkl))
Determination of the texture coefficient is one of methods used to calculate contribution percentage of each peak in XRD diffraction which as a quantitative reference to determine the orientation of each detected crystal. Texture coefficient values also can be used to determine the tendency of the crystal planes in the sample. The coefficient of texture can be calculated using the equation 12:

I(hkl), Io(hkl) and N are the relative intensity of the sample, the relative intensity of the standard and the XRD diffraction peak number respectively35,36. The texture coefficient of MgO nanoparticles annealed at 550oC for 6 hour was calculated. Based on the obtained calculation results can be seen that the coefficient value of the highest MgO nanoparticle texture is 1.13. The highest TC(hkl) value is obtained in the crystal plane (111). The result is indicates that most of the MgO nanoparticles on the sample will be preferred orientation of (111) plane.
Conclusions
MgO nanoparticle was synthesized by sol-gel method from magnesium acetate and oxalic acid dissolved in methanol followed by annealed process. Characterization product conducted by FTIR, XRD, and SEM. The synthesis process of sol-gel method has obtained the precursor of Magnesium oxalate. The annealed process at 550oC for 6 h was annealed magnesium oxalate complex into the MgO nanoparticles. The XRD diffraction peak of MgO nanoparticles analyzed using the Scherrer’s equation, the crystallite size distribution, UDM, UDSM, and UDEDM and TChkl. FTIR result shows that most of the functional group of the magnesium acetate was changed into MgO nanoparticles. The crystallite size distribution the MgO nanoparticles have distribution particles size lower than 10 nm. The size value the area- and the volume- are 293.33 and 1.32 x 10³ nm. The value of strain (ε) value of stress (σ) and the energy density of MgO nanoparticle crystal (ued) were calculated from the W–H approach are 1.5 x 10⁻⁴, 37.31 MPa, 0.712 MPa respectively. The SEM images showed morphology of Mg oxalate complex and MgO nanoparticles. These images were justifying that most the magnesium oxalate in solid layers formed by a linear polymer complex network change into cubic structure (MgO nanoparticles) with an average particle size of 7.51 nm. TChkl calculation result is indicates that the MgO nanoparticles on the sample is preferred orientation of (111).
Acknowledgments
Authors are thankful to Ministry of Research, Technology and Higher Education of the Republic of Indonesia, for the Doctoral Grand Program on year 2017 and Scholarship for Postgraduate Education in the Country for financial assistance to carry out the research.
References
- Duan, G.; Yang, X.; Chen, J.; Huang, G.; Lu, L.; Wang, X. Powder Technol., 2007, 172, 27–29.
CrossRef - Sutapa, I. W.; Bandjar, A.; Rosmawaty; Sitaniapessy, M. Int. J. Mater. Sci. Appl., 2015, 4, 219.
- Jin, T.; He, Y. J. Nanoparticle Res., 2011, 13, 6877–6885.
CrossRef - Indulal, C. R.; Biju, R.; Nand, D.; Raveendran, R. Orient. J. Chem., 2017, 33, 1545–1549.
CrossRef - O. Siyanbola, T.; F.Akinsola, A.; A.Adekoya, J.; O.Ajani, O.; O.Ehi-Eromosele, C.; Olasehinde, G. I. Orient. J. Chem., 2017, 33, 09-16.
- Dercz, G.; Prusik, P.; Pająk, L.; Pielaszek, R.; Malinowski, J. J.; Pudło, W. Materials Science-Poland, 2009, 27, 201–207.
- Hadanu, R.; Idris, S.; Sutapa, I. W. Indones. J. Chem., 2015, 15, 86–92.
CrossRef - Klabunde, K. J.; Stark, J.; Koper, O.; Mohs, C.; Park, D. G.; Decker, S.; Jiang, Y.; Lagadic, I.; Zhang, D. J. Phys. Chem., 1996, 100, 12142–12153.
CrossRef - Sutapa, I. W.; Armunanto, R.; Wijaya, K. Indones. J. Chem., 2010, 10, 184–188.
- Niu, H.; Yang, Q.; Tang, K.; Xie, Y. Scr. Mater., 2006, 54, 1791–1796.
CrossRef - Orante-Barrón, V. R.; Oliveira, L. C.; Kelly, J. B.; Milliken, E. D.; Denis, G.; Jacobsohn, L. G.; Puckette, J.; Yukihara, E. G. J. Lumin., 2011, 131, 1058–1065.
CrossRef - Svensson, E. E.; Nassos, S.; Boutonnet, M.; Järås, S. G. Catal. Today, 2006, 117, 484–490.
CrossRef - Ryu, H.; Singh, B. K.; Bartwal, K. S. Synthesis and Optimization of MWCNTs on Co-Ni/MgO by Thermal CVD. Adv. Condens. Matter Phys., 2008, 2008, 1-6.
- Vendamani, V. S.; Tripathi, A.; Pathak, A. P.; Rao, S. V.; Tiwari, A. Mater. Lett., 2017, 192, 29–32.
CrossRef - Nagashima, K.; Yanagida, T.; Tanaka, H.; Kawai, T. J. Appl. Phys., 2007, 101, 124304.
CrossRef - Makhluf, S.; Dror, R.; Nitzan, Y.; Abramovich, Y.; Jelinek, R.; Gedanken, A. Adv. Funct. Mater., 2005, 15, 1708–1715.
CrossRef - Ding, Y.; Zhang, G.; Wu, H.; Hai, B.; Wang, L.; Qian, Y. Chem. Mater., 2001, 13, 435–440.
CrossRef - Das, S.; Srivasatava, V. C. Smart Sci., 2016, 4, 190–195.
CrossRef - Ling, Z.; Zheng, M.; Du, Q.; Wang, Y.; Song, J.; Dai, W.; Zhang, L.; Ji, G.; Cao, J. Solid State Sci., 2011, 13, 2073–2079.
CrossRef - Morozov, S. A.; Malkov, A. A.; Malygin, A. A. Russ. J. Gen. Chem., 2003, 73, 37–42.
CrossRef - Athar, T. Mater. Focus, 2013, 2, 493–496.
CrossRef - Minami, H.; Kinoshita, K.; Tsuji, T.; Yanagimoto, H. J. Phys. Chem. C., 2012, 116, 14568–14574.
CrossRef - Mastuli, M. S.; Ansari, N. S.; Nawawi, M. A.; Mahat, A. M. APCBEE Procedia, 2012, 3, 93–98.
CrossRef - Mguni, L. L.; Mukenga, M.; Jalama, K.; Meijboom, R. Catal. Commun., 2013, 34, 52–57.
CrossRef - Mastuli, M. S.; Kamarulzaman, N.; Nawawi, M. A.; Mahat, A. M.; Rusdi, R.; Kamarudin, N. Nanoscale Res. Lett., 2014, 9, 134.
CrossRef - Rezaei, M.; Khajenoori, M.; Nematollahi, B. Powder Technol., 2011, 205, 112–116.
CrossRef - Song, G.; Ma, S.; Tang, G.; Wang, X. Colloids Surf. Physicochem. Eng. Asp., 2010, 364, 99–104.
CrossRef - Lakshmi Reddy, S.; Ravindra Reddy, T.; Siva Reddy, G.; Endo, T.; Frost, R. L. Spectrochim. Acta. A. Mol. Biomol. Spectrosc., 2014, 123, 25–29.
CrossRef - Bindu, P.; Thomas, S. J. Theor. Appl. Phys., 2014, 8, 123–134.
CrossRef - Patterson, A. L. Phys. Rev., 1939, 56, 978–982.
CrossRef - Khan, Z. R.; Zulfequar, M.; Khan, M. S. Mater. Sci. Eng. B., 2010, 174, 145–149.
CrossRef - Ungár, T.; Gubicza, J.; Ribárik, G.; Borbély, A. J. Appl. Crystallogr., 2001, 34, 298–310.
CrossRef - Gubicza, J.; Ribárik, G.; Bakonyi, I.; Ungár, T. J. Nanosci. Nanotechnol., 2001, 1, 343–348.
CrossRef - Zhang, X.; Zheng, Y.; Feng, X.; Han, X.; Bai, Z.; Zhang, Z. RSC Adv., 2015, 5, 86102–86112.
CrossRef - Manifacier, J. C.; Gasiot, J.; Fillard, J. P. J. Phys. [E], 1976, 9, 1002.
- Wang, J.; Yang, F.; Wei, X.; Zhang, Y.; Wei, L.; Zhang, J.; Tang, Q.; Guo, B.; Xu, L. Phys. Chem. Chem. Phys., 2014, 16, 16711–16718.
CrossRef
Accepted on: January 20, 2018


![]()


