The Compatibility of Polylactides and Polybutylene Succinate in PLA Blends Based on Thermal, Mechanical, and Rheological Properties
1School of Mechanical and Process System Engineering, Institute of Engineering, Suranaree University of Technology, 111 University Avenue, Muang District, Nakhon Ratchasima, 30000, Thailand.
2School of Agricultural Engineering, Institute of Engineering, Suranaree University of Technology, 111 University Avenue, Muang District, Nakhon Ratchasima, 30000, Thailand.
Corresponding Author E-mail: Lsrytw@sut.ac.th
DOI : http://dx.doi.org/10.13005/ojc/330609
Download this article as:
![]()
Compounding of polylactides (PLA) and polybutylene succinate (PBS) was performed with the aim of modifying the processablility of PLA based materials. The influence of PBS on the thermal, mechanical, and rheological properties of PLA/PBS blends was analyzed and the results of the testing were used to indicate the compatibility of the blend. A decrease of the melting temperature and an improvement of the mechanical properties of PLA were achieved by compounding it with PBS. Increasing addition of PBS was found to decrease the tensile strength and Young’s modulus of the PLA/PBS blends, but its % elongation at break was increased. However, a higher level of PBS addition initiated a phase separation problem. The interaction parameters were calculated from the Flory-Huggins equation for prediction of thermal property of the blends and the maximum blending ratio of 80:20 (PLA:PBS) was thermodynamically acceptable immiscible level. Relatively low levels of PBS addition improved the melt flow characteristics of the blend. The effect of the PBS addition level on the compatibility of the blend can definitely identify from the modified Cole-Cole plot of rheological properties.
KEYWORDS:Polylactides (PLA); Polybutylene succinate (PBS); Phase separation; Rheological; Biodegradable
Introduction
Nowadays, biodegradable polymers have been widely attended because of environmental friendly. Since, biodegradable polymers can fully degrade in nature, the amount of packaging waste and waste treatment are significantly reduced.
Polylactides (PLA) are one of the most available bio-based and eco-friendly polymers. It is also more cost competitive biopolymers. PLA has been considered as a major alternative to petroleum-based plastics for many applications including packaging, electrical and mechanical parts, and medical device etc1-3. Physically, PLA is considered as good mechanical strength and biocompatibility thermoplastic, but poor thermal processability. In recent years, the plastic applications from PLA have been interested in researching. The biodegradable material can be used to replace the plastic from petroleum base such as polyethylene terephthalate (PET), polyethylene (PE)4.
Another promising commercial biodegradable plastic is polybutylene succinate (PBS), an aliphatic thermoplastic polyester, which is chemically synthesized by polycondensation of 1,4-butanediol with succinic acid5. PBS has many interesting properties, including good thermal processability, flexibility, and chemical resistance6-8.
Normally, the very high modulus and fragility of PLA made it difficult for packaging fabrication. Modification of its physical properties can be done via polymer compounding techniques, for examples, use of polyethylene glycol to lower its glass transition temperature, or blending with more flowable resins, such as thermoplastic starch, petroleum-based thermoplastics, and bio-based thermoplastics etc9. Among polymer blends, PBS has received much attention since it very compatible with PLA6. Bhatia6 found that blending of up to 20 wt% PBS (G4460-grade) in PLA (4032D-grade) showed good compatibility and overcame the deficiencies of polylactides, including brittleness, flexural properties, heat distortion temperature and impact strength. Thus it was found to be good for applications in food packaging, compost bags, and disposable packaging6.
Compounding of PLA was mainly used for making packaging trays and bags, but not much for packaging foam. Even though PLA was shown to be foamable, both in the form of microcellular or bead foam, there needed to be investigation of its alteration of the unsuitable physical properties of PLA foam such, as rigidity, brittleness, and poor thermal processability. Besides the modification of PLA properties, compatibility of the compound was a very important issue. The compatibility of a polymer compound depends on the characteristics of the polymer and additives, compounding conditions, and processing conditions. For examples, Park computed that PLA was thermodynamically immiscible with the synthesized PBS based on the Flory-Huggins theory10. Shumsky11 determined a maximum blending ratio for poly(methyl methacrylate) and poly(styrene-co-acrylonitrile) from the viscoelastic properties of the polymer melt. Yokohara12 reported that blending of PLA/PBS exhibited immiscible phase in the molten state at all blending ratios.
Therefore, the objectives of this work were to modify the physical properties of PLA by compounding with PBS and to determine the compatibility of the compounds. Since compounding of PLA was targeted for a packaging foam material, the primary physical properties of the blends that should be improved are the flexibility and thermal processability of the pre-foam compounds. Effects of PBS content in the blend on both physical properties and compatibility were thoroughly investigated.
Materials and Methods
Materials
PLA(2002D) was purchased from NatureWorks (Ca,USA) in pellet form and it is an extrusion/ thermoforming grade. PBS used in this study was a GS-Pla (AZ91TN: MI 4.5 g/10min) from Mitsubishi Chemical (Thailand) Co., Ltd. produced by DIA Chemical Co., Ltd. All resins were dried under vacuum at 60ºC to reduce their moisture content before use.
Compounding Methods
Sample compounds of PLA/PBS were prepared for four blending ratios of 100/0, 80/20, 65/35, and 50/50 by weight. Dried PLA and PBS were mixed by internal mixer (Haakke Rheomix) at a constant temperature of 180ºC and 60 rpm for 10 min. After mixing, they were compression-molded into a rectangular slab (2 mm in thickness) using a hydraulic press at 100 bar and 170ºC for 5 min
Mechanical Property Measurement
The tensile testing was carried out at a rate of 10 mm/min according to the American Society for Testing and Material (ASTM) D638 on a compression molded standard type V dumbbell shape sample with a thickness of 3.3±0.4 mm. Testing was performed using an Instron (model 5565) at 25ºC (room temperature). For each blended compound, a minimum of 5 samples were tested.
Thermal Property Measurement
Thermal properties were determined using differential scanning calorimetry (DSC) (PerkinElmer PYRIS, Diamond). About 10 mg of each sample was placed in the stainless steel DSC pans. The sample was firstly heated to 200°C at a heating rate of 20 °C/min to erase previous thermal history, then quenched to 20°C, and secondly heated to 200°C at the same rate. Thermal profiles of all samples were analyzed for glass transition temperature, crystalline melting temperature, and heat of mixing. Compatibility of PLA/PBS blends was also interpreted from the thermal data by the interaction parameters following the Flory-Huggin theory. The thermal data were analysed by using methodology as described by Park10.
Rheological Property Measurement
Rheological properties of each blend and neat polymers were measured using an AR-G2 Rheometer (TA Instrument Ltd., Surrey, England) with 25 mm parallel plate geometry. For temperature sweep mode, all tests were performed at 1% strain, 0.1 Hz for a temperature range of -30 to 200°C. The frequency sweep mode tests used a frequency range of 0.01-100 rad/s at temperatures between 160 and 190°C. Steady shear mode tests were used to characterize the flow. The testing covered the shear rate of 0-1000 s-1 at four temperatures (160°C, 170°C, 180°C, 190°C). Rheological parameters were obtained using the manufacturer supplied computer software (Rheology Advantage Data Analysis Program, TA Instrument).
The maximum blending ratio of the PLA/PBS without noticeable phase separation can be identified from the rheological properties obtaining by the dynamic frequency sweep testing. Comparison of the rheological properties for every sample was carried out at a similar flowing state that was identified from the angular frequency range showing a relatively constant delta value. Since the delta value represents the phase shift between dynamic viscosity and loss viscosity (or storage modulus and loss modulus), a deviation of the delta for any testing sample indicated a different flowing state or molten state in its microstructure. To determine the effect of blending ratio on the phase separation, the temperature invariant superposition principle was applied to evaluate the dynamic frequency sweep testing data. In the complex plane, a single circular arc of the Cole-Cole plot generally indicates a homogeneous blend or no phase separation13,14. This representation can be written as in equation 1,
Where is the complex viscosity, is zero shear viscosity, is the mean characteristic time, is frequency, j is complex number, and is a parameter that characterizes the width of the relaxation time distribution.
Results and Discussion
Mechanical Properties
The observed tensile strength, tensile modulus and % elongation at break are shown in Figure 1. The results show that the mechanical properties of PLA and PBS were distinct materials properties. Tensile strength and Young’s modulus of PLA were much higher than PBS but % elongation at break was lower than PBS resulting from a different crystalline region in the solid state of PLA and PBS. Such properties indicate that PLA is a hard and brittle material and PBS is a softer and more flexible material. These distinct mechanical characteristics were carried into the PLA/PBS blends as shown in Figure 1. The addition of PBS until 35 wt% showed sharply decreased of tensile strength while the Young’s modulus was gradually decreased. However, the PBS level higher than 35 wt% addition showed limited change in the mechanical properties of the blend. However, the superiority of % elongation at break for PBS had little effect on changing percent elongation at break for all of the PLA/PBS blends confirming brittleness characteristic of PLA or indifferent crystallinity between neat PLA and PLA/PBS blends. The tendency of the decreasing modulus and tensile strength of the PLA/PBS blends agrees very well with the findings of McCarthy15. They reported a decrease in Young’s modulus and tensile strength with increasing PBS content in the blends as an example of outstanding strain hardening blends. Park10 found that tensile strength and Young’s modulus of PLA/PBS blends at 20 wt% of PBS were at about 49 and 800 MPa, respectively. Similar values were found in PLA/PBS blends by this study, although PBS was obtained from different sources. Lee16 characterized the effect of poly (butylene succinate adipate) (PBSA) in PLA (6200D)/PBSA blends. They reported that PBSA reduced the strain at break if the addition level was below 20 wt%, but above this level additional PBSA had little effect on the strain at break. However the characteristics of the PLA(6200D)/PBSA blends were similar to what we found for PLA/PBS blend. Shibata17 also found that the level of poly(butylenes succinate-co-L-lactide) (PBSL) in poly(L-lactide) (PLLA) had a limited effect on the % elongation at break. From the above results it can be concluded that up to 20 wt% of PBS in PLA compatibility is possible and beyond that they decreased the strength of PLA and promoted flowability of the blends.
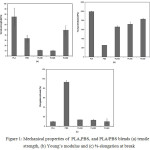 |
Figure 1: Mechanical properties of PLA, PBS, and PLA/PBS blends (a) tensile strength, (b) Young’s modulus and (c) % elongation at break |
Thermal Properties
Thermal properties of all the samples were measured by DSC. Thermal profiles of PLA, PBS, and PLA/PBS blends are shown in Figure 2. Two distinct melting peaks of PLA(2002D)/PBS blends were observed for all the blending ratios at around 108ºC for PBS and 153ºC for PLA indicating a two phase system. For neat PLA and PBS, the melting enthalpies were estimated at 15.5631 J/g and 58.0121 J/g, respectively (in Table 1) while heats of fusion or melting enthalpies (∆H) for the crystalline zones of each composition in the blends were reduced comparing to the neat PLA and PBS. At the highest level of PBS addition in PLA/PBS blends, the crystalline melting enthalpies of the PLA regions decreased to around 13.132 J/g and 7.6316 J/g for 35%, and 50%, respectively.
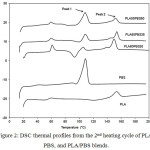 |
Figure 2: DSC thermal profiles from the 2nd heating cycle of PLA, PBS, and PLA/PBS blends. Click here to View figure |
Table 1: Melting enthalpy (∆H) of PLA, PBS and PLA/PBS blends.
|
Sample |
Tg (°C) |
Tm1 (°C) |
Tm2 (°C) |
∆Hm (J/g) |
|
|
Peak 1 |
Peak 2 |
||||
|
PLA |
56.93 |
– |
153.97 |
– |
15.56 |
|
PBS |
– |
– |
108.97 |
58.01 |
– |
|
PLA50PBS50 |
56.66 |
140.01 |
151.78 |
26.16 |
7.63 |
|
PLA65PBS35 |
58.52 |
143.54 |
153.80 |
14.67 |
13.13 |
|
PLA80PBS20 |
56.50 |
144.38 |
153.46 |
7.00 |
18.97 |
Similar behavior was found in the blend of PLA (4032D)/(thermoplastic starch, TPS) blends and poly(lactide)/poly(butylenes adipate-co-terephthalate) blends by Li18 and Pilla19. Li18 reported that PLA(4032D)/TPS blend showed strong crystallization exotherms between 90 and 140ºC followed by complete melting of the formed crystallites between 145 and 175ºC. Pilla19 reported the all of polymer blends exhibited two distinct melting peaks, at around 127ºC and 168ºC. Similarly, Park20 reported that PLA/PBS blends showed the two distinct melting peaks of heating DSC thermograms at heating rate 10°C/min. The DSC thermogram of pure PLA showed a broad crystallization peak between 110 and 150°C and a melting peak at about 176°C. For pure PBS, a sharp exothermal peak and melting peak were observed at 92 and 114°C, respectively. Not only PBS had an effect on the melting enthalpy, but also on shifting melting temperature of both crystalline zones toward a lower side temperature.
Thermal analysis is performed for the better understanding of the cold-crystallization. The DSC curves demonstrate that the glass transition temperature (Tg) of PLA is around 56°C. Further, PLA has a crystallization peak at 120°C and shows single peak around at 153°C due to melting in the DSC heating curve. The melting peak located at the lower temperature is attributed to less organized crystals that would be formed during the DSC measurement. It should be noted that the melting peak at the higher temperature of the blends is pronounced, suggesting that the blends have well-organized crystals compared with the pure PLA. Furthermore, the endothermic peak ascribed to the cold-crystallization, is located at lower temperature than that of the pure PLA. The endothermic peak around at 108°C is attributed to the melting peak of PBS. The location of PBS melting peak for the blends is the same as that for the pure PBS.
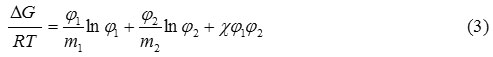
The most important information obtaining from thermal characteristics was the melting enthalpies benefit for determination of phase behavior. Based on the Flory-Huggins theory, the DSC thermograph can be used for estimating the interaction parameter between the two polymers21 which describes the phase behavior. According to the Flory-Huggins theory, the melting point depression of blends can be calculated by equation 2,
where ∆H is the enthalpy of fusion per mole of repeat unit of PLA, Vis the molar volume of the repeat unit, Tm is the melting temperature, R is the gas constant, m is the degree of polymerization, φ is the volume fraction, χ is the interaction parameter, and the subscripts 1,2 are for PLA and PBS, respectively. The interaction parameter is equivalent to the slope of a plot of the left hand side of the equation (2) versus , as shown in Figure 3. Assuming the values of m and Vfor PLA and PBS equal to what was reported by Park et al. (2010) were at 1616, 273, 50.5, and 132.6, respectively. The ∆H of PLA was reported by Hoffman22 as 2.38 J/mol.
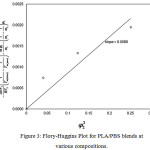 |
Figure 3: Flory-Huggins Plot for PLA/PBS blends at various compositions.
|
The interaction parameter between PLA and PBS was at 0.0086 which corresponded to thermodynamically immiscible phase. Even so, the interaction parameter approached zero or little beyond the negative values of critical parameter of -1.3, we can draw a conclusion that relatively low PBS addition in the PLA/PBS blends may be considered at thermodynamically acceptable immiscible blend. In order to confirm the phase behavior of the blends, we calculated the variation in the Gibbs’ free energy of mixing (∆G) as a function of the PBS volume fraction or plot of the polymer blend phase diagram. Using the interaction parameter from Flory-Huggins theory, the Gibbs’ free energy was determined by equation 3,
where was interaction parameter obtaining from eq.2, R was gas constant, and T was temperature. An estimated phase diagrams of PLA/PBS blends was displayed in Figure 4. The positive Gibbs’ free energy confirmed that the blending appeared in thermodynamically immiscible blends. However, visualization of the PLA/PBS samples showed sign of phase separation when the content of PBS was over 20 wt%. It should be noted here that the accuracy of Gibb’s free energy was up to the interaction parameter which was very dependent on the measured values of molecular weight and degree of polymerization.
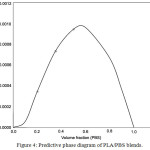 |
Figure 4: Predictive phase diagram of PLA/PBS blends.
|
Thermal characteristics of the PLA/PBS blends demonstrated that addition of PBS at levels up to 20 wt% improved flowability without any phase separation. The acceptable level of immiscible phase for the maximum blending ratio was defined by a near negative interaction parameter and Gibb’s free energy of mixing.
Rheological properties
The rheological properties of the molten state of PLA/PBS blend, namely complex modulus, tanδ, complex viscosity, and the modified Cole-Cole plot, were measured in the linear viscoelastic region. Linear viscoelastic region provides that the configuration of the macromolecules remains unperturbedly by the flow history, so effect of PBS addition level on the rheological properties of the blend can be evaluated. Performing temperature scans at relatively low strain and optimum frequency showed that addition of PBS in the blends helped reducing the complex modulus (׀G*׀) of the neat PLA when the melting temperature was beyond 100ºC or above melting temperature of PBS as shown in Figure 5. On the other hand, adding PBS in the blend improved flowability at a lower process temperature. Since lowering the values of tanδ or the ratio of G”/G’ for all blending ratios at measuring temperature above 140°C suggested that less energy was required to flow the PLA/PBS blend (Figure 6). However PBS additional content from 20-50% had an indifferent effect on lowering the complex modulus of the blend (Figure 5). Effect of PBS additional level on improving the flowability of PLA may not be able to differentiate from the complex modulus and tanδ of the temperature sweep measurement, but the complex viscosities showed that additional level up to 35% made the flow behavior of the blend liked the PBS (Figure 7).
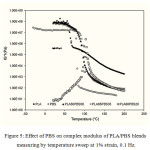 |
Figure 5: Effect of PBS on complex modulus of PLA/PBS blends measuring by temperature sweep at 1% strain, 0.1 Hz. |
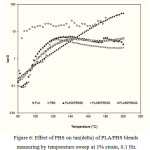 |
Figure 6: Effect of PBS on tan(delta) of PLA/PBS blends measuring by temperature sweep at 1% strain, 0.1 Hz. |
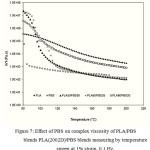 |
Figure 7: Effect of PBS on complex viscosity of PLA/PBS blends PLA(2002D)/PBS blends measuring by temperature sweep at 1% strain, 0.1 Hz.
|
Even though complex viscosities of all blending ratios were between the complex viscosities for neat PLA and PBS, the results did not suggest that the compound appeared as a single phase. To evaluate the phase separation of the blend compounds, the principle of temperature invariant characteristics of viscoelastic properties was employed. The transition from the homogeneous state to the heterogeneous state could be indicated by a violation of temperature superimposed characteristics of the viscoelastic properties23. The dynamic frequency sweep testing was conducted at 160, 170, 180, and 190°C under 1% strain amplitude which was in the linear viscoelastic regions. Since a wide range of blending ratios of PLA and PBS (from 20% to 50%) was studied here, a great difference in the viscoelastic properties was expected among the blends. The effect of any given testing temperature on the molten state of each ratio is different and perhaps easily causes a wrong comparison of rheological parameters in which a similar flowing state is a constrained like the case of the temperature invariant principle. In order to determine phase separation from viscoelastic characteristics of each of the PLA/PBS blending ratio, the modified Cole-Cole plot was proposed here to determine for the maximum blending ratio by taking the normalization concept as reported by Vinogradov24and Shumsky11. Here, the modified Cole-Cole plot was a plot of
![]()
and
![]()
for each blending ratio and various temperatures instead of a plot between
![]()
and
![]()
as original use in order to obtain a similar flowing state. The reference viscosity,
![]()
for each blending ratio was a complex viscosity at the least minimum value of the loss viscosity,
![]()
in the Cole-Cole plot
![]()
which represented the transition between different flowing state at a given constant temperature as an example shown in Figure 8.
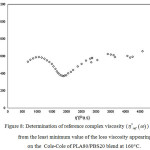 |
Figure 8: Determination of reference complex viscosity ( ) from the least minimum value of the loss viscosity appearing on the Cole-Cole of PLA80/PBS20 blend at 160°C.
|
The compatibility of PLA/PBS blend can be interpreted from the modified Cole-Cole plots as shown in Figure 9, 10, 11, 12 and 13. For neat PLA, its modified Cole-Cole plot of four testing temperatures showed variant of the profiles specifically for temperature of 160°C and 170°C as a result of insufficient energy to melt all of the PLA crystalline region (Figure 9). In contrast to PLA, the flow characteristic of PBS showed temperature invariant behavior since the melting point of PBS was only at about 105°C (Figure. 10). By adding relatively low level of PBS (under 20%), the modified Cole-Cole plot of PLA80/PBS20 reversed the variant of the profiles to invariant characteristics of viscoelastic properties, so PBS improved the flow characteristic without any obvious phase separation. However, the incompatibility of the blends at higher level of PBS, which was noticeable in the modified Cole-Cole plot of PLA65/PBS35 and PLA50/PBS50 (Figure 12 and 13), limited the use of PBS in modification of the mechanical properties of PLA. Surprisingly, the maximum additional level for the two types of polymers before any occurrence of phase separation was commonly reported below 30%, for example, poly(methyl methacrylate)/poly(styrene–co–acrylonitrile) blends and PLA/PBS6,10. Since the homogeneity of the polymer blend was governed by the thermodynamic equilibrium, incremental addition of a minor phase was still possible if ones can make the polymer blend compositions under thermodynamically stable.
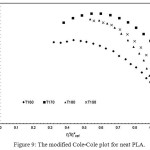 |
Figure 9: The modified Cole-Cole plot for neat PLA.
|
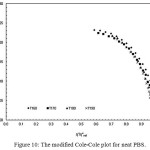 |
Figure 10: The modified Cole-Cole plot for neat PBS.
|
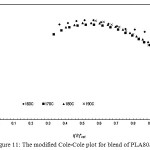 |
Figure 11: The modified Cole-Cole plot for blend of PLA80/PBS20. |
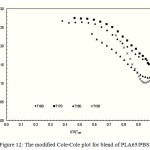 |
Figure 12: The modified Cole-Cole plot for blend of PLA65/PBS35.
|
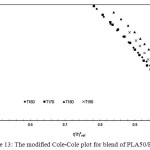 |
Figure 13: The modified Cole-Cole plot for blend of PLA50/PBS50.
|
Interpretation of the rheological properties of PLA/PBS blends was in correspondent to the thermal properties both in term of plasticizing effect and compatibility. It is worth noting here that viscoelastic properties, determined by oscillation rheometer, provided a definite determination of the maximum allowable blending composition comparing to the result from the thermal properties obtained by DSC. Perhaps, it was due to the sensitivity of oscillation rheometer in determination of molecular mobility or the thermal history in the polymer may also cause a deviation in thermal analysis by DSC.
Conclusions
Improvement of thermal processability of polylactides was carried out by compounding with polybutylene succinate (PBS). The influence of PBS on the thermal, mechanical, and rheological properties of PLA/PBS blend was thoroughly described. Mechanical properties of the blend showed that PBS effectively reduced Young’s modulus and tensile strength, but had a small effect on % elongation at break. Thermal and rheological properties showed much improvement in the flowability of the blend. Relatively small quantity of PBS made the blend flow easier resulting from lower values of shear viscosity. However, the thermal characteristic of the blend showed a two phase system with two distinct melting peaks at around 108ºC and 153ºC and a positive Gibb’s free energy for all of the blending formulas. Nevertheless, rheological properties supported the acceptability of miscible levels when PBS content in the PLA/PBS was lower than 20%. Compatibility of polymer blend, e.g. the PLA/PBS, can be definitely determined from rheological properties. The Cole-Cole plot was modified as a method for the determination of transition between homogeneous and heterogeneous state of the polymer blend, so the maximum additional level of the minor phase can be set to avoid unwanted phase separation problems.
Acknowledgments
This project was financially supported by the National Innovation Agency (Thailand) and we would like to thank Suranaree University of Technology for equipment support.
References
- Chen, C.C.; Chueh, J.Y.; Tseng, H.; Huang, H.M.; Lee, S.Y. Biomaterials. 2003, 24, 1167-1173.
CrossRef - Jamshidian, M.; Tehrany, E.A.; Imran, M.; Akhtar, M.J.; Cleymand, F.; Desobry, S. Journal of Food Engineering. 2012, 110, 380-389.
CrossRef - Bang, G.; Kim, S.W. Journal of Industrial and Engineering Chemistry. 2012, 18, 1063-1068.
CrossRef - Hamad, K.; Kaseem, M.; Yang, H.W.; Deri, F.; Ko, Y.G. eXPRESS Polymer Letters. 2015, 9(5), 435-455.
CrossRef - Dorgan, J.R.; Lehermeier, H.; Mang, M. Journal of Polymers and the Environment. 2000, 8, 1-9.
CrossRef - Bhatia, A.; Gupta, R.K.; Bhattacharya, S.N.; Choi, H.J. Korea-Australia Rheology Journal. 2007, 19, 125-131.
- Ray, S.S.; Okamoto, K.; Maiti, P.; Okamotoa, M. Journal of Nanoscience and Nanotechnology. 2002, 2, 1-6.
CrossRef - Qiu, Z.; Ikehara, T.; Nishi, T. Polymer. 2003, 44, 2503-2508.
CrossRef - Pillin, I.; Montrelay, N.; Grohens, Y. Polymer. 2006. 47, 4676-4682.
CrossRef - Park, S.B.; Hwang, S.Y.; Moon, C.W.; Im, S.S.; Yoo, E.S. Macromolecular. 2010, 18(5), 463-471.
- Shumsky, V.F.; Getmanchuk, I.P.; Ignatova, T.; Maslak, Y.U.; Cassagnau, P.; Boiteux, G.; Melis, F. Rheologica Acta. 2010, 49, 827-836.
CrossRef - Yokohara, T., and Yamaguchi, M. European Polymer Journal. 2008, 44, 677-685.
CrossRef - Vernay, V.; Michel, A. Rheologica Acta. 1985, 24, 627-631.
CrossRef - Wisniewski, C.; Marin, G.; and Monge, P. European Polymer Journal. 1985, 21, 479-484.
CrossRef - McCarthy, S.P.; Gross, R.A.; Ma, W. Polylactides Based Blends. US Patent No. 5883199, 1999.
- Lee, S.; Lee, J.W. Korea-Australia Rheology Journal. 2005, 17, 71-77.
CrossRef - Shibata, M.; Teramoto, N.; Inoue, Y. Polymer. 2007, 48, 2768-2777.
CrossRef - Li, H.; Huneault, M.A. Journal of Applied Polymer Science. 2011, 122, 134-141.
CrossRef - Pilla, S.; Kim, S.G.; Auer, G.K.; Gong, S.; Park, C.B. Polymer Engineering & Science. 2009, 49(8), 1653-1660.
CrossRef - Park, J.W.; Im, S.S. Journal of Applied Polymer Science. 2002, 86, 647-655.
CrossRef - Flory, P.J. Principles of polymer chemistry, Cornell University Press, Ithaca, New York, USA 1953, 51-65.
- Hoffman, J.D.; Miller, R.L.; Marand, H.; Roitman, D.B. Macromolecules. 1992, 25, 2221-2229.
CrossRef - Collyer, A.A.; Clegg, D.W. Rheological Measurement, Second Edition, Chapman and Hall, UK 1998, 167-189.
CrossRef - Vinogradov, G.V.; Malkin, A.Y. Rheology of Polymer, Springer-Verlag, New York, USA 1980.
CrossRef


![]()


