Synthesis and Spectroscopic Characterization of Some Transition Metal Complexes of Schiff Base 3-(2-hydroxyphenylimino) methyl-4,5,-dimethyl-1-phenylpyrazol-3-in-2-one
Preethy Soosan Thomas, Surya Philip and K. Mohanan
Department of Chemistry, University of Kerala, Kariavattom, Trivandrum-695 581, India.
Corresponding Author E-mail: drkmohanan@rediffmail.com
DOI : http://dx.doi.org/10.13005/ojc/330611
A novel potentially tridentate Schiff base has been prepared by condensing antipyrine-4-carboxaldehyde with 2-aminophenol. This ligand formed a series of complexes with cobalt(II), nickel(II), copper(II) and zinc(II) ions. The ligand and the metal complexes were characterized through various physicochemical and spectral studies. These studies include elemental analysis, molar conductance, magnetic susceptibility, UV-Vis, IR, 1H NMR, mass and ESR spectral studies. The ESR spectral data revealed that the metal-ligand bonds have considerable covalent character. The XRD profile of the ligand and the cobalt(II) complex indicated a hexagonal crystal structure. The fluorescence spectra of the ligand and its metal complexes in DMSO were also recorded. The copper(II) metal complex was subjected to thermal decomposition study.
KEYWORDS:Antipyrine-4-Carboxaldehyde; Shiff Base; ESR; XRD; Fluorescence; Thermogravimetry
Download this article as:| Copy the following to cite this article: Thomas P. S, Philip S, Mohanan K. Synthesis and Spectroscopic Characterization of Some Transition Metal Complexes of Schiff Base 3-(2-hydroxyphenylimino) methyl-4,5-dimethyl-1-phenylpyrazol-3-in-2-one. Orient J Chem 2017;33(6). |
| Copy the following to cite this URL: Thomas P. S, Philip S, Mohanan K. Synthesis and Spectroscopic Characterization of Some Transition Metal Complexes of Schiff Base 3-(2-hydroxyphenylimino) methyl-4,5-dimethyl-1-phenylpyrazol-3-in-2-one. Orient J Chem 2017;33(6). Available from: http://www.orientjchem.org/?p=40202 |
Introduction
Schiff base complexes exhibit remarkable biological activity and play an important role in bioinorganic chemistry. Transition metal Schiff base complexes have received considerable attention because of their pharmacological properties and numerous applications including biological, clinical, analytical and pharmacological areas1-5. Transition metal complexes with oxygen and nitrogen donor ligands are of great interest for their ability to possess unusual configurations, their structural lability, and their sensitivity to molecular environments6. Metal complexes of Schiff bases containing hetero aromatic ring systems may be considered as models for substrate metal ion – enzyme interactions and other metal ion mediated biochemical interactions7. The pyrazolone derivatives have been reported to possess strong antidiabetic, anticancer, antineoplastic, antibacterial, antihistaminic and antifungal, analgesic, antipyretic, anti-inflammatory, and anti-rheumatic activities8-11. The coordination chemistry of antipyrine derivatives has attracted much attention by virtue of their multifunctional properties as coordinate, antioxidant, antiputrefactive and optical characteristics in chemical and material fields7. 2-Aminophenol based Schiff base complexes have wide applications in biological field as antidepressants, antimicrobial, antitumor, antiphlogogistic, nematocide and other medicinal agents12-14.
In the present work, a new Schiff base (HL) ligand formed by the condensation of antipyrine-4-carboxaldehyde with 2-aminophenol viz. 3-(2-hydroxyphenylimino)methyl-4,5-dimethyl-1-phenylpyrazol-3-in-2-one (HACAP) with cobalt(II), nickel(II), copper(II) and zinc(II) have been synthesized. The ligand and its metal complexes were characterized through elemental analysis, molar conductance, magnetic susceptibility measurements, UV-Vis, IR, 1H NMR, mass and ESR spectral studies.
Materials and Methods
All the chemicals used were of Analytical grade and used without further purification. Antipyrine-4-carboxaldehyde, 2-aminophenol and metal salts were Merck products and used as supplied. Commercial solvents were distilled and used for synthesis. For physicochemical measurements, the solvents were purified by standard methods. Carbon, hydrogen and nitrogen analyses were performed using Heraeus Carlo Erba 1108-CHN Analyser Elementar System and the metal contents in the complexes were determined using a Nulab GBC 902 atomic absorption spectrophotometer in an acetylene/air flame. Molar conductance measurements were conducted using 10−3M solutions of the complexes in appropriate solvents at room temperature with a Systronic model 304 digital conductivity meter. Infrared spectral studies were carried out using a Thermo-Nicolet Avatar 370 FT-IR spectrophotometer and electronic spectra were recorded on a Hitachi 320 UV–Vis spectrophotometer. The NMR spectra of the ligand and the zinc(II) complex were recorded on a JEOL GSX 400MHz FT NMR spectrometer employing TMS as internal reference and DMSO as solvent. The EPR spectrum of the copper(II) complex was recorded using a JES – FA200 ESR Spectrometer with X band employing manganese as reference material. X-ray diffraction experiments were carried out on a Siemens D 5005 model spectrometer. Thermal decomposition studies were carried out using a Mettler Toledo thermogravimetric balance in dynamic air, at a heating rate of 10 ºC/min.
Preparation of the Ligand
The ligand(HACAP) was prepared by condensing antipyrine-4-carboxaldehyde with an ethanolic solution of 2-aminophenol in 1:1 molar ratio. The mixture was stirred for about 2 hrs at 400C. Pale yellow coloured crystals separated were filtered, washed successively with ethanol and ether, recrystallized from ethanol (90% yield, m.p. 120◦C).
Preparation of Metal Complexes
Metal complexes were prepared by the following general procedure: To a hot ethanoic solution (100mL) of the ligand, ethanoic solution of metal salt in the appropriate ratio was added in small portions. Stirred for about one hour at 50-600C and the mixture was then heated under reflux about 4-6 hrs. The pH of the solution was maintained between 6.5 – 7.5 by adding alcoholic ammonia solution. Finally the volume of the solution was reduced to half of its initial volume and allowed to cool. The solid complex separated out was filtered off and washed successively with ethanol and ether, and dried in vacuum.
Results and Discussion
Analytical and physical data of the ligand and its metal complexes are presented in Table 1
Reaction between metal(II) salts and the ligand can be symbolized by the following equations:
MX2 +2 HACAP → [M(ACAP)2)] + 2HX ; M = Co(II), Ni(II) ; X= Cl [1]
MX2 + HACAP → [M(ACAP)X] + HX ; M = Cu(II), Zn(II) ; X= Cl [2]
The ligand formed well-defined complexes with cobalt(II), nickel(II), copper(II) and zinc(II) salts. All the complexes are stable at room temperature and possess good keeping qualities. Analytical data of the complexes are in good accord with their formulation as in Table 1. Formulation of these complexes has been based on their elemental analysis, molar conductance measurements, magnetic susceptibility and various spectral data. Molar conductance values of the complexes measured in DMSO solvent adequately confirm the nonelectrolytic nature of complexes15.
Table 1: Analytical data of Schiff base and its metal complexes
| Compound |
Yield (%) |
Colour | Melting point (°C) | Analytical data*(%) | Molar conductance (Ω-1cm2mol-1) in DMSO |
Magnetic moment (BM) | |||
| M | C | H | N | ||||||
| HACAP |
90 |
Pale Yellow | 120 | – | 70.23 (70.34) | 5.88(5.58) | 13.60(13.67) |
– |
– |
| [Co(ACAP)2] |
75 |
Brown | >300 | 8.19(8.77) | 64.54(64.38) | 4.05(4.8) | 12.08(12.51) | 14.3 | 4.76 |
| [Ni(ACAP)2] |
71 |
Green | 280 | 8.85(8.74) | 63.56(64.40) | 4.53(4.80) | 12.49(12.52) | 13.3 | 3.12 |
| [Cu(ACAP)Cl] |
78 |
Greenish black | 260 | 15.18(15.68) | 53.75(53.34) | 3.90(3.98) | 10.72(10.37) | 16.6 | 1.82 |
| [Zn(ACAP)Cl] |
75 |
Yellow | >300 | 16.60(16.06) | 53.58(53.09) | 3.63(3.96) | 10.65(10.32) | 14.2 | D |
*Calculated values are given in brackets, D: Diamagnetic
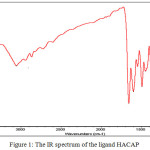 |
Figure 1: The IR spectrum of the ligand HACAP |
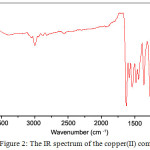 |
Figure 2: The IR spectrum of the copper(II) complex |
The IR spectral data of the ligand and the metal complexes are given in Table 2. The IR spectrum of the Schiff base showed a broad absorption band spreading over the region 3546-3059 cm-1, centered at 3360 cm-1, which can be attributed to the stretching vibration of intramolecular hydrogen bonded OH group16,17. This band disappeared on complexation indicating the coordination of metal through OH group after deprotonation (Fig. 1&2).
Consequently the phenolic ν(C-O) observed at 1238 cm-1 in the ligand has increased by ~35 cm-1 on complexation187. A characteristic intense peak at 1657 cm-1 ascribed to ν(C=O) stretching frequency of the intramolecular hydrogen bonded cyclic keto carbonyl group of the pyrazolone ring19. On complexation, this peak has been shifted to lower frequency by ~ 30 cm-1 in all the complexes (Fig. 1&2), indicating coordination of pyrazolone carbonyl oxygen with the metal ion17. The medium intense band at 1600 cm-1 present in the IR spectrum of the free ligand may be assigned to the ν(C=N) stretching frequency of the azomethine moiety7,1718. On chelation this value was shifted to lower frequency by ~ 20 cm-1.
The downward shift of these bands is a clear indication of coordination of pyrazolone carbonyl oxygen and azomethine nitrogen to the metal ion. The bonding of the ligand to the metal ion is further supported by the appearance of new bands in the region 525 – 516 cm-1, 425 – 419 cm-1 and 370- 353 cm-1 have been assigned to the ν(M-O), ν(M-N) and ν(M-Cl) bands respectively in the far IR spectra of the metal complexes7,18. These observations give added support that the ligand binds the metal ion in a tridentate manner, coordinating through azomethine nitrogen, pyrazolone carbonyl oxygen and phenolic oxygen atom.
Table 2: Important IR absorption frequencies(cm−1) of Schiff base HACAP and metal complexes
| HACAP | [Co(ACAP)2] | [Ni(ACAP)2] | [Cu(ACAP)Cl] | [Zn(ACAP)Cl] | Tentative Assignments(cm-1) |
| 3360 | – | – | – | ν(OH) | |
| 1657 | 1622 | 1626 | 1628 | 1631 | ν(C=O) pyrazolone ring |
| 1600 | 1581 | 1582 | 1585 | 1588 | ν(C=N) azomethine group |
| 1238 | 1263 | 1271 | 1265 | 1269 | ν(C-O) phenolic |
| – | 518 | 519 | 525 | 524 | ν(M-O) |
| – | 420 | 419 | 424 | 425 | ν(M-N) |
| – | 353 | 355 | 365 | 363 | ν(M-Cl) |
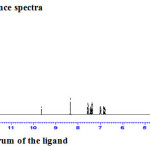 |
Figure 3a: 1HNMR spectrum of the ligand |
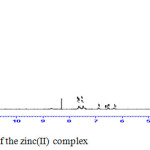 |
Figure 3b: 1H NMR spectrum of the zinc(II) complex |
The 1H NMR spectrum for the ligand and zinc(II) complex were recorded in DMSO-d6 with TMS as the standard (Fig. 3a & 3b). The 1H NMR spectrum of the ligand shows peaks in the region 2.72 ppm due to (= C-CH3) protons, 3.32 ppm due to protons of (-N-CH3), 8.35 ppm due to proton of the azomethine group and 9.6 ppm due to the proton of phenolic group14. In the 1H NMR spectrum of the zinc(II) complex the signal of OH proton disappeared indicates that the ligand coordinated to the metal through the phenolic oxygen after deprotonation. Complexation leads to a significant downfield shift of the azomethine proton signal (8.29 ppm) relative to the free ligand indicating that the azomethine nitrogen atom coordinates to the metal 7.
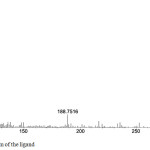 |
Figure 4a: Mass spectrum of the ligand Click here to View figure |
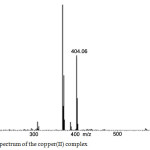 |
Figure 4b: Mass spectrum of the copper(II) complex Click here to View figure |
The electron impact mass spectrum of the Schiff base and its copper(II)complex are recorded (4 (a) & 4 (b)) and investigated. The mass spectral data adequately supported the suggested structures. The mass spectra are shown in Fig. It is clear from the figures that the molecular ion peaks are in good agreement with their suggested empirical formula as indicated from elemental analysis. The mass spectrum fragmentation pattern of Schiff base shows that the peak of m/z 307 corresponds to its molecular weight related to formula [C18H17N3O2]. The spectrum of the copper(II) complex showed molecular ion peak at m/z 404, which is equivalent to its molecular weight.
Electronic Spectra
The electronic absorption spectra of the ligand and its complexes were recorded in DMSO and the data are presented in Table 3. The Schiff base ligand exhibited two absorption bands at 313 nm and 356 nm due to π→π⃰ and n→π⃰ transitions respectively of the azomethine group7,17. These bands are shifted to lower energy region on complexation, indicating the coordination of azomethine nitrogen to the central metal ion17. Electronic spectral data and magnetic susceptibility measurements have been used to establish the geometry of the metal complexes20. The electronic spectrum of cobalt(II) complex exhibited two bands around 605 nm (16529 cm-1) and 520 nm (19230 cm-1) assignable to the 4T1g (F) → 4A2g(F) and 4T1g(F) → 4T1g(P)transitions respectively21. The magnetic moment value of cobalt(II) complex (4.76 BM) together with the electronic spectral data indicates an octahedral geometry around the cobalt(II) ion22. Electronic absorption spectrum of nickel(II) complex shows weak bands at 580 nm (17241 cm-1) and 400 nm (25000 cm-1) which are assigned to 3A2g(F)→3T1g(F) and 3A2g (F)→ 3T1g(P) transitions respectively23. The magnetic moment value of nickel(II) complex (3.12 BM) jointly with the electronic spectral data suggests an octahedral geometry around the nickel(II) ion21. The copper(II) complex shows two broad bands at 710 nm(14084 cm-1) and 585 nm(17094 cm-1) which are assigned to 2B1g→ 2A1g and 2B1g→ 2Eg transition respectively24. The copper(II) complexes are susceptible to Jahn Teller distortion. The copper(II) complex has a magnetic moment value of 1.82 BM. The magnetic moment value together with the electronic spectral data are in well agreement with a distorted square planar geometry22. Zinc(II) complexes are diamagnetic and a tetrahedral geometry is most preferable for four coordinated zinc(II) complex25.
Table 3: Electronic absorption spectral data (nm) and magnetic moment (BM) of the complexes
|
Metal complex |
d-d Transitions (nm) |
Magnetic moment(BM) |
|
|
Cobalt(II) complex |
605, 520 |
4T1g → 4A2g, 4T1g → 4T2g |
4.76 |
|
Nickel(II) complex |
580, 400 |
3A2g(F)→3T1g(F), 3A2g (F)→ 3T1g(P) |
3.12 |
|
Copper(II) complex |
710, 585 |
2B1g→ 2A1g, 2B1g→ 2Eg |
1.82 |
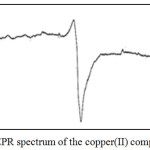 |
Figure 5: EPR spectrum of the copper(II) complex |
The X band EPR spectrum of copper(II) complex was recorded in DMSO at liquid nitrogen temperature(Fig.5). The spectrum showed axial symmetry with well- g‖ and g┴ values (g‖ = 2.27, g┴ = 2.03). The trend g‖ > g┴ >ge indicates that the unpaired electron is most likely in the dX2–y2orbital. It has been reported that g‖ values are sensitive to the covalent nature of the metal-ligand bond; the values above 2.3 show ionic character and lower values reveal covalent character26. From these values, it is evident that metal-ligand bonds have considerable covalent character.
In the axial spectra, the g values are related with exchange interaction coupling constant (G). The geometric parameter G, which is a measure of the exchange interaction between copper centers in a polycrystalline compound is calculated using the equation, (g‖-2.0023)/(g┴-2.0023)
According to Hathaway if G> 4.0, the local tetragonal axes are aligned parallel or only slightly misaligned. If G <4.0, significant exchange coupling is present and the misalignment is appreciable27. The observed value of 9.6 for G suggests that the exchange interaction between metal centers is negligible and the local tetragonal axes are only slightly misaligned.
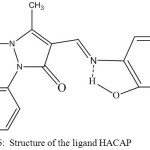 |
Figure 6: Structure of the ligand HACAP |
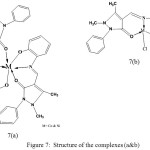 |
Figure 7: Structure of the complexes (a&b) |
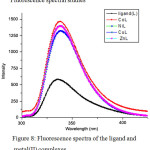 |
Figure 8: Fluorescence spectra of the ligand and metal(II) complexes |
The emission spectra of all the complexes and ligand in DMSO at room temperature have been recorded (Fig.8 ). The excitation wavelength was fixed at 280 nm and the emission spectra were recorded in the range 300 to 540 nm. Schiff base ligand exhibits an emission maximum at ~335 nm, which undergoes a slight red shift to ~339 nm upon complexation. The red shift probably was due to the charge-transfer that was caused by the alternation of the structure of the ligand during the formulation of complex28. The emission spectra are recorded for all the metal complexes using the same solvent. The fluorescent intensities of all the complexes are significantly larger than that of the ligand (almost two times larger). The fluorescence emission intensity of Schiff base increase upon complex formation with metal ions in the order: nickel(II) < zinc(II) ~ copper (II) < cobalt (II). The introduction of metal ion to the Schiff base enlarges the π-conjugated system of the complex and enhances the luminescent intensity of the complex29. Rigidity of the ligand increases upon complexation. The emission of the complexes, λmax = 338.5 nm, can probably be assigned to the intraligand fluorescent emission, since ligand displays a rather similar weak emission (λmax = 335 nm). The fluorescent intensity improvement may be due to the coordination of free ligand to metal ions reducing the loss of energy via non-radiative decay of the intra ligand excited states and due to an increase in the rigidity of the ligand30. Excited state emission of the azomethine ligand is quenched via photoinduced electron transfer processes (PET) within the ligand. It is expected that the coordination with the metal ions would alleviate PET (photoinduced electron transfer) process effectively and provide enhanced fluorescence on chelation31.
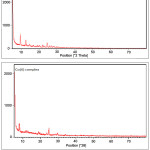 |
Figure 9: The X-ray diffractograms of the Schiff base ligand and the cobalt(II) complex. |
The X-ray diffractograms of the Schiff base ligand and the cobalt(II) complex were scanned from 50 to 800. The diffractograms of both the ligand and the complex indicate high crystallinity (Fig:9). The diffractogram of the ligand has recorded 18 reflections with maxima at 2θ= 9.5003 which corresponds to the interplanar distance, d =9.30960. The ligand has been successfully indexed to hexagonal crystal system with lattice constants a = 8.5365A0, b = 8.5365A0, c = 14.5061 A0 and cell volume = 915.463 A0 3. From the XRD pattern of the cobalt(II) complex, it is observed that the crystallinity has been retained after complexation. The complex has been indexed to hexagonal crystal system. The average crystalline sizes of the ligand and the cobalt(II) complex calculated using the Scherrer formula, dxrd = 0.9 λ/βcosθ and found to be 32 nm and 29 nm respectively.
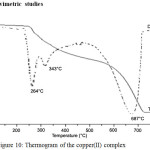 |
Figure 10: Thermogram of the copper(II) complex |
The copper(II) complex was subjected to thermal decomposition studies within a temperature range from room temperature to 800°C. The complex was thermally stable up to 258°C and decomposed in three stages in the temperature ranges 258 – 277°C, 277- 495°C and 546 -729°C (Fig. 10). The first stage of decomposition, starts from 258°C and ends at 277°C with peak temperature 2640C, followed a mass loss of 9.01%. This may be due to the loss of chlorine coordinated to the complex. The second stage of decomposition, starts from 277°C and ends at 495°C with peak temperature 343°C, showed a mass loss of 27.1% which could be attributed to decomposition of amino phenol moiety of the ligand. The third stage, starts from 546°C and ends at 729°C with peak temperature 687°C, showed a mass loss of 54.01% corresponding to antipyrine moiety and the oxidation of the metal to CuO which was stable above this temperature. Thermal decomposition data of the copper(II) complex is given in Table 4. The mass loss was in good agreement with the independent pyrolysis experiment. Apart from the thermal stability of the copper(II) complex this study also enabled to characterize the metal complex.
Table 4: Thermal decomposition data of [Cu(ACAP)Cl]
| Compound |
Decomposition step |
Temperature range(0C) |
Peak temperature |
Observed weight loss(%) |
Calculated weight loss(%) |
Probable assignment |
| [Cu(ACAP)Cl] |
I |
258-277 |
264 |
9.01 |
8.77 |
Loss of chlorine |
|
II |
277-495 |
343 |
27.1 |
26.5 |
Loss of aminophenol moiety of ligand | |
|
III |
546-729 |
687 |
54.01 |
53.52 |
Loss of antipyrine moiety and formation of CuO |
Conclusion
The ligand and its cobalt(II), nickel(II), copper(II)and zinc(II) complexes were characterized through elemental analysis, molar conductivity, magnetic moment measurement, UV–Vis, IR, NMR, ESR and fluorescence spectral studies wherever possible and applicable. Based on these data, an octahedral geometry has been assigned for cobalt(II) and nickel(II) complexes, square planar geometry for copper(II) complexand tetrahedral geometry for zinc(II) complex. The ligand acted as monobasic tridentate, coordinating via pyrazolone carbonyl oxygen, imino nitrogen and phenolic oxygen. Thermal stability of the copper(II) complex was examined using thermogravimetry. XRD study suggests hexagonal crystal system for the ligand and cobalt(II) complex. The emission spectral studies revealed that, the Schiff base and its metal complexes are fluorescent materials.
Acknowledgement
The authors are thankful to Head of the Department, Department of Chemistry, University of Kerala, Kariavattam Campus, Thiruvananthapuram, for providing necessary facilities for research work and UGC for sanctioning Teacher fellowship to Preethy Soosan Thomas. The financial support given to Prof. K. Mohanan by Kerala State Council for Science Technology and Environment (KSCSTE) is gratefully acknowledged.
References
- da Silva, C.M; da Silva, D.L; Modolo, L.V; Alves, R.B; de Resende, M.A; Martins, C.V.B; de F´atima, A. J. Adv. Res., 2011, 2, 1–8.
CrossRef - Nair, M.S; Kumari, S.S; Neelakantan, M.A. J. Coord. Chem., 2007, 60, 1291–1302.
CrossRef - Aazam, E. S; EL Husseiny, A.F; Hitchcock, P.B; Alshehri, J.M. Cent. Eur. J. Chem., 2008, 6, 319–323.
- Priyarega, S; Muthu, T.M; Babu, G.S; Karvembu, R.; Natarajan, K. Indian J. Chem., 2012, 51, 453-457.
- Kavitha, P.; Saritha, M.; Reddy, K.L. Spectrochim. Acta Part A., 2013, 102, 159–168.
CrossRef - Kumar, P.M.V; Radhakrishnan, P.K. Polyhedron, 2010, 29, 2335-2344.
CrossRef - Joseph, J; Rani, G.A.B. Spectrosc. Lett., 2014, 47, 86–100.
CrossRef - Ahn, J.H; Kim, H; Jung, S.H; Kang, S.K; Kim, K.R; Rhee, S.D; Yang, S; Cheon, H.G; Kim, S.S. Bioorg. Med. Chem. Lett., 2004, 14, 4461–4465.
CrossRef - Chauhan, S.; Paliwal, S; Chauhan, R. Synth. Commun., 2014, 44, 1333–1374.
CrossRef - Palaska, E; Aytemir, M.; Uzbay, I.T.; Erol, D. Eur. J. Med. Chem. 2001, 36, 539–543.
CrossRef - Maurya, R.C.; Sutradhar, D.; Martin, M.H.; Roy, S.; Chourasia, J.; Sharma, A.K.; Vishwakarma, P. Arabian J. Chem., 2015, 8, 78–92.
CrossRef - Raman, N.; Kulandaisamy, A.; Thangaraja, C. Transition Met. Chem., 2003, 28, 29–36.
- Krishnankutty, K.; Sayudevi, P.; Ummathur, M.B. J. Serb. Chem. Soc., 2007, 72, 1075–1084.
CrossRef - Raman, N.; Raja, J.D.; Sakthivel, A. Russ. J. Coord. Chem., 2008, 34, 400–406.
CrossRef - Geary, W.J. Coord. Chem. Rev. 1971, 7, 81-122.
CrossRef - Avaji, P.G.; Kumar, C.H.V.; Patil, S.A.; Shivananda, K.N.; Nagaraju, C. Eur. J. Med. Chem., 2009, 44, 3552–3559.
CrossRef - Bagdatli, E.; Altuntas, E.; Sayin, U. J. Mol. Struct., 2017, 1127, 653-661.
CrossRef - Bagihalli, G.B.; Avaji, P.G.; Patil, S.A.; Badami, P.S. Eur. J. Med. Chem., 2008, 43, 2639-2649.
CrossRef - Fouda, M.F.R.; Abd-Elzaher, M.M.; Shakdofa, M.M.; El-Saied, F.A.; Ayad, M.I.; El Tabl, A.S. J. Coord. Chem. 2008, 61, 1983-1996.
CrossRef - Sathyanarayana, D.N. Electronic Absorption Spectroscopy and related techniques; University Press (India) Limited. 2001.
- Hosny, N.M.; Hussien, M.A.; Radwan, F.M.; Nawar, N. Spectrochim. Acta Part A., 2014, 132, 121–129.
CrossRef - Daniel, V.P.; Murukan, B.; Kumari, B.S.; Mohanan, K. Spectrochim. Acta Part A., 2008, 70, 403–410.
CrossRef - Manjunath, M.; Kulkarni, A.D.; Bagihalli, G.B.; Malladi, S.; Patil, S.A. J. Mol. Struct., 2017, 1127, 314-321.
CrossRef - Sharma, K.V.; Sharma, V.; Dubey, R.K.; Tripathi, U.N. J. Coord. Chem. 2009, 62, 493-505.
CrossRef - Dudev, T.; Lim, C. J. Am. Chem. Soc. 2000, 122, 11146-11153.
CrossRef - P. Kamalakannan, D. Venkappayya, Russ. J. Coord. Chem. 2002, 28, 423-433.
CrossRef - B.J. Hathaway, A.A.G. Tomlinson, Coord.Chem.Rev. 1970, 5, 1.
CrossRef - Jun, L; Li, Z.; Lang L.; Guangfei, L.; Jixi, G.; Dianzeng, J. Inorg. Chim. Acta 2007, 360, 3504–3510.
- Mohanan, K.; Aswathy, R.; Nitha, L.P.; Mathews, N.E.; Kumari, B.S. J. Rare Earths 2014, 32, 379-388.
CrossRef - Ye, Q.; Chen, X.-B.; Song, Y.-M.; Wang, X.-S.; Zhang, J.; Xiong, R.G.; Fun, H.K.; You, X.Z. Inorg. Chim. Acta 2005, 358, 1258–1262.
CrossRef - Su, Z.; Chen, K.; Guo, Y.; Qi, H. J. Fluoresc. 2010, 20, 851-856.
CrossRef

This work is licensed under a Creative Commons Attribution 4.0 International License.
![]()
A New Edition of Web of Science
Journal Impact Factor
2022: 0.5
Five Year: 0.8
Journal is Indexed in

Cabells Whitelist
![]()


