Semi-Automated Flow Injection Method for the Determination of Iron (II) By 1,10-Phenanethroline
 and Dakhil Nassir Taha1
.1Department of Chemistry, College of Science, University of Babylon, Babylon, Iraq
.2Sub-Department of Basic Science , College of Nursing, University of Kufa, Kufa, Iraq
Corresponding author Email: alnakashluma@Yahoo.com
DOI : http://dx.doi.org/10.13005/ojc/330653
Download this article as:
![]()
The research is included determination of Fe(II) via its reaction with 1,10-phenanethroline to form light-red complex which is absorbed at λmax=510 nm. Home-made flow injection valve is designed with two loading loops, L1 and L2. A series of studies are conducted represented by: fixing physical and chemical optimum conditions, dead volume, repeatability, dispersion coefficient, construction calibration graph, and application of the method. The dead volume is zero for the system which it has high repeatability (n=8) with RSD and SD 0.6 and 0.05 respectively. The dispersion coefficient is 1.68 at the concentration 10 ppm. The range of measurements of calibration graph is (0.05-18.00) ppm with limit of detection (S/N=3) 0.05 ppm.
KEYWORDS:Home-made Flow Injection Valve; Determination of Fe(II); 1;10- Phenanthroline reagent
Introduction
Flow injection analysis FIA method is used in various analytical fields, which has a prominent role in agricultural, industrial, pharmaceutical and environmental fields. Flow injection technique is discovered and patented by the researchers Ruzicka, Hansen, and Stewart in 1975 (1). One of the main flow injection technique features are the ability of analysing the very small volumes of samples and reagents, high sampling rate, low detection limits, wide extent of concentrations, ability of miniaturization of the apparatuses, high repeatability of readings, less personal mistakes comparatively with the other techniques, and conversion the reactions of open system to the reactions of closed system (2-6).
The FIA system consists of many parts such as, peristaltic pump, manifold, detector, and recording device of signal (7). Flow injection valve is the most important part of the manifold and considered as the heart of FIA system, which is used for injecting the chemical reaction solutions (8-11). The sample-reagent segment is formed after loading process of the reaction components toward the detector by carrier stream rapidly (12). When the sample-reagent segment reaches to the flow cell inside the detector, the signal is recorded as a sharp peak. The signal with height, area, and width is recorded with time of sample analysis(13).
Iron is the most common element in Earth, which is never found in free elemental state, therefore; iron is extracted from its ores. Iron is considered as one of the essential trace elements in biological systems. The average amount of iron is over than 4g in human body. Iron plays very important roles in biological systems including: O2 transport in haemoglobin, regulation of gene expression, and regulating electron transfer, radical, and redox catalysis in enzymes (14,15).
The phenanthroline (phen) or 2,2`-bipyridine (bipy) reagent is heterocyclic organic compound with the formula C12H8O2 and absorbs at a wavelength of 265 nm. Phenanthroline reagent is in the form of white-colored crystalline and characterized by the formation of strong complexes with most metal ions so it is used as a common ligand in coordination chemistry. It is binds metals more tightly since it has two chelating nitrogen donors. [Fe(phen)3]2+complex is called as “ferroin” and well-studied which is characterized with deep red-colored and stable in acidic medium (16,17). 1,10-phenanthroline is used for the determination the trace amount of Fe (II) and has the chemical structure in Fig.1.
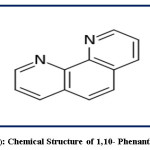 |
Figure 1: Chemical Structure of 1,10- Phenanthroline Click here to View figure |
The aim of this research is designing flow injection system for the determination of Fe (II) including home-made flow injection valve from available, inexpensive, and environmentally friendly materials. The proposed method has many features such as, rapidity, low cost, low consumption of reagents, and satisfactory results.
Experimental
Designing Stages of Flow Injection Valve
An integrated flow injection unit is designed for the determination of Fe (II) by using home-made valve with capacity loading of two solutions at certain stages, including firstly pumping the water as a carrier solution to the system, secondly injecting the sample of Fe (II), thirdly injecting the solution containing the reagent 1,10- phenanthroline, the buffer solution (pH= 5), and hydroxyamine hydrochloride and fourthly loading the injected solutions to the detector with helping of the carrier stream. The figures (2),(3),(4), and (5) show the four stages mentioned above in details.
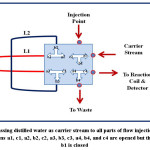 |
Figure 2: Passing distilled water as carrier stream to all parts of flow injection system, the directions a1, c1, a2, b2, c2, a3, b3, c3, a4, b4, and c4 are opened but the direction b1 is closed Click here to View figure |
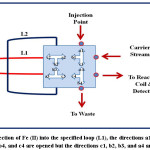 |
Figure 3: Injection of Fe (II) into the specified loop (L1), the directions a1, b1, a2, c2, a3, c3, b4, and c4 are opened but the directions c1, b2, b3, and a4 are closed Click here to View figure |
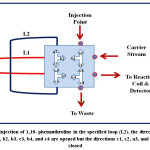 |
Figure 4: Injection of 1,10- phenanthroline in the specified loop (L2), the directions a1, b1, a2, b2, b3, c3, b4, and c4 are opened but the directions c1, c2, a3, and a4 are closed Click here to View figure |
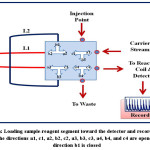 |
Figure 5: Loading sample-reagent segment toward the detector and recording the signal, the directions a1, c1, a2, b2, c2, a3, b3, c3, a4, b4, and c4 are opened but the direction b1 is closed Click here to View figure |
The chemical reaction between Fe (II) and reagent requires the mixing of four solutions: the sample Fe (II), the reagent 1,10-phenanthroline, hydroxylamine hydrochloride solution, and buffer solution. The quaternary home-made valve makes the loading of four solutions easier and more quickly via injecting these solutions into two loops only. L1 and L2 represent to the two loops of the valve which their volumes and capacities are calculated by using the relation V=π r2 L, as shown in table (1).
Table 1: Calculation the volumes of injection valve loops
|
Seq. No. |
Length of Loop L (cm) with radius r= 0.5 mm |
Volume V (μL) |
|
1 |
L1=10 |
78.50 |
|
2 |
L2=30 |
235.71 |
Instrumentation
A peristaltic pump (ISM796, Switzerland), the homemade flow injection valve, UV-Visible spectrophotometer (Apple PD-303UV, Japan), flow cell (450 μL, Helmma), kompensograph (C 1032 Siemens, Germany), and Teflon tubing throughout of internal diameter i.d.= 1 mm are used.
Reagents and Solutions (16,18-21)
All chemicals are of analytical-reagent grade and used without further purification. The following solutions are prepared by using distilled water.
- Fe (II) solution: Fe (II) solution of 100 ppm is prepared by dissolving 0.0665 g of ferrous ammonium sulphate [Fe(NH4)2(SO4)2.6H2O] in 100 mL of distilled water.
- Hydroxylamine Hydrochloride solution: 5% v/v of HAC [NH2OH.HCl] is prepared by dissolved 5 g of HAC in 100 mL of distilled water.
- 1,10-Phenanthroline solution: 1.10-phenanthroline monohydrate of 100 ppm is prepared by dissolving 0.01 g in 100 mL of distilled water and adding 2 drops of concentrated hydrochloric acid then the solution is heated to 70 ºC without boiling to facilitate the process of dissolving.
Buffer solution: first, 0.1 M of glacial acetic acid -with specific gravity 1.05 g.L-1 and percentage 90%- is prepared followed by dissolving 1.0 g of sodium acetate trihydrate in glacial acetic acid solution to get 0.1 M of buffer solution.
Results and Discussion
Calibration of Pump Speed
This study is conducted to calibrate the speed of the peristaltic pump and calculate the volume for the solutions per minute at different values of pump speed by using stopwatch. The results are illustrated in table (2) and figure (6).
Table 2: Calculation Flow Rate
|
Speed of Pump (rpm) |
Flow Rate (mL.min-1) |
|
40 |
2.3 |
|
50 |
2.9 |
|
60 |
3.1 |
|
70 |
3.4 |
|
80 |
3.9 |
|
90 |
4.3 |
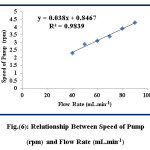 |
Figure 6: Relationship Between Speed of Pump (rpm) and Flow Rate (mL.min-1) Click here to View figure |
Optimum Position for Injecting Sample & Reagent
Choosing the optimum position effects on the value and the sensitivity of the response when the solutions are injected into the valve at different volumes and capacity of loops. The effect of position replacement for both Fe (II) and reagent is studied at λmax=510 nm, 12 ppm of Fe (II) and 1,10-phenanthroline reagent, flow rate of 3.1 mL.min-1, and length of reaction coil is 35 cm. Table (3) and figure (7) show that the injecting of 1,10-phenanthroline reagent and Fe (II) into L1 and L2 -with the capacities 78.50 μL and 235.71 μL respectively- results in response with 4.5 cm of height. The changing of injecting positions results in response with 6.9 cm of height and this is agreed with the literatures (16,17).
Table 3: Optimum Positions for Reagent & Sample in The Injection Valve
|
Seq. No. |
Injecting Position |
Response (cm) |
|
1 |
Injecting of 1,10-phenanthroline into L1 and Fe (II) into L2 |
4.5 |
|
2 |
Injecting of 1,10-phenanthroline into L2 and Fe (II) into L1 |
6.9 |
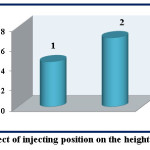 |
Figure 7: Effect of injecting position on the height of response Click here to View figure |
Effect of Carrier Stream Flow Rate
The dilution is lesser at slow flow rates because decreasing flow rate increases the sample retention time before moving to the detector and the interaction between the sample and the detector reaches the state of equilibrium and therefore the response will be higher at slow flow rate (22). The low flow rates show a wide, double, and distorted peak. Studying the effect of changing flow is conducted at λmax=510, 12 ppm of both sample and reagent, the injection positions are L1 and L2 for sample and reagent respectively, and the length of reaction coil is 35 cm. The range of flow rate is (1.9-4.3) mL.min-1 and the results are illustrated in table (4) and figure (8).
Table 4: Effect of changing flow rate on the response
|
Flow Rate (mL.min-1) |
Response (cm) |
|
1.9 |
3.7 |
|
2.3 |
5.1 |
|
2.9 |
5.3 |
|
3.1 |
5.8 |
|
3.4 |
7.0 |
|
3.9 |
5.3 |
|
4.3 |
5.3 |
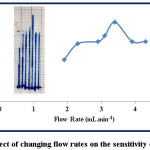 |
Figure 8: Effect of changing flow rates on the sensitivity of response Click here to View figure |
According to table (4) and figure (8), the increase in flow rate from 1.9 to 3.1 mL.min-1, the response gradually increases from 3.7 to 5.8 cm, because the slower flow rate that provides longer time causes a dilution of the sample by the carrier stream solution. But at the higher flow rates, the shortest time for dilution of the injected sample is occurred and the response increases to 3.4 mL.min-1. When the time is optimal and the sample-reagent segment dilution is reduced, the response is reached to the maximum height at 7 cm. Then increase the flow rate from 3.9 to 4.3 mL.min-1 causes the response to be constant at a height of 5.3 cm. The very high flow rates cause the solutions not to be fully mixed and lack equilibrium state of the reaction, therefore the response is reduced (23-25).
Coil Reaction Length
The length of reaction coil effects on the reaction and the fully mixing of the solutions to reach to equilibrium state. Also, shape, diameter, and length of the reaction coil effect on the formation of sample-reagent segment at the optimal time, and the sampling rate.
The effect of reaction coil length is studied at λmax=510 nm, the concentration of 12 ppm of Fe (II) and 1,10-phenanthroline reagent, flow rate=3.4 mL.min-1, and the injection positions of Fe (II) and 1,10-phenanthroline reagent are via L1 and L2 respectively. The effect of reaction coil lengths is studied at the range (35-175) cm. The results are shown in table (5) and figure (9).
Table 5: Effect of Reaction Coil Length
|
Seq. No. |
Reaction Coil Length (cm) |
Response (cm) |
|
1 |
35 |
7.0 |
|
2 |
60 |
9.1 |
|
3 |
90 |
8.3 |
|
4 |
115 |
8.7 |
|
5 |
175 |
6.9 |
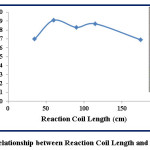 |
Figure 9: Relationship between Reaction Coil Length and Response Click here to View figure |
According to table (5), the increasing of reaction coil lengths from 35 cm to 60 cm leads to increase the height of response from 2.8 cm to 3.0 acutely. The reaction coil of length 35 cm does not allow good mixing for the reaction components but, the lengths 60 cm, 90 cm, and 115 cm provide sufficient time for good mixing and reaching equilibrium state which causes maximum height of response at reaction coil length of 60 cm. Figure (9) shows reducing in the response height when the length of reaction coil is increase to 175 cm due to high dilution of sample-reagent segment. Especially, the reaction between Fe (II) and 1,10-phenanthroline reagent is rapid and there is no need for further mixing to reach equilibrium state (26).
Repeatability
Repeatability is repeating process of injection –at least six injections- at the same conditions to prove the precision of injection for the system (27,28). The repeatability is studied for eight injections (n=8) at the same optimum conditions including: λmax=510 nm, the concentration of 12 ppm of Fe (II) and 1,10-phenanthroline reagent, flow rate=3.4 mL.min-1, reaction coil length=60 cm, and the injection positions of Fe (II) and 1,10-phenanthroline reagent are via L1 and L2 respectively. Standard deviation S.D and relative s Standard deviation values are 0.05 and 0.6 respectively. The results are illustrated in table (6) and figure (10).
Table 6: Repeatability for Eight Injections
|
Seq. No. of Peak |
Response (cm) |
|
1 |
7.9 |
|
2 |
7.8 |
|
3 |
7.8 |
|
4 |
7.8 |
|
5 |
7.9 |
|
6 |
7.8 |
|
7 |
7.8 |
|
8 |
7.8 |
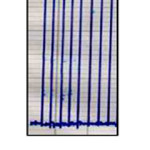 |
Figure 10: High Repeatability for Eight Injections Click here to View figure |
Dispersion Coefficient (D)
Dispersion coefficient is studied through the comparison the form and height of response before dilution (H0) and after dilution (Hmax) after fixing the optimum conditions, as illustrated in table (7) and figure (11). It has to be noted that the response height is reduced with dilution. The dispersion coefficient (D) is calculated as follows (29):
D=H0/Hmax ……………. (1)
D=13.1/7.8=1.68
The dispersion coefficient value 1.68 means that the dilution is limited and considered in favor of the system.
Table 7: Response with dilution and without dilution
|
Response without dilution (H0) |
Response with dilution (Hmax) |
Dispersion coefficient (D) |
|
13.1 cm |
7.8 cm |
1.68 |
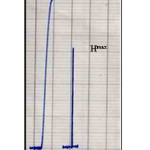 |
Figure 11: Dispersion Coefficient Click here to View figure |
Dead Volume
Dead volume is the remaining volume of any component of chemical reaction during loading process of solutions into injection valve. Dead volume is considered as a measure of FIA system efficiency. If the value of dead volume is not zero, that causes appearance of signal in the baseline. In this case, the injection valve is imperfect but the zero value of dead volume proves the high efficiency of FIA system. It has to be noted that all responses have the same baseline because the dead volume is zero (30,31).
Sampling Rate
Sampling rate is the number of analysed samples per one hour. The time of sample analysis is calculated from injection stage of reaction components and response appearance ascending to the maximum peak followed by the descending of response to the baseline. It is found that the time of analysis for one sample is 55 seconds; hence, the sampling rate is about 66 sample per hour. The sampling rate of about 66 sample per hour is considered good result according to the literature (32).
Calibration Graph
This study is conducted at λmax=510 nm after fixing the optimum conditions including: 12 ppm of 1,10-phenanthroline reagent, flow rate=3.4 mL.min-1, reaction coil length=60 cm, and the injection positions of Fe (II) and 1,10-phenanthroline reagent are via L1 and L2 respectively. The range of Fe (II) concentrations is (1.0-18.0) ppm with limit of detection (LOD=3.3S/N) 0.05 ppm and the results are illustrated in table (8) and figure (12) in details.
Table 8: Calibration graph of Fe (II)
|
Seq. No. |
Fe (II) concentration (ppm) |
Response (cm) n=3 |
|
1 |
0.1 |
1.2 |
|
2 |
0.5 |
1.8 |
|
3 |
1.0 |
2.3 |
|
4 |
2.0 |
2.9 |
|
5 |
3.0 |
4.2 |
|
6 |
6.0 |
5.2 |
|
7 |
9.0 |
6.7 |
|
8 |
11.0 |
8.3 |
|
9 |
15.0 |
9.9 |
|
10 |
18.0 |
13.4 |
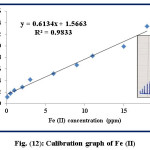 |
Figure 12: Calibration graph of Fe (II) Click here to View figure |
Statistical Analysis (26,27)
The analysis of variance (ANOVA) and student ʻtʼ test, is conducted by using Table Curve 2d v5.01 Systat Software. All measurements are replicated three times (n=3) and the results are detailed in the tables (9) and (10).
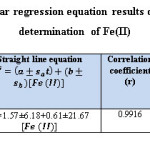 |
Table 9: Summary of linear regression equation results of the form Y=bX+a for the determination of Fe(II) Click here to View table |
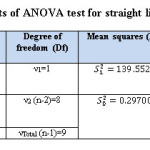 |
Table 10: The results of ANOVA test for straight line equation Y= bX+a Click here to View table |
The critical values Ftab is less than the calculated values of F (Fstat = 469.861) in flow injection method. The results approach to linear state, because, there is significant difference at 95% confidence interval between the variance due to regression and the variance due to error (Table:10).
Application
The proposed method is successfully applied for prepared solution of Fe (II). The obtained results show good recovery as shown in table (11). The percentage of relative error and recovery are calculated by using the equations (2) and (3) respectively.
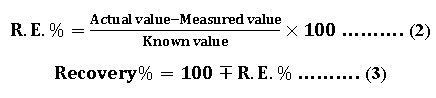
Table 11: Determination of Fe (II) in prepared solution by using the home-made flow valve
|
Sample |
Taken concentration ppm |
Found concentration ppm |
Er% |
Recovery% |
|
Fe (II) |
10 |
10.03 |
-0.3 |
100.3 |
Conclusion
The design of flow injection system for the determination of Fe (II) needs no expensive equipment compared to other techniques and modern flow injection systems are expensive. The determination of Fe (II) by the hand-designed and local unit is characterized by rapid analysis and wide range of concentrations, non-consumption of chemicals in large quantities, use of very low volumes and low concentrations of reaction solutions. In addition to the dead volume of the valve is zero indication to high efficiency of flow injection system as well as the high repeatability of the system.
Acknowledgement
We are grateful for the cooperation of the Chemistry Department at the Faculty of Science, University of Babylon, with our team ( Flow Injective Analysis Team, headed by Prof. Dr. Dakhil Nassir Taha ) in the same faculty for providing support and facilities for the team to get the best results.
References
- M. Trojanowiez, “Advances in Flow Analysis”, Wiley-VCH Verlag GmbH and Co. KGaA , 2010.
- M. Troanowicz, “Flow Injection Analysis, Instrumentations and applications”, 1st. Edition, World Scientific Publishing USA, 2000.
CrossRef - N.A. Naser; K.H. Kadim; D.N. Taha, Synthesis and characterization of an organic reagent 4-(6-Bromo-2-Benzothiazolylazo ) Pyrogallol and its analytical application, J. Oleo Sci. 61(7)387-392 (2012).
CrossRef - A. S. Farhood; L. A. Mohammed Ali and F. F. Ali, Determination of Aniline Blue dye by Flow Injection Analysis With Home Made Valve, Oriental Journal of Chemistry, 33(2), 944-950 (2017).
- A. Parikh, K. Patel, C. Patel, and B. Patel; J. Chem. Pharm. Res., 2(2):118-125, (2010).
- J. Ruzicka, and E. H. Hansen; “Flow Injection Analysis”, 2ndEdition, Wiley, New York, (1988).
- K. Leamsomrong, M. Suttajit, and P. Chantiratikul; Asian Journal of Applied Sciences, 2(2), 184 -190, (2009).
CrossRef - YU. Lingyun, WU. Mengru, D. Wei, J. Jing, and Z. Xinshen; Soil and Water Res., 6(4), 198-204, (2011).
CrossRef - D.N. Taha; I. S. Samaka; L. A. Mohammad, Adsorption removal of dye from industrial effluents using natural Iraqi palygorskite clay as low cost adsorbent, J. of Asian Scientific Research, 3(9) (2013).
- D.N. Taha; I. S. Samaka; L. A. Mohammad; A. S. Naige, Adsorption Studies of Direct Red 28 Dye onto Activated Carbon prepared from low-cost material, Civil and Environmental Research, 6(7)149-159(2014).
- D.N. Taha; I. S. Samaka, natural Iraqi palygorskite clay as low cost adsorbent for the treatment of dye containing industrial wastewater, J. Oleo Sci. 61(12) (2012).
CrossRef - D. Shriver, M. Weller, T. Overton, J. Rourke, and F. Armstrong; “Inorganic Chemistry”, 6th Edition, W. H. Freeman and Company, (2014).
- K. A. Strohfldt, “Essentials of Inorganic Chemistry: for students of pharmacy, pharmaceutical sciences, and medicinal chemistry”, 1st Edition, John Wiley and Sons Ltd, (2015).
- G.F. Lee, and W. Stumm; J. American water works Association, 52 (12), P.1567-1574, (1960).
CrossRef - R. Belcher; “Application of chelate Compounds in Analytical Chemistry” Pure and Applied Chemistry, volume 34, p.p. 13-27, (1973).
CrossRef - M. L. Wells, N.M. Price, and K.W. Bruland; Elsevier Marine Chemistry,48, p.p. 157-182, (1995).
CrossRef - A. Niazi; J.Croatica Chemica Acta , 79 (4), p.p. 573-579, (2006).
- N. D. Irhan, and F. T. Elmali; Turk J Chem , 27, p.p. 315 – 321, (2003).
- A. Faizulahd, and A. Townshend; Analytica Chimica Acta, 167, p.p. 225-231, (1986).
CrossRef - O. Osborne, A. Pring, and C. Lenehana; Talanta, 82, p.p. 1809–1813, (2010).
CrossRef - S. Han; Microchim Acta ,168, p.p.169–175, (2010).
CrossRef - M. Payan, M. Lopez, R. Torres, M. Navarro, and M. Moch; Talanta, 79 , 911–915, (2009).
CrossRef - D. N. Taha, and Z. S. Obaid; J. of Research of Pharmaceutical, Biological and Chemical Science, 7(6), (2016).
- G. J. Abbas, M. S. Mashkour, and D. N. Taha; J. of Purity, Utility, Reaction, and Environment, 5(4), 92-105, (2016).
- I. Akyar (Ed.), “Wide Spectra of Quality Control”, In Tech, (2011).
- D. G. Watson, “Pharmaceutical Analysis-A Textbook for Pharmacy Students and Pharmaceutical Chemists”, Churchill Livingstone, (1999).
- D. N. Taha and A. S. Majeed; “Innovative Design of Flow Injection Tri-valve and Its Use for the Determination of Trace Amounts of Bi (III)”, Iraqi patent, 4390, C.O.S.Q.C., (2015).
- D. N. Taha and A. S. Majeed, “ Innovation of Hexagonal Flow Injection Valve with Two Different Levels Locally and Its Use for Bi (III) Determination Using Merging Zone Technique“, Iraqi patent, 4605, C.O.S.Q.C., (2016).
- D. N. Taha and A. S. Majeed, “ Innovation of Flow Injection Hexagonal-double Valve with Two Different Levels and Its Use for the Determination of Bi (III) in Some Pharmaceutical formulations”, Iraqi patent, 4566, C.O.S.Q.C., (2016).
- A. S. Majeed, and D. N. Taha; “New Innovative Designs of Flow Injection and Microfluidic Systems for the Determination of Bismuth (III) in Pharmaceutical and Environmental Samples“, Ph.D. Thesis, Babylon University, (2015).
- J. N. Miller and J. C. Miller, “Statistics and Chemometrics for Analytical Chemistry”, 6th Edition, Pearson Education Limited, (2010).
- D. B. Hibbert and J. J. Gooding, “Data Analysis for Chemistry: An Introductory Guide for Students and Laboratory Scientists”, Oxford University Press, Inc., (2006).


![]()


