Role of Cetyltrimethyl Ammonium Bromide on Enhanced Adsorption and Removal of Alizarin Red S using Amino-Functionalized Graphene Oxide

1Materials Chemistry Research Center, Department of Chemistry and Center of Excellence for Innovation in Chemistry, Faculty of Science, Khon Kaen University, Khon Kaen 40002, Thailand.
2Nanomaterials Chemistry Research Unit, Department of Chemistry, Faculty of Science and Technology, Nakhon Si Thammarat Rajabhat University, Nakhon Si Thammarat 80280, Thailand.
Corresponding Author E-mail: sakcha2@kku.ac.th
DOI : http://dx.doi.org/10.13005/ojc/330627
Download this article as:
![]()
This research was aimed to study the adsorption capacity and removal of alizarin red S (ARS) dye using amino-functionalized graphene oxide (NH2-GO) as an adsorbent in the presence of CTAB. The optimum conditions were consisted of 100 mg/L initial concentration of ARS with 0.015 g adsorbent at solution pH 2.0. The adsorption equilibrium was completely reached within 60 min at 28°C. The maximum adsorption capacity of NH2-GO for ARS in the presence of CTAB (0.6 mM) was 135.1 mg/g, about three times higher than that of NH2-GO (42.0 mg/g) in the absence of CTAB. The adsorption kinetics well fitted using a pseudo second-order kinetic model. The intra-particle diffusion model obtained clearly defined its rate-limiting step. Changes in free energy, enthalpy and entropy were also evaluated. The overall adsorption process was endothermic reaction. The adsorption isotherm for NH2-GO in the presence of CTAB better fit with Freundlich model. It is, therefore, evident that the synergic effect of CTAB enhances the adsorption capacity and removal of ARS via their electrostatic interactions among the three reacting components in the adsorption reaction system.
KEYWORDS:Cetyltrimethyl Ammonium Bromide; Adsorption isotherm; Alizarin Red S; Amino-functionalized Graphene Oxide; Kinetics; Thermodynamics
Introduction
Alizarin red S (ARS) is one of the most durable anionic dye which is generally used as a staining agent in textile industries. It is also used to stain biological specimens such as mineralized bones in vertebrate groups and small invertebrate embryos.1,2 Most of the treatments for such dye-laden effluents are largely inadequate.3 Until now various adsorbents have been studied for the removal of ARS including multiwalled carbon nanotubes4, cyanodon dactylon5, menthe waste6, Citrullus lanatus Peels7, magnetic chitosan8, alumina9, activated clay modified by iron oxide10, activated carbon and other carbon-based materials.11–13 However, new adsorbents are recently developed to possess high capacity, larger specific surface area and high selectivity because some adsorbents are still low either efficiency or adsorption capacity.
Nowadays, graphene oxide (GO) has stimulated a strong interest due to their extraordinary properties, such as chemical stability, large surface area, and hydrophility.14,15 The large theoretical specific surface area and the abundance of functional groups on graphene oxide surface exhibit a capability for the adsorption of both cationic and anionic pollutant such as methylene blue16, malachite green17, congo red18, acridine orange19, methyl violet, rhodamine B and orange G.20 Recently, many functionalized adsorbents based on graphene have been extensively used to remove contaminants from aqueous solution. For example, sulfonated graphene has been used to remove naphthalene and 1-napthol.21 GO in situ reduction with sodium hydrosulfite could effectively remove acridine orange.22 However, a few investigations have been reported about the application of graphene derivatives as adsorbent to remove dyes. Therefore, the use of functionalized graphene oxide for the ARS removal from aqueous solution is extensively studied.
Amino functionalized graphene (NH2-G) was prepared and employed as adsorbent for the removal of a basic dye, malachite green (MG).23 The effect of pH, dye concentration, adsorption time, and temperature of the adsorption process was investigated. The results indicated that NH2-G showed a high efficiency for the removal of the basic dye MG with the maximum adsorption capacity of 92 mg/g. Thermodynamic data showed that the adsorption of MG onto NH2-G was an endothermic process with a large adsorption enthalpy. The kinetic study showed that the whole adsorption process fitted the pseudo-second-order kinetics model well. There are several studies implying CTAB as a surface modifier on their adsorbent to increase the adsorbent’s adsorption efficiency. Cationic surfactant, CTAB, was used to modify the surface of rGO. The nanomaterial was used to remove anionic dyes (direct red 80 and direct red 23) from waste water. The equilibrium data are well described by the Langmuir isotherm model, with maximum adsorption of 213 mg/g for DR80 and 79 mg/g for DR23. Dye removal follows pseudo-second order kinetics.
Alizarin red S forms an anionic moiety in aqueous solution. The complex formation of this dye was studied with CTAB, in an aqueous environment at low surfactant concentrations.24 It has been shown that the interaction between the dye-surfactant complex of ARS and CTAB in the pre-micellar region results in 1:1 ion-pair association. Both hydrophobic and electrostatic interactions are involved but, in case of oppositely charged dye and surfactant, the major contribution is of electrostatic origin, as is also evident from the negative value of entropy. An increase in temperature reduces the tendency to ion-pair formation. The importance of electrical forces is basically to bring the dye anion and the surfactant cation close enough in the pre-micellar region. It can be concluded that, because of the strong binding affinity of ARS with CTAB.
In order to improve the adsorption performance of the amino-functionalized graphene oxide (NH2-GO) adsorbent on dyes, CTAB was used as a surfactant binding agent. From previous reports, CTAB was commonly used to modify the surface of adsorbent and used it to remove the dyes from an aqueous solution, such as zeolite modified with CTAB has been used to adsorb basic red 46 and reactive yellow 176.25 CTAB modified on Attapugite was used to remove various types of dyes including methyl orange, methylene blue, amido black, methyl blue, congo red and rhodamine B.26 Also, using CTAB without adsorbent was implied to bind with ARS forming their complex species.24 Thus, in this study CTAB will be supplement as cationic surfactant with the (NH2-GO) for the adsorptive removal of ARS.
From these literatures, graphene oxide and its functionalized graphene oxide can be used for adsorption of various types of dyes. However, there is no report of using of amino-functionalized graphene oxide to remove alizarin red S in the presence of CTAB. Therefore, this study is aimed to use the GO-NH2 as an adsorbent for the adsorption and removal of alizarin red S in the presence of CTAB under optimum conditions. Their kinetics and thermodynamics studies are also investigated and discussed.
Materials and Methods
Chemicals
All chemicals and reagents used are of analytical grade and used without further purification. Sodium nitrate, sulfuric acid, EDTA and hydrogen peroxide were from Ajax Finechem (Australia). Graphite powder and alizarin red S were from Sigma-Aldrich (USA). Methanol and ethanol were from Merck (Germany). Sodium hydroxide was from Carlo Erba (Italy).
Instruments
All instruments used in this study included analytical balance, Model AC121S, Sartorius, (USA); ultrasonic cleaner, Model UC-80 (China); pH meter, Model UB-10 Ultra Basic, Denver Instrument (USA), and spectrophotometer, Model Agilent 8453 UV-Visible Spectrophotometer, Agilent, (Germany). Attenuated total reflectance – Fourier transform infrared (ATR-FTIR) spectroscopic measurements was performed on TENSOR 27 system Fourier transform infrared spectrometer (Bruker, Germany). Surface morphological images and EDX spectrum was taken by a Hitachi S-3000N scanning electron microscope (SEM, Hitachi Co. Ltd., Japan).
Synthesis and Characterization. of Graphene Oxide and Amino–Functionalized Graphene Oxide
Graphene oxide (GO) was prepared from graphite powder (GP) by a sequential oxidation process with the modified Hummer’s method.27 In a typical synthesis, 3.0 g of graphite powder was added to 300 mL of 98% H2SO4 under 0°C and then stirred for 30 min. After that, 3.0 g of NaNO3 was added portion wise to the mixture and kept further stirring for 30 min. Subsequently, a solid powder of KMnO4 (4.5% w/v) was slowly adding to the mixture, which always kept below 10°C in an ice bath. After stirring for 30 min, 200 mL of deionized water was then slowly added to the mixture and stirred again for 30 min. Then, the reaction mixture was set at 80°C for 6 h. After that, 40 mL of 30% H2O2was slowly added. The mixture solution was centrifuged and washed several times with deionized water until the pH of the filtrate reached neutral. The lyophilized precipitates were obtained. The obtained sample was characterized by FTIR and EDX techniques.
Graphene oxide was optimally produced from graphite as a starting material and was subject to functionalized with 3-aminopropyltrimethoxysilane (APTMS) to acquire amino group (-NH2). Briefly, 200 mg of GO was added to round flask with 25 mL ethanol and dispersed through ultrasonication for 30 min. Then, 4.5% w/v of APTMS was added and further ultrasonicated for 30 min. After that the mixture stirred at 65°C for 12 h. The obtained product was centrifuged and washed with ethanol and oven-dried at 50 °C for 12 h. The obtained powder was characterized by FTIR and EDX techniques.
Adsorption and Removal study of Alizarin red S in the Presence and Absence of CTAB using Amino–Functionalized Graphene Oxide
Amino-functionalized graphene oxide was used for the removal of alizarin red S by a batch adsorption experiment. The appropriate amount of adsorbent was accurately weighed into a 125 mL conical flask. Then, 10 mL of alizarin red S solution (various concentration) was added and the pH of the solution was adjusted and shaken by an orbital shaker at approximately 200 rpm at ambient temperature (30°C). After shaken the mixtures were centrifuge at 6,000 rpm for 5 min and the supernatant were analyzed using a UV-visible spectrophotometer at maximum absorption wavelength (λmax) of 420 nm to measure the remaining amount of alizarin red S. For optimum condition, various experimental parameters including solution pH, contact time, initial concentration of alizarin red S, sorbent dosage and ionic strength were investigated. Langmuir and Freundlich adsorption models, thermodynamic, and kinetic studies were used to describe the equilibrium nature of alizarin red S adsorption onto the GO-NH2.
In this study, the optimum concentration of CTAB was investigated by using the optimum adsorption conditions from previous experiment. Firstly, the surfactant was added into the mixture of amino-functionalized graphene oxide that was already adjusted to the optimum pH. Then, the mixtures were shaking for 30 min. After that, alizarin red S at the optimum concentration was added to the solution and continue shaking for optimal time. And finally, the mixtures were centrifuged at 6,000 rpm for 5 min and the supernatant were analyzed using a UV-visible spectrophotometer to measure the remaining amount of the alizarin red S. Langmuir and Freundlich adsorption models, thermodynamic, and kinetic studies were also used to describe the equilibrium nature of alizarin red S adsorption onto the GO-NH2 in the presence of CTAB.
Results and Discussion
Optimum Conditions for Adsorption Capacity and Removal of Alizarin red S Effect of pH
To determine the optimum pH of the solution for the adsorption of ARS, the experiments were performed in a wide pH range of 1.0–8.0 as depicted in Fig. 1. The result shows that the maximum uptake of the dye at the equilibrium adsorption capacity of 35–40 mg/g was achieved at pH range of 1.0–2.0. Thereafter, the rate of adsorption decreased till pH 8.0 to be about 5–10 mg/g of the dye adsorbed. Thus, the optimum pH of the solution should be around 2.0. The pHpzc of NH2GO was 7.5. Therefore, at lower pH range, the adsorption capacity of NH2–GO would be higher because the sorption processed proceeds through electrostatic interactions between the positive charge of carboxylic groups on the surface (GO–COOH2+) and its NH3+–functionalized GO and the anionic sulfonate groups of ARS (ARS–SO3–). So, at pH 2.0 most of their carboxylic and amino groups are protonated at which are favorable for the adsorption of the anionic dye. On the other hand, at higher pH range, the surface of the NH2–GO becomes neutral (-NH2) and negative charge (-COO–), since their carboxylic groups are deprotonated and do not favor the uptake of the anionic dye. In this study, the aqueous solution of pH 2.0 was chosen for the optimal conditions.
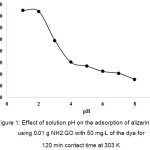 |
Figure 1: Effect of solution pH on the adsorption of alizarin red S using 0.01 g NH2–GO with 50 mg/L of the dye for 120 min contact time at 303 K Click here to View figure |
Effect of adsorbent dosage
The effect of the adsorbent dosage on the adsorption of alizarin red S was investigated by varying the NH2-GO from 0.005-0.025 g under other chosen conditions, as shown in Fig. 2. It is evident that the adsorption capacity of NH2-GO dramatically decreases with the increasing of the adsorbent dosage. High adsorptive removal of ARS seemed to limit with 0.015 g NH2-GO and it slightly increased at higher dosages. Thus, 0.015 g of GO was preferably used due to that reasonable adsorption.
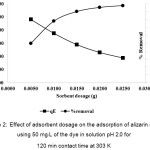 |
Figure 2: Effect of adsorbent dosage on the adsorption of alizarin red S using 50 mg/L of the dye in solution pH 2.0 for 120 min contact time at 303 K Click here to View figure |
Effect of an Initial Concentration of Alizarin Red S
The effect of an initial concentration for the adsorptive removal of alizarin red S (ARS) is very important parameter for the adsorption study because it can overcome all mass transfer restrictions of ARS between the aqueous and the solid phases, as shown in Fig. 3 showing plot of an equilibrium adsorption capacity of NH2–GO versus the initial concentration of ARS. It is clear that the adsorption capacity increases with an increasing of the initial concentration of ARS between 50 and 100 mg/L, then reached saturation about 200 mg/L. The adsorption capacity of this adsorbent at 100 mg/L of ARS concentration is over 50 mg/g with about 90% removal of the dye.
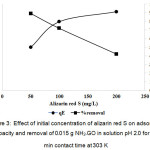 |
Figure 3: Effect of initial concentration of alizarin red S on adsorption capacity and removal of 0.015 g NH2–GO in solution pH 2.0 for 120 min contact time at 303 K Click here to View figure |
Effect of Contact Time
To study the effect of contact time between NH2-GO solid and ARS solution on the adsorption feature, the dye solution (100 mg/L) was treated with 0.015 g NH2-GO for various intervals of time ranging of 5-120 min with 200 rpm constant agitation. From Fig. 4, it is obviously shown that the rate of the adsorption drastically increases at the initial period of the contact time and gradually slows down with time until the equilibrium adsorption nearly reaches its state in the front range of 20-60 min and then slowly up to 120 min. The equilibrium state was somewhat established within 30 min. At the initial stage (10 min), the rate of dye adsorption may be due to an available number of active sites on the NH2-GO surface. Their adsorption amount on the adsorbent drastically increases and is normally controlled by the diffusion process from the bulk solution to the adsorbent surface. In the final stage, the adsorption amount of the dye is likely an attachment of the controlled process due to less available sorption sites.
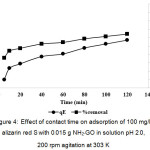 |
Figure 4: Effect of contact time on adsorption of 100 mg/L alizarin red S with 0.015 g NH2-GO in solution pH 2.0, 200 rpm agitation at 303 K Click here to View figure |
Effect of CTAB Concentration
The optimum concentration of CTAB was investigated under the optimum adsorption conditions as mentioned above. The CTAB concentrations were varied ranging from 0.15-0.90 mM as shown in Fig. 5. It was clearly evident that the maximum adsorption capacity of NH2-GO for the ASR removal was found in associated with 0.60 mM CTAB. It is about two times higher than that of in the absence of CTAB. Thus, this surfactant having ammonium ion polar head could serve binding via electrostatic interactions with the ASR anionic dye. It seems to act as an auxiliary ligand functioning along with the amino group on the adsorbent used. Therefore, it would be better to add CTAB into the adsorption system for further study on the adsorption mechanism and its isotherm model.
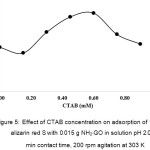 |
Figure 5: Effect of CTAB concentration on adsorption of 100 mg/L alizarin red S with 0.015 g NH2-GO in solution pH 2.0, 60 min contact time, 200 rpm agitation at 303 K Click here to View figure |
Thermodynamic Study of the dye Adsorption
In order to study the effect of temperature on the adsorption of ARS onto NH2–GO, thermodynamic data, the Gibbs free energy change (ΔG°), entropy change (ΔS°) and enthalpy change (ΔH°) were calculated using the following equations:
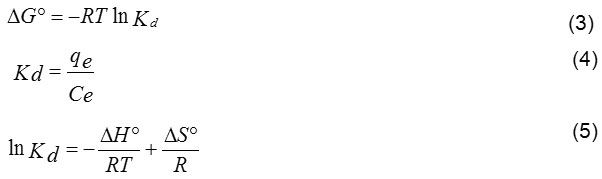
where, R is gas constant (8.314 J/mol K), T is absolute temperature in K and Kd is the equilibrium constant. qe is the amount of the dye (mg) adsorbed per gram of NH2–GO at equilibrium, Ce is the equilibrium concentration (mg/L) of the dye solution. The values of ΔS° and ΔH° can be calculated from the slope and the intercept of the van’t Hoff plot of ln Kd versus 1/T (Fig. 6).
Table 1 compiles these thermodynamic data of alizarin red S adsorption using NH2–GO in the absence and presence of CTAB. Under the steady–state reaction condition, the negative ΔG° indicates the spontaneity of the ongoing adsorption process. The positive ΔS° indicates a tendency to lower disorder at the solid–solution interface during the adsorption. In addition, the positive DH° indicates that the dye adsorption using NH2–GO is the endothermic nature, the lower value of ΔH° give clearly evidence that the interactions between the dye and its adsorbent in the presence of CTAB were rather stable. At higher temperatures the negative ΔG° values increase probably thickness of the boundary layer increases due to the increase in tendency of the dye molecules to be adsorbed on the adsorbent surface, resulting in increase in the adsorption capacity as the temperature increases.
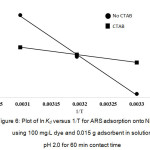 |
Figure 6: Plot of ln Kd versus 1/T for ARS adsorption onto NH2-GO using 100 mg/L dye and 0.015 g adsorbent in solution pH 2.0 for 60 min contact time Click here to View figure |
Table 1: Thermodynamic adsorption parameters of alizarin red S using NH2–GO in the absence and presence of CTAB
| Adsorbent | ΔH° (kJ/mol) | ΔS° (kJ/mol.K) | ΔG° (kJ/mol) | R2 | |||
| 303 K | 313 K | 323 K | |||||
| NH2-GO | 54.45 | 0.1801 | – 0.1153 | -1.9160 | -3.7167 | 0.9970 | |
| NH2-GO + CTAB | 10.38 | 0.0392 | – 1.5160 | -1.9086 | -2.3010 | 0.9998 | |
Kinetic Study of the dye Adsorption
The kinetic adsorption data were processed to understand the nature of the adsorption phenomenon in terms of the order of the rate constant. Kinetic data were applied with both pseudo–first order kinetic model and pseudo–second–order kinetic model. The pseudo first–order equation describes adsorption in solid–liquid systems based on the sorption capacity of solids. It has been proposed that only one ion of the dye is sorbed onto one sorption site on the NH2–GO surface. The linearized form of the pseudo first–order models can be written by following equation (6):14,17

where, k1 is the rate constant (L/min) of the pseudo–first order adsorption, qe and qt are the amounts of alizarin red S adsorbed onto adsorbent at an equilibrium (mg/g) and at time t, respectively. The values of k1 and qe are calculated from slope and intercept of the plot of log (qe-qt) versus t (Fig. 7).
 |
Figure 7: First–order kinetic adsorption of alizarin red S using NH2–GO in the presence and absence of CTAB at 303 K. Click here to View figure |
The pseudo second–order rate expression has been applied for analyzing chemi–sorption kinetics from liquid solutions. From the assumption of this model, only one ion of the dye is sorbed onto two sorption sites on the NH2–GO surface. The linearized form of the pseudo second–order models can be written by following equation (7) :17
where, qe and qt are the maximum adsorption capacity (mg/g) for the pseudo–second–order adsorption of alizarin red S adsorbed at an equilibrium (mg/g) at time t (min) and k2 is the rate constant of the pseudo–second–order adsorption (g/mg min). The values of k2 and qe for the pseudo–second–order adsorption were calculated from slope and the intercept of the plot of t/qt versus t (Fig. 8).
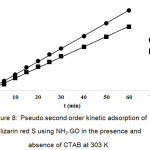 |
Figure 8: Pseudo–second–order kinetic adsorption of alizarin red S using NH2–GO in the presence and absence of CTAB at 303 K. Click here to View figure |
The kinetic parameters for the dye adsorption of NH2–GO at 303 K calculated from Eqs. (6) and (7) are shown in Table 2. It is found that the pseudo–second order kinetic model can be applicable for the adsorption of ARS by NH2–GO in the absence of CTAB, because of its high correlation coefficient (R2 = 0.9993) associated with both qe,exp. And qe values of 36.17 and 37.31 mg/g, respectively. Furthermore, in the presence of CTAB both qe,exp. (45.15 mg/g) and qe (46.08 mg/g) are also higher difference with R2 = 0.9977. While, for the pseudo–first order kinetic model, the qe (10.11 mg/g) of NH2–GO in the presence of CTAB and the linear correlation coefficient (R2) of 0.9566 is not implied. Therefore, this dye adsorption fitted well with the pseudo–second–order kinetic model.
Table 2: Kinetic adsorption parameters of alizarin red S using NH2–GO in the presence and absence of CTAB at 303 K.
| Adsorbent | qe,exp (mg/g) | Pseudo-first order | Pseudo-second order | ||
| 36.17 | qe (mg/g) | 13.25 | qe(mg/g) | 37.31 | |
| NH2-GO | k1 (min) | 0.0309 | k2(g/mg.min) | 0.0125 | |
| R2 | 0.8698 | R2 | 0.9993 | ||
| 45.15 | qe (mg/g) | 10.11 | qe(mg/g) | 46.08 | |
| NH2-GO + CTAB | k1 (min) | 0.382 | k2(g/mg.min) | 0.0139 | |
| R2 | 0.9566 | R2 | 0.9977 | ||
Adsorption Mechanism and Adsorption Isotherm
In order to gain insight into both the mechanism and rate controlling step affecting the kinetics of adsorption, the intra–particle diffusion model was also applied to the kinetic experiment. The kinetic results were analyzed by the intra–particle diffusion model to elucidate the diffusion mechanism. The overall rate of adsorption can be described by the following three steps including (i) film or surface diffusion where the sorbate is transported from the bulk solution to the external surface of sorbent, (ii) intra–particle or pore diffusion, where sorbate molecules move into the interior of sorbent particles, and (iii) adsorption on the interior sites of the sorbent. The intra–particle diffusion model is expressed as following equation (8)14,20:
where, qt is the amount of alizarin red S adsorbed at an equilibrium (mg/g) at time t, C is the intercept and kp is the intra–particle diffusion rate constant in mg / (g min1/2). The values of kp and C of the intra–particle diffusion were calculated from slope and intercept of the plot (Fig. 9) of qtversus t1/2. If the linear plot goes through the origin, it reflects that the rate limiting step is only due to the intra–particle diffusion. On the other hand, the larger the intercept is obtained, the greater the contribution of the surface sorption in the rate–limiting step.
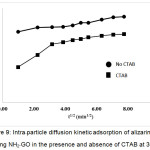 |
Figure 9: Intra–particle diffusion kinetic adsorption of alizarin red S using NH2–GO in the presence and absence of CTAB at 303 K. Click here to View figure |
Figure 9 shows the intra–particle diffusion for ARS adsorption using NH2–GO. The trend of the adsorption process is defined as two phases occurring during the adsorption process when using CTAB as a surface modifier compared with the other one in the absence of CTAB. The first portion is a transport of the dye molecules from the bulk solution onto the external surface of NH2–GO by diffusion through the boundary layer. The later one is the diffusion of the dye molecules from the external surface into the pores of the NH2–GO. The surface adsorption mechanism was predominantly occurred within 30 min contact time. Thereafter, the diffusion route became the rate–limiting step. The intra–particle diffusion rate constant kp (mg/g min1/2) was evaluated from the slope of the second linear part of the plotting of qt versus t1/2. As the plot did not pass through the origin, the intra–particle diffusion was not the only rate–limiting step. Thus, there were two processes control the adsorption rate but only one was the rate limiting in any particular time range. In addition, the intercept of the plot indicates the boundary layer effect. The value of C was high for NH2–GO resulting in more surface adsorption of the dye. Therefore, both surface adsorption and intra–particle diffusion mechanisms were simultaneously cooperated in the adsorption behaviors using this adsorbent.
For study of an adsorption isotherm, modeling of the sorption isotherm data is very important point of view for predicting and comparing the adsorption performance of the adsorbent behavior. Langmuir and Freundlich models are the most frequently used to describe the adsorption isotherms. Langmuir model assumes that a monolayer of an adsorbate is covered on a homogenous adsorbent surface containing a finite number of the adsorption sites via uniform strategies of adsorption with no transmigration of the adsorbate taking place along the plane of the surface. This model is based on these following basic assumptions including (i) the sorption takes place at specific homogeneous site within the adsorbent; (ii) once a dye molecule occupies a site; (iii) the adsorbent has a finite capacity for the adsorbate at equilibrium, and (iv) all site are identical and energetically equivalent.14 The linear form of the Langmuir isotherm is given by the following equation (9):
where, qm is the maximum amount of dye absorbed per unit weight of adsorbent (mg/g) to form a complete monolayer covering the surface at the equilibrium state of dye concentration (mg/L), qe is the amount of dye adsorbed per unit weight of adsorbent at equilibrium, and KL is the Langmuir constant (L/mg) related to the surface affinity for the dye.
The value of qe represents a practical limiting adsorption capacity when the surface is fully covered with the dye ions. The values of qm and KL are calculated from slope and intercept of the straight line plot of Ce/qe versus Ce (Fig. 10). In addition, the essential characteristics of Langmuir isotherm can be described by a separation factor (RL), which is given as depicted in equation (10)18:
The value of RL indicates the shape of Langmuir isotherm and nature of the adsorption process. It can give an idea about the nature of adsorption equilibrium: RL > 1.0 unfavorable sorption; RL = 1.0 linear sorption; RL < 1.0 favorable sorption and RL = 0 irreversible sorption.
On the other hand, Freundlich adsorption isotherm is also an equation that assumes a heterogeneous surface energy for which the energy terms in the Langmuir equation varies as a function of a surface coverage. The application of Freundlich equation suggests that the sorption energy exponentially decreases on completion of the sorption centers of an adsorbent. The logarithmic form of Freundlich adsorption isotherm is expressed by the following equation (11)20:

where, KF and n are Freundlich constant and the intensity of adsorption, respectively. The values of KF and 1/n can be obtained from a linear plot of log qe versus log Ce (Fig. 11). The 1/n value in the range of 0 and 1 is a predicting of adsorption intensity or surface heterogeneity, becoming more heterogeneous as its value gets closer to zero. In addition, the value of n varies with the heterogeneity of the adsorbent, if n < 10 and n > 1 indicating the adsorption process is favorable 14. Figure 10 and Fig. 11 show the fitting plots of both Langmuir adsorption and Freundlich adsorption of ARS using NH2–GO in the presence and absence of CTAB, respectively. The constant values obtained from both Langmuir and Freundlich adsorption isotherms and their correlation coefficients (R2) were calculated and are summarized in Table 3.
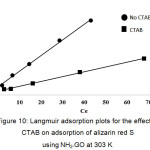 |
Figure 10: Langmuir adsorption plots for the effect of CTAB on adsorption of alizarin red S using NH2–GO at 303 K. Click here to View figure |
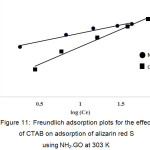 |
Figure 11: Freundlich adsorption plots for the effect of CTAB on adsorption of alizarin red S using NH2–GO at 303 K. Click here to View figure |
Table 3: Adsorption isotherm parameters obtained from the adsorption of alizarin red S using NH2–GO in the presence and absence of CTAB
| Adsorbent | Langmuir isotherm | Freundlich isotherm | ||||||
| qmax (mg/g) | KL | R2 | KF | 1/n | n | R2 | ||
| NH2-GO | 42.02 | 0.003 | 0.9979 | 10.48 | 0.362 | 2.76 | 0.9691 | |
| NH2-GO + CTAB | 135.1 | 0.120 | 0.9983 | 10.48 | 0.394 | 2.54 | 0.9049 | |
From Table 3, it can be concluded that for NH2–GO in the presence of CTAB, Freundlich isotherm (R2 > 0.9049) fitted with the experimental results comparable to Langmuir isotherm (R2 > 0.9983). The slope 1/n provides information about surface heterogeneity and surface affinity for the solute. If a higher value of 1/n is obtained, it corresponds to the greater heterogeneity of the adsorbent surface. Furthermore, the value of n > 1 obtained from Freundlich isotherm indicating that this process is also favorable and heterogeneous sorption. On the other hand, for NH2–GO in the absence of CTAB, it can be stated that Langmuir isotherm (R2 > 0.9979) fitted the experimental results better than those of Freundlich isotherm (R2 > 0.9691), reflecting the correlation coefficient, indicating the homogenous feature presented on the NH2–GO surface having no steric effect of CTAB structure and demonstrates the formation of monolayer coverage of the dye molecule on the NH2–GO surface. Moreover, the value of RL was between 0 and 1 (RL = 0.032). This also suggests favorably heterogeneous adsorption behaviors among NH2–GO and ARS simultaneously associated with strong ionic interactions of ARS and CTAB. The maximum adsorption capacities of the dye were found to be 42.02 and 135.1 mg/g for NH2–GO in the absence and presence of CTAB, respectively.
Conclusion
The adsorption study of amino-functionalized graphene oxide (NH2-GO) for alizarin red S (ASR) removal from aqueous solution is reported for the first time. Under the optimum conditions, the adsorption equilibrium state was rapidly completed within 60 min. The maximum adsorption capacity of NH2-GO in the presence of CTAB was found to be 135.1 mg/g, higher than that of NH2-GO in the absence of CTAB (42.0 mg/g). The adsorption kinetics well fitted using a pseudo second-order kinetic model. The intra-particle diffusion model was also discussed attributing the mechanisms and their adsorption behaviors. Thermodynamics was investigated, resulting that negative DG indicates spontaneity of the ongoing adsorption process. In addition, positive DH indicates that the dye adsorption using NH2–GO is an endothermic nature. The adsorption isotherms for NH2-GO in the presence of CTAB fit well with Freundlich model. It is, therefore, evident that NH2-GO can be used as a highly potential adsorbent for the anionic dye associated with cationic surface modifier like CTAB which can drastically enhance the adsorption capacity of the NH2–GO for such anionic dye removal from aqueous solution.
Acknowledgements
This research study was financially supported by Materials Chemistry Research Center, Department of Chemistry and Center of Excellence for Innovation in Chemistry (PERCH-CIC), Faculty of Science, Khon Kaen University, Khon Kaen, Thailand.
References
- Moriguchi, T.; Yano, K.; Kaji, A. J. Colloid Interf. Sci., 2003, 260, 19-25.
CrossRef - Jeremić, S.; Filipović, N.; Peulić, A.; Marković, Z. Computational Theoretical Chem., 2014, 1047, 15-21.
CrossRef - Gautam, R.K.; Mudhoo, A.; Chattopadhyaya, M.C. J. Environ. Chemical Engineer., 2013, 1, 1283-1291.
CrossRef - Ghaedi, M.; Hassanzadeh, A.; Kokhadan, S.N.J. J. Chem. Engineer. Data, 2011, 56, 2511-2520.
- Samusolomon, J.; Devaprasath, P.M. J. Chem. Pharm. Res., 2011, 3(5), 478-490.
CrossRef - Ahmad, R.; Kumar, R. Current World Environ., 2008, 3, 261-268.
CrossRef - Rehman, R.; Mahmud, T. Asian J. Chem., 2013, 25, 5351-5356.
CrossRef - Fan, L.; Zhange, Y.; Li, X.; Luo, C.; Lu, F.; Qiu, H. Col. Surf. B, 2012, 91, 1250-1257.
CrossRef - Rehman, R.; Mahmud, T.; Anwar J.; Salman, M.; Sharfique, U.; Zaman, W.Z.; Ali, F.J.J. Chem. Soci. Pakistan, 2011, 33(2), 228-232.
- Fu, F.; Gao, Z.; Gao, L.; Li, D. Ind. Engineer. Chem. Res., 2011, 50, 9712-9717.
CrossRef - Iqbal, M.J.; Ashiq, M.N. J. Hazardous Mat., 2007, 139, 57-66.
CrossRef - Raut, P.A.; Dutta, M.; Sengupta, S.; Basu, J.K. Indian J. Chem. Technol., 2013, 20, 15-20.
- Velasco, U.I.; Alanis, N.C.; Gonzalez-Marcos, M.P.; Alvarez-Uriarte, J.I. J. Chem. Engineer. Data, 2011, 56(5), 2100-2109.
CrossRef - Bradder, P.; Ling, S.K.; Wang, S.; Liu, S. J. Chem. Engineer. Data, 2011, 56, 138-141.
CrossRef - Lai, L.F.; Chen, L.W.; Zhan, D.; Sun, L.; Liu, J.P.; Lim, S.H.; Poh, C.K.; Shen, Z.X.; Lin, J.Y. Carbon, 2011, 49, 3250-3257.
CrossRef - Li, Y.; Du, Q.; Liu, T.; Peng, X.; Wang, J.; Sun, J.; Wang, Y.; Wu, S.; Wang, Z.; Xia, Y.; Xia, L. Chem. Engineer. Res. Design, 2013, 91, 361-368.
CrossRef - Nuengmatcha, P.; Mahachai, R.; Chanthai, S. Orient. J. Chem., 2014, 30,(2) 1463-1474.
CrossRef - Yan, H.; Tao, X.; Yang, Z.; Li, K.; Yang, H.; Li, A.; Cheng, R.J. J. Harzadous Mat., 2014, 268, 191-198.
- Sun, L.; Fugetsu, B. Chem. Engineer. J., 2014, 240, 565-573.
CrossRef - Ramesha, G.K.; Vijaya Kumara, A.; Muralidhara, H.B.; Sampath, S. J. Col. Interf. Sci., 2011, 361, 270-277.
CrossRef - Zhao, G.X.; Li, J.X.; Wang, X.G. Chem. Engineer. J., 2011, 173, 185-190.
CrossRef - Sun, L.; Yu, H.W.; Fugetsu, B. J. Hazardous Mat., 2012, 203, 101-110.
CrossRef - Xiaoyao, G.; Qin, W.; Bin, D.; Yakun, Z.; Xiaodong, X.; Liangguo, Y.; Haigin, Y. Desalination. Water Treat., 2015, 50, 818-825.
- Fatima, G.; Asad, M.K.; Syed, S.S.; Muhammad F.N. Soc. Dyers Colourists, 2010, 126, 109-113.
- Dogan, K.; Eda, A.; Sema, T.; Ferruh, E.; Mehmet, A.K.; Mustafa, T. J. Chem. Engineer. Data, 2007, 52, 2436-2441.
CrossRef - Minhong, X.; Jvxiang, W.; Jing, L.; Yunfeng, W. Inter. Conf. Chem., Mat. Food Engineer. (2015).
- Hummers, W.S.; Offeman, R.E. J. American Chem. Soc., 1958, 80, 1339.
CrossRef


![]()


