QSAR Studies of Lanosterol Synthase Inhibitors as Potential Antihypercholesterolemic Compounds
Divya G Nair1, V.L.Pushpa2, K. Kurien Thomas1 and K. B. Manoj2
1Department of Chemistry, Bishop Moore College, Mavelikara, Kerala-290110.
2Department of Chemistry, S N College, Kollam, Kerala.
Corresponding Author E-mail: drpushpavl@gmail.com
DOI : http://dx.doi.org/10.13005/ojc/330631
The QSAR analysis provides significant structural insight to help the design of novel antihypercholesterolemic compounds. 2D-QSAR model for a set of 23 LSS inhibitors that have antihypercholesterolemic activity was derived. The lanosterol synthase inhibitory activity data and various physicochemical descriptors were preferred as dependent and independent variables respectively. The Multiple Linear Regression (MLR) is taken to choose the best model. Here we have derived two best QSAR models to discuss the structural properties significant for the OSC inhibitory activity. In these models, the following parameters 3D- MoRSE parameter (Mor07e), WHIM parameter (G3e), GETAWAY parameter (R6p+), Radial Distribution Function parameters (RDF110u and RDF110e) have provided for the LSS inhibitory prediction. This structure activity relationship obtained for the molecule is comparable with the QSAR results and this agreed with the results developed from QSAR studies.
KEYWORDS:QSAR; Lanosterol synthase inhibitors; Physicochemical descriptors; MLR
Download this article as:| Copy the following to cite this article: Nair D. G, Pushpa V. L, Thomas K. K, Manoj K. B. QSAR Studies of Lanosterol Synthase Inhibitors as Potential Antihypercholesterolemic Compounds. Orient J Chem 2017;33(6). |
| Copy the following to cite this URL: Nair D. G, Pushpa V. L, Thomas K. K, Manoj K. B. QSAR Studies of Lanosterol Synthase Inhibitors as Potential Antihypercholesterolemic Compounds. Orient J Chem 2017;33(6). Available from: http://www.orientjchem.org/?p=40904 |
Introduction
The World Health Organization (WHO) reports that high cholesterol contributes to about 56% of cases of coronary heart disease (CHD) worldwide and causes more than 4 million deaths each year. High cholesterol (hypercholesterolemia) can cause the accumulation of plaque deposits in the arteries it results in atherosclerosis or CHD1. Atherosclerosis can lead to plaque ruptures and blockages in the arteries, which increase the risk for heart attacks, stroke, circulation problems and death2. Lanosterol synthase (LSS) is (EC 5.4.99.7) is an important enzyme in cholesterol biosynthesis as it functioned as catalyst for the conversion of 2, 3 – oxidosqualene to lanosterol, the first precursor for sterols. This enzyme locates the downstream from essential branching steps in the pathway of cholesterol synthesis and not influence the formation of intermediates needed for other biosynthetic pathways such as synthesis of isoprenoids, coenzyme Q10 etc3-9.
The study of the quantitative structure activity /property relationships (QSAR/QSPR) of compounds is a relevant approach of modern chemistry because of the details obtained is consists of mathematical equations correlating the chemical structure of the compounds to a large variety of their physical, chemical and biological properties. Once a relation between structure and activity/property is noticed, any number of compounds including those not synthesized yet, can quickly be screened in silico for searching of structures with derived properties10-21. Hence it is possible for the selection of most favorable structures for synthesis and testing in the laboratory. In this study, twenty three molecules having LSS inhibitory activity were taken from reference22.
Materials and Methods
QSAR study was performed on the data set consists of twenty three compounds having LSS inhibitory activity. The biological activity data IC50 (nm) were changed to pIC50 for QSAR analysis. The pIC50 values of the molecules under study covered a large range from 5 to 8. The chemical structure of all the compounds is shown in table 1, 2 and 3. The structure of the compounds was drawn and 3D structures were generated using Marvin 5.4.1.1 version (Chem Axon Ltd., 201023). Most stable structures of each compound was generated after energy minimization and used for calculating various physicochemical descriptors. The low energy conformers were then allowed for further generation of an extra set of 3,224 molecular descriptors using DRAGON version 5.524. The multi-collinear and redundant descriptors collected from the DRAGON software package were limited from 3,224 to 1497 descriptors by manually. The descriptors were then submitted for stepwise multiple linear regression (MLR) in order to choose suitable descriptors. Regression analysis has been made by the software Build QSAR25. The obtaining subset of molecular descriptors is consists of the 3D-MoRSE descriptors such as Mor07e (Signal 07/weighted by Sanderson electronegativity), Mor10e (Signal 10/weighted by Sanderson electronegativity), Mor20p (Signal 20/weighted by polarizability), WHIM descriptor such as G3e (3rd component symmetry directional WHIM index/ weighted by Sanderson electronegativity), GETAWAY descriptor such as R6p+ (R- maximal auto-correlation of lag 6/ weighted by polarisability),Connectivity Indices such as X5A (average connectivity index of order 5), Radial Distribution Function descriptors such as RDF110u (Radial Distribution Function-110/unweighted) and RDF110e (Radial Distribution Function-110/ weighted by Sanderson electronegativity)26-32.The biological activity and the selected physicochemical parameters of the twenty three LSS inhibitors were shown in table 4. Since we have used a cross-validation method there is no requirement to work on training set and test set independently.
Results and Discussion
The relevance of QSAR analysis mainly relates either or not the molecular descriptors selected are suitable to correlate the biological activity. Regression analysis was carried out by maximum R2 method33 choosing stepwise regression. Univariate, bivariate to multivariate regression has been made for understanding the best correlation. The eight selected molecular descriptors were then taken in the formation of QSAR model by MLR. The correlation of the used descriptors and their correlation with the activity are shown in table 5. The results (Table 5) indicate that the two physicochemical descriptors RDF110u and RDF110e are mutually correlated. When these two are exist together in the regression equation then the model may undergo from the defect due to collinearity34, 35. The outcomes of the statistically relevant models are shown in table 6. There is no statistically important mono parametric model is preferred for modeling the LSS inhibitory activity (pIC50). In attaining the statistically significant models, the corresponding 5, 13 and 15 are found to be outliers. Therefore they were removed from the successive regression analysis.
The results shown in Table 6 indicate that there are six bi-parametric regression models out of which the model 5 consists of Mor07e and G3e provide the maximum R2 result. This model is found as shown below.
pIC50 = –0.7825 (± 0.1251) Mor07e + 24.0892 (± 7.3506) G3e+ 5.7841
n = 20, Se = 0.4012, R = 0.8597, F = 24.0672, Q = 2.1426 (1)
From the two better quality tri parametric models, the model 11 consists of Mor07e, G3e and R6p+ provides better results. Mor07e and R6p+ parameters indicate negative correlation and G3e parameter indicates positive correlation with the activity.
pIC50 = –0.8242(± 9.1836 x 10⁻²) Mor07e + 27.8881 (± 5.4437) G3e –
56.6141 (± 14.1663) R6p+ + 6.1817
n = 20, Se = 0.2926, R = 0.9324, F = 35.4984, Q = 3.1869 (2)
The stepwise regression finally obtained two tetra parametric models 21 and 22, possessing better statistics than both the models discussed earlier. The two models differ only due to the presence of RDF110u and RDF 110e. But the remaining descriptors are same for both the models. These two models were then analyzed for obtaining the relative correlation potential of RDF110u and RDF110e, in modeling the activity. RDF110u and RDF110e are highly correlated descriptors (r = 0.9911). Therefore the tetra parametric model 22 [equ (4)] containing Mor07e, G3e, R6p+ and RDF110u is best for modeling the inhibitory activity. The other tetra parametric model 21 [equ (3)] containing almost equal correlation potential consists of RDF110e in space of RDF110u. These two models are showed below.
pIC50 = –0.8482(± 7.3092 x 10⁻²) Mor07e + 27.2749 (± 4.3146) G3e –
71.3508 (± 12.1026) R6p+ – 7.6470 x 10⁻² (± 2.3578 x 10⁻²) RDF110e + 7.5748
n = 20, Se = 0.2317, R = 0.9608, F = 45.0928, Q = 4.1476 (3)
pIC50 = –0.8288(± 7.2409 x 10⁻²) Mor07e + 27.1340 (± 4.2976) G3e –
69.7369 (± 11.8635) R6p+ – 7.3823 x 10⁻² (± 2.2520 x 10⁻²) RDF110u + 7.4821
n = 20, Se = 0.2306, R = 0.9612, F = 45.5277, Q = 4.1675 (4)
In order to support our study we have calculated the pIC50 activity from the model 22, [equ (4)] which is explained above. The calculated activities are then compared with observed values (Table 8).
In order to confirm the inhibitory potential of the selected models, we have again calculated their predictive correlation coefficient (R2 pred.)33-35 by plotting graph between observed and predicted pIC50 values by equation 4. Such correlations are provided in figure 1. From figure 1, the R2 value is obtained as 0.9239 for the model showed by equation 4. This further support that the model obtained from equation 4 has the best predictive power also.
Finally a cross-validation method33, 35 is applied for deciding the predictive potential of the suggested model. This is required because a model with well-defined statistics may not have good predictive power. The different cross–validation parameters obtained for the recommended models are listed in table 9 and are explained below.
PRESS (Predictive Residual Sum of Squares) value less than the SSY (Sum of the Squares of response value) provide that the model predicts better than chance and can be treated as statistically significant. In this case (Table 9) PRESS << SSY show that all the models obtained are statistically important and are better than chance. To be a potential QSAR model, the ratio PRESS/SSY should be smaller than 0.4. Here this ratio ranges between 0.08-0.36 showing that all the selected models are reliable QASR models. In this case, the ratio for the models obtained by equation 4 is the smallest. Therefore we summarized that this model is the best among all the models discussed above. The highest value R2cv (0.9176) provide further strength to our findings.
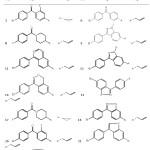 |
Table 1: The chemical structure of compounds containing the parent structure A Click here to View table |
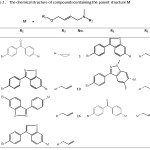 |
Table 2: The chemical structure of compounds containing the parent structure M Click here to View table |
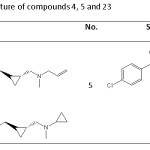 |
Table 3: The chemical structure of compounds 4, 5 and 23 Click here to View table |
 |
Tale 4: The biological activity and the selected physicochemical parameters of the twenty three LSS inhibitors Click here to View table |
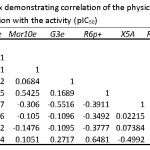 |
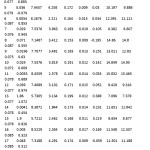
Table 5: Correlation matrix demonstrating correlation of the physicochemical parameters and their correlation with the activity (pIC50) Click here to View table |
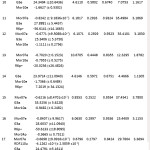 |
Table 6: Regression parameters and quality of the proposed models Click here to View table |
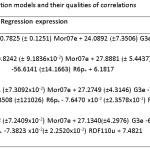 |
Table 7: Various correlation models and their qualities of correlations Click here to View table |
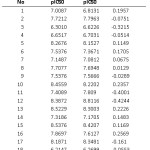 |
Table 8: Observed and predicted pIC50 values using model-22 Click here to View table |
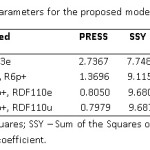 |
Table 9: Cross-validation parameters for the proposed models Click here to View table |
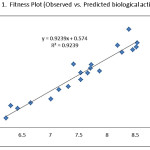 |
Figure 1: Fitness Plot (Observed vs. Predicted biological activity) Click here to View figure |
Conclusion
The positive correlation coefficient of G3e indicates that there is a direct relationship with LSS inhibitory activity of these compounds. The negative correlation coefficient of Mor07e, G3e, R6p+ and RDF110u indicate that there is an inverse relationship with LSS inhibitory activity of these compounds. MoRSE descriptors (here Mor07e) provides a good model performance when the changes in activity correlates with changes in interatomic distances due to variation in bond order and introduction of new atoms. WHIM descriptors (here G3e) gave significant 3D molecular information such as molecular size, shape, symmetry and atom distribution with respect to invariant reference frames. GETAWAY (here R6p+) are geometrical descriptors providing information of the effective position of substituents and fragments in the molecular shape. RDF code (here RDF110u) gave information regarding interatomic distances in the whole molecule, bond distances, ring types, planar and non-planar systems and atom types.
From these findings, if the count of number of carbon atoms separated from electronegative oxygen atom to charged polar amino group by six bond increases then LSS inhibitory activity of these molecules also increases. The bond angle and bond distances of these carbon atoms, the polar electronegative atoms and aromatic and substituted aromatic rings plays a significant role in LSS inhibitory activity. These findings can be useful in the development and optimization of new LSS inhibitors.
References
- World Health Organization. The World Health Report 2002. Geneva, Switzerland: WHO, 2002.
- Gupta,R.; Gupta,S.; Sharma,K.K.; Gupta,A.; Deedwania,P.; World. J. Cardiol. 2012, 4, 112-120.
CrossRef - Morand,O.H.; Aebi,J.D.; Dehmlow,H.;Ji,Y.H.;Gains,N.;Lengsfeld,H.;Himber,J. J. Lipid Res. 1997, 38, 373-390.
- Lenhart.A.; Reinert,D.J.; Aebi,J.D.; Dehmlow,H.; Morand,O.H.; Hegele,R.A.; Huff,M.W. Cir.Res. 2003, 93,717-725.
- Mark,M.; Muller,P.; Maier,R.; Eisele,B. J.Lipid Res. 1996, 37,148-158.
- Eisele,B.; Budzinski,R.; Muller,P.; Mark,M. J.Lipid Res. 1997, 38, 564-575.
- Dollis,D.; Schuber,F. Biochem. Pharmacol. 1994, 48, 49-57.
CrossRef - Peffley,D.M.; Gayen,A.K.; Morand,O.H. Biochem. Pharmacol. 1998, 56, 439-449.
CrossRef - Gardner,R.G.; Shan,H.; Matsuda,S.P.T.; Hampton,R.Y. J.Biol.Chem. 2001, 276, 8681-8694.
CrossRef - Hansch,C.; Leo,A.; Hoekman,D. J.Am.Chem.Soc. 1995, 117, 9782.
CrossRef - Karelson,M.; Lobonov,V.S.; Katrizky,A.R. Chem.Rev. 1996, 96, 1027-1043.
CrossRef - Devillers,J.; Balaban,A.T. Topological Indices and Related Descriptors in QSAR and QSPR, Gordon & Breach: Williston, VT, 2000.
- Todeschini,R.; Cosonni,V. Handbook of Molecular Descriptors Wiley-VCH: Weinheim 2000.
CrossRef - Karelson,M. Molecular Descriptors in QSAR/QSPR, Wiley: New York, 2000.
- Gutman, I. Graph Theory Notes, New York, 1994, 27, 9.
- Weiner,H. J.Am. Chem. Soc. 1947, 69, 17.
CrossRef - Diudea,M.V. (Ed) QSPR/QSAR Studies by Molecular Descriptors, Babes-Bolyai University, Cluj, Romania, 2000.
- Balaban,A.T. Chem. Phys. Lett. 1982, 89, 399.
CrossRef - Khadikar,P.V.; Deshpande,N.V.; Kale,P.P.; Dobrynin,A.; Gutman,I.; Domotor,G. J. Chem. Inf. Comput. Sci. 1995, 35, 547.
CrossRef - Randic,M. J. Am. Chem. Soc. 1975, 97, 6609.
CrossRef - Basak,S.C.; Mills.D. Commun. Math. Chem. (MATCH) 2001, 44, 15.
- Henrietta,D.; Johannes,D.A.; Synese,J.; YuHua, Ji.; Elisabeth,M.V.M.; Jacques,H.; Oliver,H.M. J.Med.Chem.2003,46,3354-3370.
- Chem Axon Ltd. Marvin Sketch, version 5.4.Budapest,Hungary 2010.
- Talete srl. DRAGON for windows (Software for Molecular Descriptor Calculations), Version 5.5. Milano, Italy: Talete srl., 2007.
- De Oliveira, D.B.; Gaudio, A. C.; BuildQSAR: A New Computer Program for QSAR Analysis. Quant. Struct.-Activ. Relat. 2001, 19, 599-601.
CrossRef - Schuur,J.H.; Selzer,P.; Gasteiger,J. J. Chem. Inf. Comput. Sci. 1996, 36, 334-344.
CrossRef - Gasteiger,J.; Sadowski,J.; Schuur,J.H.; Selzer,P.; Steinhauer,L.; Steinhauer,V. J. Chem. Inf. Comput. Sci. 1996, 36, 1030-1037.
CrossRef - Todeschini,R.; Lasagni,M.; Marengo,E. J. Chemom. 1994, 8, 263–273.
CrossRef - Todeschini,R.; Gramatica,P. 3D QSAR in Drug Design – Vol. 2, H. Kubinyi, G. Folkers, Y. C. Martin (Eds.), Kluwer/ESCOM, Dordrecht (The Netherlands), 1998, 355–380.
- Consonni,V.; Todeschini,R.; Pavan,M.; Gramatica,P. J. Chem. Inf. Comput. Sci. 2002, 42, 693–705.
CrossRef - Schuur,J.; Gasteiger,J. Anal. Chem. 1997, 69, 2398–2405.
CrossRef - Hemmer,M.C.; Steinhauer,V.; Gasteiger,J. Vibrat. Spect. 1999, 19, 151–164.
CrossRef - Chaterjee,S.; Hadi,A.S.; Price, B. Regression Analysis by Examples, 3rd Ed. Wiley: New York, 2000.
- Pogliani,L. J. Phys. Chem. 1996, 100, 18065.
CrossRef - Pogliani,L. Amino Acids, 1994, 6, 141.
CrossRef

This work is licensed under a Creative Commons Attribution 4.0 International License.
![]()
A New Edition of Web of Science
Journal Impact Factor
2022: 0.5
Five Year: 0.8
Journal is Indexed in

Cabells Whitelist
![]()


