Effect of Milling on Physicochemical Properties of Usnic Acid Isolated from Usnea sp.
Erizal Zaini1 , Rahmita Khairun Nisak1, Rany Dwi Utami1, Lili Fitriani1 and Friardi Ismed2
1Department of Pharmaceutics, Faculty of Pharmacy, Andalas University, Padang, 25163.
2The Laboratory of Natural Resource of Sumatra (LBS) and Faculty of Pharmacy Andalas University, Padang, 25163.
Corresponding Author E-mail: erizal.ffua@gmail.com
DOI : http://dx.doi.org/10.13005/ojc/330641
Article Received on :
Article Accepted on :
Article Published : 05 Dec 2017
Usnic acid is the secondary metabolite found in lichens, particularly Usnea sp which has considerable pharmacological activities. However, the used of usnic acid is still limited due to poorly soluble in water. The aim of this study was to investigate the impact of milling process to physicochemical properties of usnic acid. Usnic acid was isolated from Usnea sp by soxhlet extraction method. The crystal of usnic acid was then milled in three different times: 30, 60 and 90 minutes. The characterization of intact and milled usnic acid were conducted using powder X-ray diffraction (PXRD), infra-red spectroscopy, differential scanning calorimetry (DSC), and scanning electron microscopy (SEM). Solubility test was conducted in water for 24 hours and the amount of usnic acid was determined by UV spectrophotometry. The X-ray diffractogram showed a decline in peak intensity of usnic acid after milling process. The infra-red spectrum showed no shift of wavenumber of usnic acid after milling process. Thermal analysis showed a decline in melting point and heat energy of usnic acid after milling process. The photomicrograph of SEM depicted the changes in habit crystal of milled usnic acid. The solubility of intact usnic acid was 51µg/ml, while the milled usnic acid increased fourfold compared to intact usnic acid. There was no significant difference of milling time on solubility (p>0.05). In conclusion, the milling process influence the physicochemical properties of usnic acid which indicated by crystallinity, melting point, crystal habit and solubility.
KEYWORDS:usnic acid; Usnea sp; isolation; milling; solubility
Download this article as:| Copy the following to cite this article: Zaini E, Nisak R. K, Utami R. D, Fitriani L, Ismed F. Effect of Milling on Physicochemical Properties of Usnic Acid Isolated from Usnea sp. Orient J Chem 2017;33(6). |
| Copy the following to cite this URL: Zaini E, Nisak R. K, Utami R. D, Fitriani L, Ismed F. Effect of Milling on Physicochemical Properties of Usnic Acid Isolated from Usnea sp. Orient J Chem 2017;33(6). Available from: http://www.orientjchem.org/?p=40511 |
Introduction
Usnic acid is the secondary metabolites found in lichen (crust moss), one of them in the Usnea sp. Usnea sp is commonly found in the mountains, high altitude and lowland with high humidity. Lichen and extracts containing usnic acid can be used as medicine, fragrance, and cosmetics. The pharmacological activities of usnic acid are anti-bacterial and anti-microorganism1, antivirus2, analgesic and antipyretic3, anti-inflammation4,5, anti-oxidant6, and anti-proliferation7. The nature characteristic of usnic acid which is poorly soluble in water causes the use of usnic acid is limited. Usnic acid is practically insoluble in water, but soluble in: 0.77 g in 100 ml acetone, 0.88 g in 100 ml ethyl acetate and 1.21 g in ethanol, respectively8.
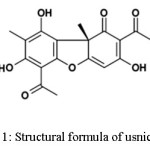 |
Figure 1: Structural formula of usnic acid Click here to View figure |
Studies have been conducted in order to increase solubility usnic acid included using Poly Lactic-co-Glycolic Acid (PLGA) by preparing microencapsulation which the solubility enhance 21 fold9 and forming inclusion complex with β-cyclodextrine that enhance usnic acid solubility about 23 fold10. Another method that can enhance the solubility is by milling method. Milling process is generally known as a top-down process that able to break down particles physically into fine particles by supplying mechanical energy on the powders. This process is still a considerable method to modify the properties of powder. Previous studies have shown the impact of milling on the solubility of efavirenz and sulfamethoxazole11,12.
Therefore, this study was conducted in order to investigate the effect of milling process to alter the physicochemical properties of usnic acid that isolated from Usnea sp. The impact of milling process was evaluated by powder X-ray diffraction (PXRD), infra-red spectroscopy, differential scanning calorimetry (DSC), scanning electron microscope (SEM) and solubility test.
Experimental
Materials
Usnea sp was collected from Mt. Singgalang (altitude 2100 m), West Sumatra, n-hexane (Bratachem, Indonesia), ethyl acetate (Bratachem, Indonesia), chloroform (Merck, Germany), and distilled water.
Isolation of usnic acid
Approximately 800 g Usnea sp was sorted and crushed to be extracted by soxhlet method using 2.5 L of n-hexane. The extract then was evaporated using a rotary evaporator. Recrystallization process was done using a mixture of ethyl acetate and n-hexane. The usnic acid crystal was kept in a desiccator.
Preparation of milled usnic acid
The isolated crystal of usnic acid about 1 g was milled in vibration ball milling apparatus (RETSCH Type PM 100, Germany) at 500 rpm. The milling process was done in three different times: 30, 60, and 90 minutes. Then the milled usnic acid was kept in a desiccator.
Powder X-ray diffraction (PXRD) analysis
Analysis of usnic acid crystallinity was done using powder X-ray diffractometer (PAN analytical PW 30/40 X-ray diffractometer, the Netherlands). A small amount of sample was placed on the sample holder and the analysis was performed at 2ϴ in a range of 5 – 40°. Prior to measurement, the diffractometer was set as follow: target metals Cu, Kα filter, voltage 45 kV, and current 40 mA at room temperature. Measurement was done for intact usnic acid and usnic acid after milling process.
FT-Infra-red Spectroscopy analysis
The infra-red spectroscopy analysis was done using a spectrophotometer (Perkin Elmer FT-IR, the USA). The absorption of usnic acid samples was recorded at wavenumber 4000 – 600 cm-1. The analysis was done for usnic acid and usnic acid after milling process at three different times.
Differential Scanning Calorimetry (DSC) analysis
Thermal analysis of usnic acid and milled usnic acid in different times was done using a differential scanning calorimetry apparatus (SETARAM Type EVO-131, France), which calibrated using Indium. A small amount of samples was put in an aluminum pan and the temperature of measurement was set 30 – 250°C with a flow heat 10°C/minute.
Scanning Electron Microscopy (SEM) analysis
The surface morphology of usnic acid and milled usnic acid was done using a SEM device (HITACHI type S-3400N, Japan) at several magnifications. Samples were placed on an aluminum sample holder and the device was set as the following condition: the voltage was set at 10 kV and current 12 mA.
Solubility test
The solubility test of usnic acid and usnic acid after milling process was done in a water bath shaker for 24 hours at room temperature. An excessive amount of samples was added in a 100 mL of free carbon dioxide distilled water and the samples were filtered using Whatman filter paper. The amount of usnic acid dissolved was measured by UV spectrophotometer (Shimadzu UV-1700, Japan) at 283 nm (λmax) of usnic acid.
Statistical Analysis
The effect of milling at different milling times on the solubility of usnic acid was analyzed using t-test student.
Result and Discussion
Milling, also known as “top-down” approach, is a mechanical process that able to break down particles and to defect crystal powders which alter the physicochemical properties. The defect of powders can contribute to the decreasing in crystallinity. Moreover, milling also able to transform crystal phase into partially amorphous and/or amorphous phase. This transformation can be observed by X-ray diffraction analysis. The amorphous phase as a result of milling process has a remarkable higher solubility compared to its crystalline phase13,14. Depend on the great of mechanical energy supplied, milling is able to defect, disorder or disappear of atoms or molecules position in crystalline phase15.
Powder X-ray diffraction is a principal method to quantify the crystallinity of materials16. The diffractogram of usnic acid and milled usnic acid is shown in Figure 2. Usnic acid and milled usnic acid have the same pattern in diffractogram. Usnic acid shows a sharp peaks as the characteristic of crystalline form. However, the peak intensity of milled usnic acid decreased as a consequence of milling process which can be seen in Table 1. The specific peak intensity of usnic acid was at 10.3° of 2ϴ position. The height of peak intensity of usnic acid was 47,000.43, while the usnic acid after milling at three different times was in a range of 3,700 – 4,500. This result indicated significant decrease of crystallinity.
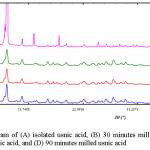 |
Figure 2: Diffractogram of (A) isolated usnic acid, (B) 30 minutes milled usnic acid, (C) 60 minutes milled usnic acid, and (D) 90 minutes milled usnic acid Click here to View figure |
Table 1: Peak intensity of usnic acid
|
Sampels |
Position [°2Theta.] |
d-spacing [Å] |
Height [cts] |
| Usnic acid |
10.3703 |
8.53051 |
47,004.43 |
| Usnic acid milled 30 minutes |
10.2404 |
8.63837 |
3,911.29 |
| Usnic acid milled 60 minutes |
10.2414 |
8.63751 |
3,779.52 |
| Usnic acid milled 90 minutes |
10.2597 |
8.62218 |
4,505.37 |
Infra-red spectrum of usnic acid and milled usnic acid is shown in Figure 3. The spectrum shows similar pattern of functional groups which indicated no new compound formed during milling process. Fingerprint area at 1500-500 cm-1 which used to identify intact sample and after modification shows no transition. At wavenumber 1700-1600 cm-1 shows alkene groups and 2000-1650cm-1 shows aromatic groups from usnic acid and milled usnic acid. In addition, O-H bond form Ar-OH is depicted at wavenumber 3700-3400cm-1 and hydroxyl phenolic groups at 3150 cm−1 for usnic acid and usnic acid after milling process. These indicated no shift of wavenumbers after milling process. This result was anticipated as milling is a physical process that will not induce new compound or functional groups that also in accordance with result as shown in x-ray diffractogram, previously17.
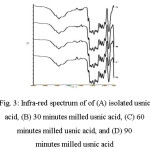 |
Figure 3: Infra-red spectrum of of (A) isolated usnic acid, (B) 30 minutes milled usnic acid, (C) 60 minutes milled usnic acid, and (D) 90 minutes milled usnic acid Click here to View figure |
DSC is a general thermal analysis method that can be used to characterize thermal behavior of powder before and after modification which shows the exothermic or endothermic peaks and the heat energy to melt18. The result of usnic acid thermal analysis can be seen in Figure 4. According to the thermogram, there are sharp endothermic peaks which are the melting temperature of usnic acid at 207.1°C and usnic milled acid at 204.2°C. In addition, the heat energy of usnic acid was 72.29 J/g and milled usnic acid was 65.47 J/g. Declining in melting point of usnic acid after milling process was likely due to the decrease in crystalinity of usnic acid as also shown in diffractogram. Moreover, defect on crystal lattice after milling process contributes to the energy needed to melt the usnic acid, which the milled usnic acid required lower energy compared to intact usnic acid18.
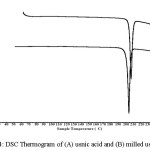 |
Figure 4: DSC Thermogram of (A) usnic acid and (B) milled usnic acid Click here to View figure |
The result of scanning electron microscopy of usnic acid and milled usnic acid at different magnifications is presented in Figure 5. It can be seen that the isolated usnic acid looks like rod, while the usnic acid after milling process was irregular and smaller in particles size. The changes in surface morphology of usnic acid was apparently caused by the milling process. Apart from the changes in the crystal lattice, the milling process also affected on the morphology and surface roughness which contributes to the solubility15.
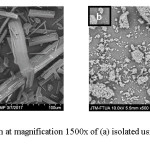 |
Figure 5: Photomicrograph at magnification 1500x of (a) isolated usic acid, and (b) usnic acid after milling Click here to View figure |
The result of solubility test can be seen in Table 2. The solubility of usnic acid increased significantly after milling process (p<0.05), meanwhile milling time to the solubility of usnic acid did not influence significantly (p>0.05). This result was in accordance with the result in the x-ray diffractogram, thermal analysis and electron microscopy where the decrease in the peak intensity and the melting point, and the changes in the morphology were able to increase the solubility of usnic acid. The mechanism in increasing solubility of milled usnic acid was allegedly due to the transformation phase from higher crystalline to lower one11,19.
Table 2: Solubility of usnic acid
| Samples |
Solubility (μg/100 ml ±SD) |
| Usnic acid |
51a±0.001 |
| Usnic acid milled 30 minutes |
223b±0.004 |
| Usnic acid milled 60 minutes |
223b±0.004 |
| Usnic acid milled 90 minutes |
221b±0.005 |
Means followed by the same letter in the column do not differ statistically at 0.05 probability level
Conclusion
Milling process is able to decrease crystallinity of usnic acid which contributes to increase the solubility in water and the variation of milling time does not influence the solubility result.
Acknowledgement
This research is granted by Directorate of Research and Community services, Ministry of Research Technology, and Higher Education and Institute for Research and Community services of Andalas University for PUPT Grant Program in 2017.
References
- Madamombe, I. T.; and Afolayan, A. J. Pharm. Biol, 2003, 41(3), 199-202.
CrossRef - Sokolov, D. N.; Zarubaev, V. V.; Shtro, A. A.; Polovinka, M. P.; Luzina, O. A.; Komarova, N. I.; and Kiselev, O. I. Bioorganic Med. Chem. Lett., 2012, 22(23), 7060-7064.
CrossRef - Okuyama, E.; Umeyama, K.; Yamazaki, M.; Kinoshita, Y.; and Yamamoto, Y. Planta Med, 1995, 61(02), 113-115.
CrossRef - Vijayakumar, C. S.; Viswanathan, S.; Reddy, M. K.; Parvathavarthini, S.; Kundu, A. B.; and Sukumar, E. Fitoterapia, 2000, 71(5), 564-566.
CrossRef - Huang, Z.; Zheng, G.; Tao, J.; and Ruan, J. J Wuhan Univ Technol, 2011, 26(5), 955-959.
CrossRef - Behera, B. C.; Verma, N.; Sonone, A.; and Makhija, U. Biotechnol Lett, 2005, 27(14), 991-995.
CrossRef - Campanella, L.; Delfini, M.; Ercole, P.; Iacoangeli, A.; and Risuleo, G. Biochimie, 2002, 84(4), 329-334.
CrossRef - Jin, J. Q.; Rao, Y.; Bian, X. L.; and Zeng, A. G. J Solution Chem, 2013, 42(5), 1018-1027.
CrossRef - Ribeiro-Costa, R. M.; Alves, A. J.; Santos, N. P.; Nascimento, S. C.; Gonçalves, E. C.; Silva, N. H.; and Santos-Magalhães, N. S. J Microencapsul, 2004, 21(4), 371-384.
CrossRef - Nikolić, V.; Stanković, M.; Nikolić, L.; Nikolić, G.; Ilić-Stojanović, S.; Popsavin, M.; and Kundaković, T. J Incl Phenom Macrocycl Chem, 2013, 76(1-2), 173-182.
CrossRef - Zaini, E.; Wahyu, D.; Octavia, M. D.; and Fitriani, L. J Pharm Bioall Sci, 2017, 9(1), 22.
CrossRef - Erizal, Cahyati S.Y.; Soewandhi, S.N.; and Halim, A. Int J Pharmacol, 2008, 4,140-4.
- Hancock, B. C., and Parks, M. Pharm Res, 2000, 17(4), 397-404.
CrossRef - Babu, N.J. and Nangia, A., Cryst. Growth Des, 2011, 11(7), pp.2662-2679.
CrossRef - Loh, Z. H.; Samanta, A. K.; and Heng, P. W. S. Asian J. Pharm. Sci, 2015, 10(4), 255-274.
- Shah, B.; Kakumanu, V. K.; and Bansal, A. K. J. Pharm. Sci., 2006, 95(8), 1641-1665.
CrossRef - Zaini, E.; Fitriani, L.; Effendy, S.; Noviza, D.; and Halim, A. Orient J. Chem., 2017, 33(2), 873-878.
- Putra, O.D.; Yonemochi, E.; and Uekusa, H. Cryst. Growth Des. 2016, 16(11), 6568-6573.
CrossRef - Mura, P.; Cirri, M.; Faucci, M. T.; Ginès-Dorado, J. M.; and Bettinetti, G. P. J Pharm Biomed Anal, 2002, 30(2), 227-237.
CrossRef

This work is licensed under a Creative Commons Attribution 4.0 International License.
![]()
A New Edition of Web of Science
Journal Impact Factor
2022: 0.5
Five Year: 0.8
Journal is Indexed in

Cabells Whitelist
![]()


