Determination of Related Substances in Cabazitaxel using Reverse Phase- Liquid Chromatography Method
Department of Chemistry, GITAM University, Gandhi Nagar, Rushikonda, Visakhapatnam-530045, Andhra Pradesh, India.
Corresponding Author E-mail: bavirddim5@gmail.com
DOI : http://dx.doi.org/10.13005/ojc/330633
Download this article as:
![]()
The present paper describes the reverse phase- high performance liquid chromatographic method and was validated as per ICH guidelines for the determination of related substances in Cabazitaxel. RP-Liquid chromatography technique was performed with pH 3.0 phosphate buffer and acetonitrile as mobile phase at a flow rate of 0.8 mL/min on Waters 2489 UV 2695 pump, Waters 2998 PDA 2695 pump Software Empower2 photodiode array detector using Zorbax SB C18 column with UV detection at 220 nm. Linearity was observed in the concentration range of Cabazitaxel LOQ–0.10% (R2 = 0.9998), the concentration range of CBZM01 impurity 0.03–0.225% (R2 = 0.9997), the concentration range of CBZM02 impurity 0.03–0.225% (R2 = 0.9997), the concentration range of CBZN09 impurity 0.03–0.225% (R2 = 0.9998). Limit of detection (%) and the limit of quantitation (ng/mL) were found to be CBZM01 impurity 0.002% and 73ng/mL, CBZM02 impurity 0.002% and 71ng/mL, CBZN09 impurity 0.002% and 6ng/mL and Cabazitaxel 0.002% and 0.008% respectively. The percent recovery was in good agreement with the labeled amount in the dosage forms and hence, the method is specific, simple, reproducible and accurate for the determination of Cabazitaxel.
KEYWORDS:Cabazitaxel; estimation of related substances; liquid chromatography; percent recovery and dosage forms
Introduction
Cabazitaxel(CBT)(Figure 1.1) was a taxane group chemotherapy drug which is used to treat advanced hormone-refractory prostate cancer[1].The IUPAC name of Cabazitaxel was 1S,2S,3R,4S,7R,9S,10S,12R,15S)-4-(Acetyloxy)-15-{[(2R,3S)-3-{[(tert-butoxy) carbonyl]amino}-2-hydroxy-3-phenylpropanoyl]oxy}-1-hydroxy-9,12-dimethoxy-10,14,17,17-tetramethyl-11-oxo-6-oxatetracyclo[11.3.1.03,10.04,7]heptadec-13-en-2-yl benzoate. CBZ was approved by EMA [2] and USFDA [3] for the treatment metastatic prostate cancer [4-5] in combination with prednisone. Existing bibliographic survey reveals that very few analytical methods have been reported for the determination of Cabazitaxel using Spectrophotometry[6], HPLC[7-10], and LC-MS/MS[11-13]. Cabazitaxel is not official in any pharmacopoeia and there is no monograph containing methods to determine the Cabazitaxel. Literature survey gives the information on CBZ that there is not even a single method was reported for the determination of related substances in CBZ. Hence, the author was aimed to develop simple, fast and cost effective reverse phase-liquid chromatography method for the determination of related substances in Cabazitaxel and was validated. Chemical structures of related substances of Cabazitaxel such as CBZM01, CBZM02 and CBZM09 were presented in the Figure 1.2-1.4.
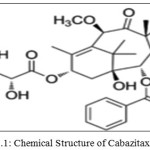 |
Figure: 1.1: Chemical Structure of Cabazitaxel (CBT) |
Chemical structures of related substances
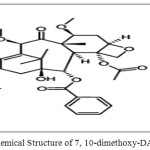 |
Figure: 1.2: Chemical Structure of 7, 10-dimethoxy-DAB (CBZM01) |
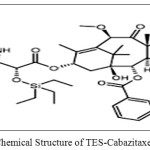 |
Figure: 1.3: Chemical Structure of TES-Cabazitaxel (CBZM02) |
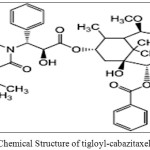 |
Figure: 1.4: Chemical Structure of tigloyl-cabazitaxel (CBZN09)Click here to View figure |
Experimental
Instrumentation and chromatographic conditions
Chromatographic separation was achieved by using a Waters 2489 UV 2695 pump, Waters 2998 PDA 2695 pump Software Empower2 photodiode array detector using Zorbax SB C18 (100mm×3.0mm, 1.8µm particle size) column with eluent-A: phosphate buffer eluent-B: acetonitrile as mobile phase at a flow rate of 0.8 mL/min. with UV detection at 220 nm. Column maintained at temperature 40ºC, sample temperature 10ºC. The overall run time was 22 min. and the flow rate was 0.8 mL/min. 3µL of sample was injected into the HPLC system.
Chemicals used
Orthophosphoric acid, Acetonitrile HPLC grade and water were obtained from Merck,India. All chemicals were of an analytical grade and used as received.
Preparation of mobile phase-A
1mL of H3PO4 is added to 1000mL of water and the solution is properly mixed. Filtered through 0.45µ membrane filter paper and degassed.
Preparation of mobile phase-B
Acetonitrile used as mobile phase-B.
Preparation of Diluent
600mL Acetonitrile and 400mL water are mixed to prepare one litre of diluents and the solution is properly mixed.
Method Validation
Specificity
Solutions of CBZM01 impurity, CBZM02 impurity, CBZN09 impurity, and Cabazitaxel each individually prepared and analysed. A spiked solution of each potential impurity to the Cabazitaxel drug substance and analyzed. Analysis was performed by PDA detector and peak purity was determined. Specificity chromatograms of blank, CBZM01,CBZM02,CBZM09 and spiked solution were shown in Figure 1.5-1.9.
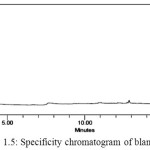 |
Figure 1.5: Specificity chromatogram of blank solution |
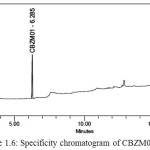 |
Figure 1.6: Specificity chromatogram of CBZM01 solution |
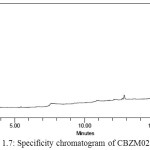 |
Figure 1.7: Specificity chromatogram of CBZM02 solution |
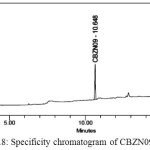 |
Figure 1.8: Specificity chromatogram of CBZN09 solution |
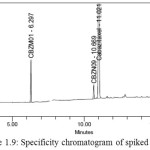 |
Figure 1.9: Specificity chromatogram of spiked solution |
Table 1.1: Summary of retention time, and relative retention time for known impurities
|
Peak Name |
Retention Time |
Relative retention time(RRT) |
|
CBZM01 |
6.297 |
0.55 |
|
CBZM02 |
17.417 |
1.62 |
|
CBZN09 |
10.669 |
0.97 |
|
Cabazitaxel |
11.021 |
1.00 |
The above study reveals that all the known impurities of Cabazitaxel are adequately resolved. Hence, the method is selective for the determination of related substances in Cabazitaxel.Retention time and relative retention time for known impurities were listed in the Table 1.1.
System precision
System suitability was performed by analyzing the reference solution six times. %RSD for replicate injections of each component from reference solution was calculated. Preparations of Cabazitaxel, CBZM01, CBZM02 and CBZN09 at concentrations of 0.15% of the nominal concentration of sample required by the method were analyzed in triplicate for each solution. Results of system suitability were presented in the Table 1.2-1.3.
Table 1.2: Summary of system suitability from standard solution
|
Retention times (min) |
|||
|
CBZ |
CBZM01 |
CBZM02 |
CBZN09 |
|
10.95 |
6.27 |
17.38 |
10.6 |
|
10.99 |
6.29 |
17.37 |
10.64 |
|
10.98 |
6.28 |
17.35 |
10.63 |
|
10.97 |
6.27 |
17.34 |
10.62 |
|
10.95 |
6.23 |
17.34 |
10.6 |
|
10.93 |
6.22 |
17.33 |
10.58 |
|
10.96 |
6.3 |
17.4 |
10.6 |
|
0.2 |
0.4 |
0.1 |
0.2 |
Table 1.3: Summary of system suitability from standard solution
|
Sample |
CBZ (%area) |
CBZ (area) |
RT(min) |
|
Injection 1 |
99.609 |
3929399 |
10.81 |
|
Injection 2 |
99.611 |
3929019 |
10.85 |
|
Injection 3 |
99.567 |
3936249 |
10.84 |
|
Injection 4 |
99.612 |
3932766 |
10.82 |
|
Injection 5 |
99.603 |
3931681 |
10.85 |
|
Injection 6 |
99.609 |
3932064 |
10.86 |
|
Mean |
99.66 |
3931863 |
10.8 |
|
RSD (%) |
< 0.01 |
0.1 |
0.2 |
Limit of Detection (LOD)
Detection limit of Cabazitaxel
Stock solution of CBZ standard at concentration level 1.0 mg/mL was prepared by weighing accurately about 25.029mg of CBZ standard and was transferred into a 25mL volumetric flask, dissolved in diluent and filled up with diluent to the volumetric mark (Table 1.4.). The stock solution was diluted 100times by dispensing 250µL into a 25mL volumetric flask, completed with diluent. This CBZ solution was further diluted into a 25mL volumetric flask, dosing 50µL. The final concentration (% level) of CBZ was (0.002 %). Details of CBZ detection limit was incorporated in the Table 1.5.
Table 1.4: Stock solution preparation
|
Sample Weight (mg) |
Dilution (mL) |
Potency (%) |
Concentration (µg/mL) |
|
|
CBZ stock |
25.029 |
25 |
0.932 |
933.081 |
|
S.No |
Sample weight (mg) |
Make up Volume (mL) |
Dilution (µL) |
Make up Volume |
Dilution (µL) |
Make up Volume (mL) |
Concentration (%) |
s/n |
|
1 |
25.029 |
25 |
250 |
25 |
50 |
25 |
0.002 |
3.4 |
|
2 |
25.029 |
25 |
250 |
25 |
50 |
25 |
0.002 |
3.9 |
|
3 |
25.029 |
25 |
250 |
25 |
50 |
25 |
0.002 |
4.3 |
|
Mean |
|
|
3.9 |
|||||
Detection limits of the specified impurities
The stock solutions of individual specified impurities at concentration level 1.0mg/mL were prepared(10.000 mg of specified impurity standard was weighed into a 10mL volumetric flask, dissolved in diluent and filled up with diluent to the volumetric mark).(Table 1.6).The stock solution was diluted 100times by dispensing 250µL into a 25mL volumetric flask, completed with diluent. This solution was further diluted into 25mL volumetric flask, dosing 50µL. The final concentration (% level) of the specified impurity was 16.5-18.3ng/mL (0.002 %). The limit of detection values obtained for each impurity and Cabazitaxel are within the acceptance criteria. Detection limit evaluation of CBZ01, CBZ02 and CBZ09 were mentioned in the Table 1.7-1.9.
Table 1.6: Stock solutions preparation
|
Sample Weight (mg) |
Dilution (mL) |
Concentration (mg/mL) |
|
|
CBZM01_stock |
9.301 |
10 |
0.9301 |
|
CBZN09_stock |
9.399 |
10 |
0.9399 |
|
CBZM02_stock |
9.370 |
10 |
0.9370 |
Table 1.7: Evaluation of CBZM01 detection limit
|
S.No |
Sample weight (mg) |
Make up Volume (mL) |
Dilution (µL) |
Make up Volume |
Dilution (µL) |
Make up Volume (mL) |
Concentration (%) |
s/n |
|
1 |
9.301 |
10 |
250 |
25 |
50 |
25 |
0.002 |
3.6 |
|
2 |
9.301 |
10 |
250 |
25 |
50 |
25 |
0.002 |
3.4 |
|
3 |
9.301 |
10 |
250 |
25 |
50 |
25 |
0.002 |
4.3 |
|
Mean |
|
|
3.9 |
|||||
Table 1.8: Evaluation of CBZM02 detection limit
|
S.No |
Sample weight (mg) |
Make up Volume (mL) |
Dilution (µL) |
Make up Volume (mL) |
Dilution (µL) |
Make up Volume (mL) |
Concentration (%) |
s/n |
|
1 |
9.3700 |
10 |
250 |
25 |
50 |
25 |
0.002 |
3.4 |
|
2 |
9.3700 |
10 |
250 |
25 |
50 |
25 |
0.002 |
3.4 |
|
3 |
9.3700 |
10 |
250 |
25 |
50 |
25 |
0.002 |
3.2 |
|
Mean |
|
|
3.4 |
|||||
Table 1.9: Evaluation of CBZN09 detection limit
|
S.No |
Sample weight (mg) |
Make up Volume (mL) |
Dilution (µL) |
Make up Volume (mL) |
Dilution (µL) |
Make up Volume (mL) |
Concentration (%) |
s/n |
|
1 |
9.399 |
10 |
250 |
25 |
50 |
25 |
0.002 |
4.3 |
|
2 |
9.399 |
10 |
250 |
25 |
50 |
25 |
0.002 |
3.9 |
|
3 |
9.399 |
10 |
250 |
25 |
50 |
25 |
0.002 |
4.3 |
|
Mean |
|
|
4.1 |
|||||
Limit of Quantitation
Quantitation limit of CBZ
The stock solutions of individual specified impurities at concentration level 1.0mg/mL were prepared( about 10.000 mg of specified impurity standard was weighed into a 10mL volumetric flask, dissolved in diluent and filled up with diluent to the volumetric mark. The stock solution was diluted 100times by dispensing 250µL into a 25mL volumetric flask, completed with diluent. This solution was further diluted into 25mL volumetric flask, dosing 50µL. The final concentration (% level) of the specified impurity was 16.5-18.3ng/mL (0.002 %). Specified impurities mixed solution of the proper concentration was analysed three times. Results of CBZ quantitation limit was mentioned in the Table 2.0.
Table 2.0: Evaluation of CBZ quantitation limit
|
S.No |
Sample weight (mg) |
Make up Volume (mL) |
Dilution (µL) |
Make up Volume (mL) |
Dilution (µL) |
Make up Volume (mL) |
Concentration (%) |
s/n |
|
1 |
25.029 |
25 |
250 |
25 |
200 |
25 |
0.008 |
13.2 |
|
2 |
25.029 |
25 |
250 |
25 |
200 |
25 |
0.008 |
13.2 |
|
3 |
25.029 |
25 |
250 |
25 |
200 |
25 |
0.008 |
13.0 |
|
4 |
25.029 |
25 |
250 |
25 |
200 |
25 |
0.008 |
13.2 |
|
5 |
25.029 |
25 |
250 |
25 |
200 |
25 |
0.008 |
13.4 |
|
6 |
25.029 |
25 |
250 |
25 |
200 |
25 |
0.008 |
13.4 |
|
Mean |
|
|
13.2 |
|||||
Quantitation limits of the Specified Impurities
Quantitation limit of the specified impurities (CBZM01, CBZN09 and CBZM02) was estimated based on the detection limit results. Quantitation limit was verified by six injections of each specified impurity solution on the estimated concentration which would result in required S/N <8-15>. The limit of quantitation values obtained for each impurity and Cabazitaxel are within the acceptance criteria. Determined quantitation limit for CBZM01 is 73ng/mL (0.008 %), for CBZM02 is 71ng/mL (0.008 %) and for CBZN09 is 66ng/mL (0.007 %). The detailed results regarding quantitation limit of various impurities were listed in the Table 2.1-2.3.
Table 2.1: Evaluation of CBZM01 quantitation limit
|
S.No |
Sample weight (mg) |
Make up Volume (mL) |
Dilution (µL) |
Make up Volume (mL) |
Dilution (µL) |
Make up Volume (mL) |
Concentration (%) |
s/n |
|
1 |
9.301 |
10 |
250 |
25 |
200 |
25 |
0.008 |
14.8 |
|
2 |
9.301 |
10 |
250 |
25 |
200 |
25 |
0.008 |
14.8 |
|
3 |
9.301 |
10 |
250 |
25 |
200 |
25 |
0.008 |
14.1 |
|
4 |
9.301 |
10 |
250 |
25 |
200 |
25 |
0.008 |
14.5 |
|
5 |
9.301 |
10 |
250 |
25 |
200 |
25 |
0.008 |
14.5 |
|
6 |
9.301 |
10 |
250 |
25 |
200 |
25 |
0.008 |
14.5 |
|
Mean |
|
|
14.5 |
|||||
Table 2.2: Evaluation of CBZM02 quantitation limit
|
S.No |
Sample weight (mg) |
Make up Volume (mL) |
Dilution (µL) |
Make up Volume (mL) |
Dilution (µL) |
Make up Volume (mL) |
Concentration (%) |
s/n |
|
1 |
9.370 |
10 |
250 |
25 |
200 |
25 |
0.008 |
13.0 |
|
2 |
9.370 |
10 |
250 |
25 |
200 |
25 |
0.008 |
13.4 |
|
3 |
9.370 |
10 |
250 |
25 |
200 |
25 |
0.008 |
13.4 |
|
4 |
9.370 |
10 |
250 |
25 |
200 |
25 |
0.008 |
13.4 |
|
5 |
9.370 |
10 |
250 |
25 |
200 |
25 |
0.008 |
14.1 |
|
6 |
9.370 |
10 |
250 |
25 |
200 |
25 |
0.008 |
13.0 |
|
Mean |
|
|
13.4 |
|||||
Table 2.3: Evaluation of CBZN09 quantitation limit
|
S.No |
Sample weight (mg) |
Make up Volume (mL) |
Dilution (µL) |
Make up Volume (mL) |
Dilution (µL) |
Make up Volume (mL) |
Concentration (%) |
s/n |
|
1 |
9.399 |
10 |
250 |
25 |
190 |
25 |
0.007 |
13.0 |
|
2 |
9.399 |
10 |
250 |
25 |
190 |
25 |
0.007 |
13.2 |
|
3 |
9.399 |
10 |
250 |
25 |
190 |
25 |
0.007 |
13.2 |
|
4 |
9.399 |
10 |
250 |
25 |
190 |
25 |
0.007 |
13.0 |
|
5 |
9.399 |
10 |
250 |
25 |
190 |
25 |
0.007 |
13.6 |
|
6 |
9.399 |
10 |
250 |
25 |
190 |
25 |
0.007 |
13.9 |
|
Mean |
|
|
13.4 |
|||||
The linearity is determined by injecting the solutions in duplicate containing known impurities and Cabazitaxel ranging from 0.05 to 1.13% and impurities ranging from 0.05% to 0.22% of the specified limit. Regression analysis was performed and correlation coefficient was determined (Table 2.4 and Figure 2.0). Response factor for each impurity was determined with respect to Cabazitaxel
Table 2.4: Linearity of Cabazitaxel
|
% Level of Cabazitaxel |
Concentration (µg/mL) |
Average peak area |
|
30 |
0.280 |
1468 |
|
60 |
0.555 |
2530 |
|
80 |
0.742 |
3342 |
|
100 |
0.925 |
4063 |
|
120 |
1.119 |
4944 |
|
150 |
1.391 |
6023 |
|
220 |
2.052 |
8775 |
|
Slope |
5514 |
|
|
Intercept |
166.7 |
|
|
Correlation coefficient(R2) |
0.9998 |
|
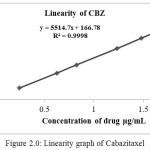 |
Figure 2.0: Linearity graph of Cabazitaxel |
Table 2.5: Linearty of CBZM01
|
% Level CBZM01 |
Concentration (µg/mL) |
Average peak area |
|
20 |
0.274 |
1148 |
|
50 |
0.696 |
3019 |
|
70 |
0.912 |
4020 |
|
100 |
1.373 |
5886 |
|
120 |
1.646 |
7094 |
|
150 |
2.005 |
8661 |
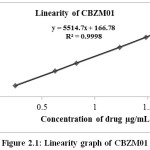 |
Figure 2.1: Linearity graph of CBZM01 |
Table 2.6: Linearity of CBZM02
|
% Level of CBZM02 |
Concentration (µg/mL) |
Average peak area |
|
20 |
0.268 |
1081 |
|
50 |
0.681 |
2715 |
|
70 |
0.893 |
3527 |
|
100 |
1.345 |
5390 |
|
120 |
1.607 |
6290 |
|
150 |
1.964 |
7690 |
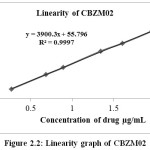 |
Figure 2.2: Linearity graph of CBZM02 |
Table 2.7: Linearity of CBZN09
|
% Level of CBZN09 |
Concentration (µg/mL) |
Average peak area |
|
20 |
0.247 |
1578 |
|
50 |
0.625 |
3592 |
|
70 |
0.823 |
4698 |
|
100 |
1.234 |
6905 |
|
120 |
1.480 |
8312 |
|
150 |
1.811 |
10217 |
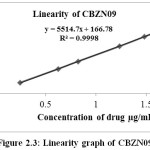 |
Figure 2.3: Linearity graph of CBZN09 |
The linearity range as the range for determining the impurities were reported. The details of the results were presented in the Table 2.5-2.7 and Figure 2.1-2.3 show the line of best fit for peak area versus concentration for each impurity. The linearity results for Cabazitaxel and all the impurities in the specified concentration range are found satisfactory, with a correlation coefficient greater than 0.99.
Accuracy
Analyses performed triple injections performed on 0.10%, 0.15% and 0.22% of the nominal concentration, respectively) were used. From linear regressions, theoretical contents corresponding to the peak areas obtained from the triple analyses and deviations of these values from the actual concentrations were calculated. The percentage recovery values obtained for each impurity are in the range of about 97.3-101.8, which are within the specified criteria. Summary of % recovery of CBZ and its impurities were listed in the Table 2.8-3.1.
Results And Discussion
A simple, economic, accurate and precise reverse phase liquid chromatography method was successfully developed using Zorbax SB C18 (100 mm×3.0 mm, 1.8µm particle size). Injection volume of 3μL is injected and eluted with the mobile phase eluent-A: pH 3.0 phosphate buffer and eluent-B: acetonitrile, which is pumped at a flow rate of 0.8 mL/min. Detection, was carried out at 220 nm.
Table 2.8: Summary of % recoveries for Cabazitaxel
|
% of Cabazitaxel |
Theoretical conc. (mg/mL) |
Measured conc. (mg/mL) |
% Recovery |
Average |
|
LOQ |
0.2798 |
0.2677 |
95.7 |
96.8 |
|
0.2798 |
0.2692 |
96.2 |
||
|
0.2798 |
0.2641 |
94.4 |
||
|
100% |
0.9249 |
0.9157 |
99.0 |
99.1 |
|
0.9249 |
0.9184 |
99.3 |
||
|
0.9249 |
0.9160 |
99.0 |
||
|
150% |
1.3907 |
1.3889 |
99.9 |
99.9 |
|
1.3907 |
1.3848 |
99.6 |
||
|
1.3907 |
1.3957 |
100.4 |
||
|
220% |
2.0520 |
2.0534 |
100.1 |
100 |
|
2.0520 |
2.0495 |
99.9 |
||
|
2.0520 |
2.0509 |
100.0 |
Table 2.9: Summary of % recoveries for CBZM01
|
% of CBZM01 |
Theoretical conc. (mg/mL) |
Measured conc. (mg/mL) |
% Recovery |
Average |
|
LOQ |
0.2743 |
0.2728 |
99.5 |
98.8 |
|
0.2743 |
0.2733 |
99.6 |
||
|
0.2743 |
0.2712 |
98.9 |
||
|
100% |
1.3735 |
1.3630 |
99.2 |
99.1 |
|
1.3735 |
1.3634 |
99.3 |
||
|
1.3735 |
1.3588 |
98.9 |
||
|
150% |
2.0054 |
2.0062 |
100.0 |
100.1 |
|
2.0054 |
2.0104 |
100.3 |
||
|
2.0054 |
2.0027 |
99.9 |
|
% of CBZM02 |
Theoretical conc. (mg/mL) |
Measured conc. (mg/mL) |
% Recovery |
Average |
|
LOQ |
0.2679 |
0.2606 |
97.3 |
97.3 |
|
0.2679 |
0.2608 |
97.4 |
||
|
0.2679 |
0.2639 |
98.5 |
||
|
100% |
1.3447 |
1.3678 |
101.7 |
101.8 |
|
1.3447 |
1.3678 |
101.7 |
||
|
1.3447 |
1.3691 |
101.8 |
||
|
150% |
1.9643 |
1.9575 |
99.7 |
99.3 |
|
1.9643 |
1.9455 |
99.0 |
||
|
1.9643 |
1.9467 |
99.1 |
Table 3.1: Summary of % recoveries for CBZN09
|
% of CBZN09 |
Theoretical conc. (mg/mL) |
Measured conc. (mg/mL) |
% Recovery |
Average |
|
LOQ |
0.2467 |
0.2364 |
95.8 |
97.1 |
|
0.2467 |
0.2352 |
95.3 |
||
|
0.2467 |
0.2359 |
95.6 |
||
|
100% |
1.2344 |
1.2219 |
99.0 |
98.1 |
|
1.2344 |
1.2063 |
97.7 |
||
|
1.2344 |
1.2031 |
97.5 |
||
|
150% |
1.8107 |
1.8225 |
100.7 |
100.4 |
|
1.8107 |
1.8120 |
100.1 |
||
|
1.8107 |
1.8187 |
100.4 |
For Selectivity, the chromatograms were recorded for standard and sample solutions of Cabazitaxel and its related substances. Selectivity studies reveal that the peak is well separated from each other. Therefore the method is selective for the determination of related substances in Cabazitaxel.
The limit of detection (LOD) and limit of quantitation (LOQ) for CBZM01 impurity 0.002% and 0.008%, CBZM02 impurity 0.002% and 0.008%, CBZN09 impurity 0.002% and 0.007% and Cabazitaxel 0.002% and 0.008% respectively. Using the optimized chromatographic conditions, the retention times (in min) of impurities were 6.297 for CBZM01 impurity, 17.417 for CBZM02, 10.669 for CBZN09 and 11.021 for Cabazitaxel. The linearity results for Cabazitaxel and all the impurities in the specified concentration range are found satisfactory, with a correlation coefficient greater than 0.99.Calibration curve was plotted and correlation coefficient for Cabazitaxel and its impurities found to be 0.9997, 0.9997, 0.9998 and 0.9998 respectively.
The accuracy studies were shown as % recovery for Cabazitaxel and its impurities at specification level. The limit of % recovered shown is in the range of 90 and 110% and the results obtained were found to be within the limits. Hence the method was found to be accurate. The accuracy studies showed % recovery of the Cabazitaxel and its related substances in the range 97.3 to101.8 respectively.
For Precision studies six replicate injections were performed. %RSD was determined from the peak areas of Cabazitaxel and its impurities. The acceptance limit should be not more than 10, and the results were found to be within the acceptance limits.
Conclusions
Chromatographic method developed by the author for the determination of Cabazitaxel and its related substances was rapid, simple, sensitive, precise, and accurate. Therefore, the proposed method can be successfully applied for the routine analysis of the active pharmaceutical ingredients for assurance of its quality during its formulation.
References
- Cheetham, P.; Petrylak,D.P. Tubulin-targeted agents including docetaxel and Cabazitaxel. Cancer Jour. 2013; 19(1), 59-65.
CrossRef - Assessment Report for Jevtana (Cabazitaxel), Procedure No: EMEA/ H/C/002018, European Medicines Agency, London, 2011.
- Jevtana (Cabazitaxel) Injection approved by U.S. FDA after priority review” (Press release). Sanofi-Aventis, 2010.
- Jordan, M.A.; Wilson, L. Microtubules as targets for anticancer drugs. Nat. Rev. Cancer.2004, 4(4), 253-65.
CrossRef - Pivot,X.; Koralewski, P.; Hidalgo, J.L.; Chan,A.; Goncalves, A.; Schwartsmann, G.; Assadourian, S.; Lotz, J.P. A multicenter phase II study of XRP6258 administered as a 1-h I.V. infusion every 3 weeks in taxane-resistant metastatic breast cancer patients. Annals of Oncology. 2008, 19(9), 1547-1552.
CrossRef - Kishore, G. New spectrophotometric methods for the quantitative estimation of Cabazitaxel in formulations. Int. J.of Res. and Reviews in Pharmacy and Appl. sci.2012, 2(5), 950-958.
- Mathrusri Annapurna, M.; Pramadvara, K.; Venkatesh, B.; Sowjanya, G. Stability-indicating RP-HPLC method for the determination of Cabazitaxel. Indo Amer. J. of Pharm. Res. 2013, 3(11), 9262-9269.
- Chengyan, Li.; Gongjian,Lan.; Jinyuan Jiang.; Mingjie Sun.; Taijun Hang. Development and validation of a stability-indicating HPLC method for the determination of the impurities in Cabazitaxel. Chromatographia. 2015, 78,825-831.
CrossRef - Mathrusri Annapurna, M.; Venkatesh, B.; Naga Supriya, G. A validated stability-indicating liquid chromatographic method for determination of Cabazitaxel-A novel microtubule inhibitor. J. of Bioequivalence and Bioavailability. 2014, 6(4), 134-138.
- Mathrusri Annapurna, M.; Venkatesh, B.; Pramadvara, K.; Hemchand, S. Development and validation of a stability-indicating liquid chromatographic method for the assay of Cabazitaxel. Chemical science transactions. 2014, 3(2), 854-60.
- Jagannath Patrol, V.; Nageshwara Rao, R.; Tripathy, N.K. LC-MS/MS determination of Cabazitaxel in rat whole blood on dry blood Spots. Open Access Scientific Reports. 2012, 1 (6), 1-4.
- Kort, A.; Hillebrand, M.J.X.; Cirkel, G.A.; Voest, E.E.; Schinkel,A.H.; Rosing, H.; Schellen, J.H.M.; Beijnen, J.H. Quantification of Cabazitaxel, its metabolite docetaxel and the determination of the demethylated metabolites RPR112698 and RPR123142 as docetaxel equivalents in human plasma by liquid chromatography tandem mass spectrometry. J. of Chromatography B. 2013, 925,117-123.
CrossRef - Peter de, Bruijn.; Anne-Joy, M. de Graan.; Annemieke, Nieuweboer.; Ron, H.J. Mathijssen.; Mei-Ho, Lam.; Ronald de ,Wit.; Erik, A.C. Wiemer.; Walter, J.Loos. Quantification of Cabazitaxel in human plasma by liquid chromatography/ triple-quadrupole mass spectrometry: A practical solution for non-specific binding. J. of Pharm and Biomed. Anal. 2012, 59,117-22.
CrossRef


ISSN Online: 2231-5039

![]()


