Contemporary Status of Heavy Metal Contamination in Soils Affected by Tannery Activities, Ranipet, South India
Kistan Andiyappan1 , Vijaya Anandan Veerasamy Alagarsamy1 and Thaminum Ansari Abubacker2
1Research and Development Centre, Bharathiar University, Coimbatore, Tamil Nadu.
2P.G. Research Department of Chemistry, Muthurangam Govt. Arts College, Vellore.
Corresponding author Email: vishmikrish@gmail.com
DOI : http://dx.doi.org/10.13005/ojc/330650
This study was focused to reveal the current heavy metal pollution in soil by tannery activities. This research was done at the site of the Tannery, Residential and normal agricultural areas in two layers of the soil samples at Ranipet, Vellore district. We investigated only four heavy metals (Cr, Pb, Cd, Zn) contamination in the soil samples of study area. Flame AAS (Atomic Absorption Spectrometer) technique was used to determine these four heavy metals concentration. This result showed that heavy metals concentration is significantly higher in soil at the site of the tannery locality than in the normal agricultural and residential areas and also these four metals strength was found to be not very much significant changes in soil at the site of the normal agricultural and residential areas. These metals contamination in the soil is answerable for the support of harmfulness in farming crops and underground water.
KEYWORDS:Heavy metal; Tannery locality; Agricultural areas; Residential Zone; Ranipet
Download this article as:| Copy the following to cite this article: Andiyappan K, Alagarsamy V. A. V, Abubacker T. A. Contemporary Status of Heavy Metal Contamination in Soils Affected by Tannery Activities, Ranipet, South India. Orient J Chem 2017;33(6). |
| Copy the following to cite this URL: Andiyappan K, Alagarsamy V. A. V, Abubacker T. A. Contemporary Status of Heavy Metal Contamination in Soils Affected by Tannery Activities, Ranipet, South India. Orient J Chem 2017;33(6). Available from: http://www.orientjchem.org/?p=40794 |
Introduction
In latest years, environment and health associated problem by heavy metal has turn into a main concern. As soil is a vital constituent of village and urban environments, the function of heavy metals in the soil structure is more and more becoming an issue of worldwide anxiety. The pollution of heavy metals in soil undesirably suffers its physicochemical criteria vital to sterility and minimum yield of crops due to their toxicity. Present days, with the growth of the worldwide economy, soil pollution by trace metal has gradually enlarged, ensuing in the deterioration of the environment. This soil fertility is contaminated by heavy metals through the modern irrigation system; resulting toxicity is received into tropical food chain which affects the food quality and protection [4, 5]. Contamination of soil by heavy metal due tannery wastes and effluents becoming a universal problem. Wastewater from tanneries, other industries or additional sources carries a huge amount of toxic metals such as Fe, Ni, Mg, As, Cr, Pb, Zn, Cd etc. which are answerable for the pollution of farming soil [1, 6, 7].
In India, Tannery is a very important foreign money sector. There are more than 600 tanneries in Vellore district and among them, 150 are situated in Ranipet, Vellore district close to the Palar River, covering an area of 48ha and the rest of them are situated in further Towns of Vellore district. The tanneries in Vellore district are posing a heavy risk to the surroundings. During tanning process, lots of chemicals such as NaCl, Ca(OH)2, Cr(SO4)3,H2SO4 and dyes are widely used. During tanning raw skin takes only 50% – 60% of the functional chemical and rest of them discharge as effluents. Most of the tanneries in Vellore district do not have effluent treatment facilities. These tanneries disposed of their untreated wastes and tannery effluent directly to open drain which will be finally connecting to the Palar River and discharged minimum 10,000 Ld−1 raw effluents [8, 9, 10, and 11]. A few workers confirmed that during peak stage about 14,950 Ld−1, off-peak stage about 9300 Ld−1 effluent discharged from tanneries [12]. Accordingly, distribution of heavy metals has taken from the untreated effluent to rivers, soil, water and crops [13]. Heavy Metals content in soils may go into the body directly through ingestion, skin contact etc. Heavy Metals in farming soils are accumulated and absorbed through vegetables and fruits etc. Ingesting heavy metals through soil-crop structure is a chief way of destructing human physical conditions [14, 15].
The focus of this research was current status of abundant metals (Cr, Pb, Zn, Cd) in tannery effluent-affected soil and compared the results with the contamination of abundant metals in unaffected soil such as agricultural and residential areas of Ranipet, Vellore district, Tamil Nadu which were not compared in the past studies [16, 17]. This research was carried out using the Flame atomic absorption spectrometer to estimate the concentration of Cr, Pb, Cd and Zn. The Flame atomic absorption spectrometer (Model Varian Spectra A240) used in this research which was very simple operating spectrometer, less time required to do experiments, can get precision results, easy to handled, and can be used to estimate other heavy metals also. From this research it has been explained that heavy metals contagion in soil has now a day’s become a major concern. In a developing country like India, the situation is not better due to deficient of technological improvement. It is clearly evident that the soil in the tannery locality of Ranipet, Vellore district is moderately to extremely contaminated with Cr, whereas Cd, Pb and Zn are very slightly to uncontaminated. This is due to being exposed to a huge amount of untreated wastes and effluents from the nearby tanneries day by day. This kind of metal contamination can be suppressed by using some low cost adsorbent which are easily available such as coconut shell, rice husk carbon, fly-ash, charcoal etc. before discharging effluent into surface water body these adsorbent should be used in order to suppress metal contamination.
Materials and Methods
Study Area
Ranipet industrialized area is a division of Vellore District of Tamil Nadu situated in 79°19′–79°22′ E longitude and 12°53′–12°57′ N latitude and is 93 Km west of Chennai(Capital of Tamil Nadu state in India). It is geographically 25 Km away in the North East of Vellore city, Tamil Nadu Ranipet has been chosen by the SIDCO & SIPCOT to set up the estates and complexes, because it is situated at a distance of 3.5 Km from River Palar and bordering Chennai-Chittoor – Bangalore Road (NH-4). It is a chronic contaminated area and one of the largest exporting centers of tanned leather. A lot of small-scale tanneries are processing leather in our study area and discharging of effluents on the open ground and adjoining water bodies. Many tannery industrial units positioned in and around this town, in addition other industries like ceramic, refractory, dye industries, plant, and chromium chemicals. Industries situated in Ranipet are discharging effluents into Puliathengal, Vanapadi, and Thandalam lakes and it is a subject of increasing concern, as these industries are situated in Palar river region. Studies of groundwater also specified the highest concentrations of chromium in Palar river region, which is more than the acceptable limit in consumption water. These tanneries are polluting the Palar River, causing environmental degradation and health problems [18, 19]
Geology of Study Area
Geologically the research region is enclosed by crystalline rocks of Achaean age consisting of Granites and a few essential intrusive bodies. The alluvium consisting of small to coarse sand and clay occurring in the region is of a fluviatile origin and controlled to the course of Palar River and most important streams [20].
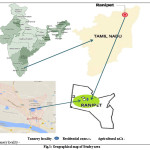 |
Figure 1: Geographical map of Studey area Click here to View figure |
Analysis of the sample was completed by Atomic Absorption Spectroscopy. In this method, the photo energy due to exact wavelength gets absorbed while the electrons of the constituent metals of the sample gains energy from a lower to a higher energy level. The intensity of light passing through the sample is compared with that of the standard solutions of the element to be estimated. Their corresponding absorbance is measured and their concentration is calculated through calibration curves plotted with concentration against absorbance values (Beer-Lambert’s law). The soil samples (Figure 1) were collected from seven different points of different sites in the locality of tannery on the agricultural area and residential zone is a densely populated area of Ranipet, Vellore district where about many registered tanneries discharge their vast amount of unprocessed solid and liquid waste straightly into the Palar River and other water bodies. So this area was chosen as a study area to compare the level of heavy metals with other non-tannery area. Four different points in the tannery vicinity were marked as TA-1 which is the discarding point itself, and TA-2, TA-3, TA-4, TA-5, TA-6, TA-7which are located at 0 -50 m, 100 – 200m, 250 – 300m, 400 – 500m, 550 – 600m, 750 – 850m and 1000- 1200m distance respectively from the discarding point. Ranipet agricultural area was marked as AA and Residential areas marked as RA.
Sampling
In the month of May 2017, the soil samples were collected from the sampling sites with the help of a Steel Trenching hoe and transferred to pre cleaned plastic bottles. The samples were collected from two different layers of different depth at al sample points. The first layer is the superficial layer (0 – 10 cm) and the other is 30 – 40 cm below from the surface level by measuring with 100 cm wood scale. After collecting the soil samples were washed, weighed and dried in an electric hot oven at 110˚C until become constant weight then cooled in desiccators with fused Calcium chloride. Then all the soil samples were grinded by stone soil grinder (figure. 2) and thoroughly homogenized. The crushed soil samples were lastly stored in cleaned dry closed glass bottles and well-maintained in desiccators for further analysis.
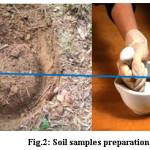 |
Figure 2: Soil samples preparation Click here to View figure |
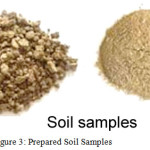 |
Figure 3: Prepared Soil Samples Click here to View figure |
Digestion of Soil Sample
For the quantitative analysis of Cr, Pb, Cd and Zn soil samples were digested following ISO 11466 thermal heating methods. According to this method , first 5 g of each crushed soil samples were weighed and taken into pre cleaned 100ml glass beakers. Then the weighed samples were humidified with 2 ml of deionized water. After that 24 ml, of HCl and 8 ml of HNO3 were poured drop by drop and then 18 ml of dilute HNO3 (0.5 M) was poured to every beakers and the samples were permitted to position at lab temperature (27- 300C). Every mixture was then refluxed on a heating not plate for 2hrs and was filtered through filter paper (Whitman no 42) after cooling and kept at room temperature for further analysis.
Total Heavy Metals Concentration Measurement
After soil samples digestion, Cr, Pb, Cd and Zn metals were analyzed by using Flame atomic absorption spectrometer ( FAAS – Model Varian Spectra A240), (Sample volume – 10 mL/min. Burner – Air/Acetylene, N2O/Acetylene burner/ Gases hallow cathode – Acetylene and nitrous oxide) at Technology Business incubator Lab, Department of Science and Technology, VIT-university, Vellore, Tamil Nadu. Cd (Wavelength 228.8 nm), Cr (Wavelength 357.9 nm), Pb (Wavelength 283.3 nm), and Zn (Wavelength 213.9 nm) specific hollow cathode lamp was used to analyze the samples. The instrument having a minimum detection limit of 0.01 mg/L for Cd, 0.10 mg/L for Cr, 0.20 mg/L for Pb and 0.01 mg/L for Zn in the flame method. Samples were aspirated through Nebulizer and absorbance was measured with a blank solution (Deionized water) as reference. Calibration curve was obtained using standard samples (containing 0.1, 0.2, 0.3, 0.4, 0.5,.06,0.7,0.8mg/L for Cd; 0.4, 0.8, 1.2, 1.6 and 2.0 mg/L for Cr; 0.2, 0.4, 0.6, 0.8 and 1.0 mg/L for Pb and 0.5, 1.0, 1.5, 2.0, 2.5 and 3.0 mg/L for Zn).
Result and Discussion
After this survey, it was cleared that Cr contamination of soils in the locality of tannery is honestly high in all seven tannery location samples and observed that Cr was exceeded the permissible limits (Table. 1). The outcome recorded maximum values of heavy metal concentration at the tannery effluent discharging point and lowest values in the soil of Agriculture area and residential zone. These heavy metals concentration was found maximum abundantly in the superficial layers of the soil and the concentration of heavy metals reduced with the increase of depth and distance ( Table. 1, 2 & 3 and Figure 4 & 5). It is accepted that in the case of Tannery locality soil samples, Cr content was found more abundant (1524.28 mg/kg) in 0 – 10 cm depth (surface layer) of TA-1 (effluent discharging point) and least abundant (59.45 mg/kg) in 30 – 40cm depth of TA-7. In the superficial layer of soil samples, the values for Cr concentration ranged from 1524.28 to 110.47mg/kg, in 0 – 10 cm depth, it ranged from 584.64 to 59.45 mg/kg in 30 – 40 cm depth ( Table. 1). The case of Agricultural and residential areas soil, Cr content in surface layer, 0 – 10 cm and 30 – 40 cm depth is found 79.71 – 51.09 ( Table. 2) and 41.71, – 30.10 mg/kg ( Table. 3)correspondingly.
Table 1: Heavy metal analysis of tannery locality soil samples
|
Sampling places |
Distance from dumping of tannery wastes(m) |
Depth of layers from superficial level (cm) |
Cr (mgKg-1)
|
Pb (mgKg-1)
|
Cd (mgKg-1)
|
Zn (mgKg-1)
|
|
TA-1 |
0 – 50 |
0 – 10 30 – 40 |
1524.28 584.64 |
92.58 76.61 |
5.86 2.16 |
282.32 124.24 |
|
TA-2 |
100 – 200 |
0 – 10 30 – 40 |
1088.26 236.29 |
64.23 60.42 |
4.20 1.92 |
187.31 97.40 |
|
TA-3 |
250 – 300 |
0 – 10 30 – 40 |
590.68 208.70 |
42.29 26.50 |
2.82 1.60 |
173.5 65.39 |
|
TA-4 |
400 – 500 |
0 – 10 30 – 40 |
432.11 133.33 |
38.73 20.37 |
2.02 1.15 |
107.23 63.05 |
|
TA-5 |
550 – 600 |
0 – 10 30 – 40 |
270.84 101.43 |
28.45 20.06 |
1.85 1.04 |
120.52 85.69 |
|
TA-6 |
750 – 850 |
0 – 10 30 – 40 |
256.61 98.26 |
15.68 5.68 |
1.82 1.06 |
72.36 46.48 |
|
TA-7 |
1000 – 1200 |
0 – 10 30 – 40 |
110.47 59.45 |
16.08 5.28 |
1.87 0.66 |
55.59 47.46 |
|
Maximum Minimum Mean Standard deviation (SD) Maximum allowable limit recommended by EC (1986) [13] |
1524.28 59.45 406.81 410.59 50 |
92.58 5.28 36.64 26.19 300 |
5.86 0.66 2.04 1.025 3 |
282.32 46.48 109.18 63.96 – |
||
Table 2: Heavy metal analysis of agricultural soil samples
|
Sampling places |
Depth of layers from superficial level (cm) |
Cr (mgKg-1) |
Pb (mgKg-1) |
Cd (mgKg-1) |
Zn (mgKg-1) |
|
AA |
0 – 10 |
79.71 |
31.14 |
2.46 |
48.23 |
|
30 – 40 |
51.09 |
26.61 |
2.28 |
40.73 |
|
|
Mean |
50.90 |
28.87 |
2.37 |
44.48 |
|
|
Standard deviation (SD) |
10.80 |
2.26 |
0.09 |
3.75 |
|
|
Maximum allowable limit recommended by EC (1986) [13] |
50 |
300 |
3 |
– |
|
Table 3: Heavy metal analysis of Residential Zone soil samples
|
Sampling places |
Depth of layers from superficial level (cm) |
Cr (mgKg-1) |
Pb (mgKg-1) |
Cd (mgKg-1) |
Zn (mgKg-1) |
|
RA |
0 – 10 |
41.71 |
50.58 |
2.05 |
18.33 |
|
30 – 40 |
30.10 |
26.60 |
1.08 |
15.56 |
|
| Mean |
35.65 |
38.29 |
0.48 |
16.94 |
|
|
Standard deviation (SD) |
9.80 |
11.98 |
1.56 |
1.38 |
|
|
Maximum allowable limit recommended by EC (1986) [13] |
50 |
300 |
3 |
– |
|
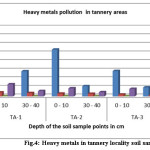 |
Figure 4: Heavy metals in tannery locality soil samples |
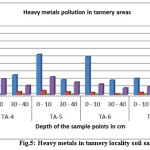 |
Figure 5: Heavy metals in tannery locality soil samples Click here to View figure |
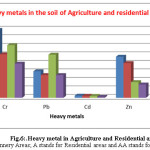 |
Figure 6: Heavy metal in Agriculture and Residential areas soil Click here to View figure |
Note: TA stands for Tannery Areas; A stands for Residential areas and AA stands for Agricultural areas
From the end result, it is obvious that Cr content in the Tannery surrounding area of same layers reduced with increase of distance from the tannery effluent discharging point and also with the increase of depth at each point (fig. 4&5). In the superficial soil layer (0-10cm), the rate of decreasing Cr concentration with distance was higher than other depth layers (30-40cm) (Fig.4, 5& 6). In all cases Cr concentration in the tannery location soil samples were found higher than that of the agricultural and residential areas (Fig.4, 5& 6). In Tannery surrounding area, in the superficial layer of each point, the value of Cr content exceeded the permissible limit that is 50 mg/kg (Table. 1) [21]. But Agricultural Area soil slightly exceeded and Residential soil samples did not exceed that limit (Table. 2&3). The high concentration of Cr in the superficial layer of tannery surrounding area soil samples might be due to pollution from different industrial wastes such as Cr pigment and raw tannery wastes, leather industrialized wastes, and municipal sewage mud etc. [22]. Cr pollution in the soil might be due to waste consisting of Lead-Chromium batteries, colored plastic bags, surplus plastic materials and unfilled paint containers [23]. Cr is toxic and carcinogenic and long-term contact to Cr can cause liver and kidney impairment [24]. Chromium could also modify genetic materials and cause for cancer. Additional health troubles are Skin diseases, Stomachs upset, Respiratory problems, ulcers problems ,damaged immune systems, change of Hereditary material, Lung disease and Death that area used by Chromium[25].
Lead is the next common metal in this study. In the case of Tannery surrounding area, Lead content was found more abundant (92.58 mg/kg) in the superficial layer of point TA-1 (waste discharging point) and minimum quantity abundant (5.28 mg/kg) in the depth layer(30 -40 cm) of point TA-7. In the superficial layers (0-10cm), the concentration of Pb ranged from 92.58 to 16.08 mg/kg, whereas in the depth layer (30 – 40 cm) of soil, Pb concentration varied from 76.61 to 5.28 mg/kg (Table.1 & Fig. 4,5)). While in the case of Agricultural and Residential area soil, Pb content in the superficial layer (0 – 10cm) and depth layer (30 – 40cm) was found 31.14 – 26.61mg/kg and 30.58 – 16.61 mg/kg respectively (Table.2&3). Also Pb content in the Tannery surrounding area soil of similar layers, the values decreased with the increase of distance from the dumping spot and also with the increase of depth at each point. In the superficial layer (0 – 10cm), the rate of Pb contamination decreased with distance but higher than other layers of 30 – 40 cm depth (Fig. 4&5). Neither Tannery surrounding area soil nor Agricultural Area soil at any layer in this study exceeded the allowable limit for Pb that is 300 mg/kg [26].The high content of Pb content near the discarding point may be due to the discharge of Pb-containing untreated tannery effluent.
The presence of Pb in soil can happen due to the release of Pb by automobiles using leaded petrol and other industries in this study area. This Pb content may be deposited on top soil and water, thus reaching humans by way of the food chain. Pb in the soils might also be from vehicle exhaust smoke as well as dry cell batteries, sewage effluents, runoff of wastes and atmospheric depositions [27]. Pb exposure has effects like disruption of the biosynthesis of red blood cell in blood and anemia, Miscarriages, Kidney damage, and subtle abortions, Disruption of nervous methods, enhance in blood pressure (BP), Brain grievance, Declined fertility of men through sperm impairment, decreased schooling abilities of children, Behavioral disruptions of kids, such as aggression, hyperactivity and imprudent behavior[28].
Also Cd was taken into consideration for this study; the Cd content was found more abundant (5.86 mg/kg) in the top layer of TA-1 (dumping point) and smallest amount abundant (0.71 mg/kg) in 30 – 40 cm depth of TA-7 in case of Tannery locality In top layer, values for Cd content varied from 2.46 to 1.87 mg/kg, in the depth of 30 – 40cm the Cd concentration range was from 2.16 to 0.66 mg/kg (Table. 1). Whereas in the case of Agricultural and residential areas soil, Cd concentration in superficial layer (0 – 10 cm) and depth layer (30 – 40 cm) was found 2.46 – 2.28mg/kg and 3.05 – 1.08 mg/kg respectively (Table 3 & 4). At the sample TA-4, TA-5, TA-6 and TA-7 the concentration of Cd was more or less similar (Table. 1). In the superficial layer (0 -10 cm) of tannery area soil contamination of Cd decreased with the increases of distance from the discarding point (Fig. 4&5). The result was not same when 30 – 40 cm depth layer was considered as such regularity in the values was not found there. Like Cr and Pb, the concentration of Cd also decreased with the increase of depth at all points in the tannery locality (Fig 4&5). Other than this was not the case for agriculture and residential areas soil samples as the result was reverses there. For superficial layers, Cd content in each point of the Tannery surrounding area was found slightly higher than that of Agricultural and residential areas (Table. 1, 2&3). But unlike Cr and Pb, Cd content in depth layers (30 – 40 cm) of Agricultural and residential areas soil was found slightly lower than that of each point in the Tannery vicinity soil (Fig.4, 5 &6). At any layer of any point in all Tannery region, Agricultural and residential areas soil samples, Cd content did not exceed the maximum acceptable limit (3.0 mg/kg) (Table 1,2&3).The Cd was brought to soil with the application of phosphoric fertilizers. Application of a lot of phosphate and compound fertilizers increases Cd in soils continuously. Additional sources of Cd might be ceramics plastics, paint and glass production industry. The Cd is extremely toxic and even at very small amount; chronic contact to this metal can major to insomnia, anemia, cardiovascular diseases as well as hyper-tension [1, 29, 30].
Similarly for Zn, In the case of Tannery locality, the Zn concentration was found more abundant (282.32 mg/kg) in the superficial layer (0–10cm) of sample point TA-1 (waste discharging point) and minimum abundant (46.48 mg/kg) in the depth layer (30-40cm) of at the sample point of TA-7(Table.1). In superficial layer (0-10cm), values of Zn concentration varied from 282.32 to 55.59 mg/kg, in the depth layer (30 – 40cm), the Zn concentration varied from 124.24 to 46.48 mg/kg (Table. 1 & Fig. 4,5). While in the case of Agricultural and residential areas soil, Zn content in the surface layer, 0 – 10 cm and 30 – 40 cm depth was found 48.23-40.73mg/kg and 18.33 – 15.56 mg/kg correspondingly (Table.2,3 & Fig. 6).
It is also noticed that in the case of the superficial layers (0-10cm) and depth layers (30 – 40 cm) of Agricultural Area and residential areas soil possess lower Zn concentration than Tannery locality soil samples at each point (Table. 1,2&3).
The major sources of Zn pollution is industries as well as the use of liquid fertilizer, composted materials and agrochemicals like fertilizers as well as pesticides in agriculture’s is an necessary trace metal for the growth plants, animals and human being other than is potentially hazardous for the earth planet when it is abundant in more concentrations. Heavy doses of Zn show toxic, carcinogenic effects and effect in neurologic as well as hematological complications, hypertension, liver and kidney function disorders [1, 31].
Conclusion
Heavy Metal contamination in soil has now become a most important concern. In growing countries like India, the condition is worst due to lacking of technological improvement. From this revise, it is obviously the evident that the soil in the tannery locality of Ranipet, Vellore district is exceedingly contaminated with Cr not with other Pb, Cd and Zinc. This is due to being exposed to an enormous amount of raw tannery wastes from the nearby Tanneries day after day. A considerable quantity of Cadmium (Cd), Zinc (Zn) and Lead (Pb) has also been found in the soil of this area which were not exceedingly contaminated but very slightly contaminated in only few sample points of this study area. These metals might accumulate and deposited in soil and uptake by vegetables and fruits through route of plants and other crop grown in this area which eventually gets into animal and human body through the tropical food chain. This results in different unpleasant effects on animal and human health as Cr, Pb and Cd are extremely toxic and carcinogenic in environment. So authority concerned need to take immediate measures for these problems to prevent such infectivity by these heavy metals.
Remedy
In order to beat the above problems, heavy metal can be suppressed from effluents and waste of tanneries and other industries, some low cost adsorbent can be recommended such as coconut shell carbon, rice husk carbon, fly-ash, charcoal etc. before discharging effluent into surface water body these adsorbent should be used which will be very useful to suppress metal contamination.
References
- Rahaman, A.; Afroze, J.S.; Bashar,K., Ali, M.F,; Hosen, M.R. American Journal of Analytical Chem. 2016, 7(12), 880.
CrossRef - Shaari, H.; Mohd,M.S.; Abdullah,N.A.; Bidai, J. Oriental J.Chemistry.2015, 31(2), Pp.993-999.
- Syrlybekkyzy, s.; suleimenova, n.; zhardemovich, g. ; nurbayeva,f.; permyakov, v. Oriental J. chemistry.2014, 30(4), pp.1631-1638.
- del Mar López, T.; Aide, T.M. ; Thomlinson, J.R. A Journal of the Human Environ. 2001, 30, 49-54.
- Maria, L.R.; Lauro, F.V.; Marcela, R.N.; Del Socorro, H.M.M.; Catalina, C.O. and Francisco, D.C. Oriental J. Chemistry. 2017, 33(3), 1061-1070.
- Bollikolla, H.; Pulapaka, S.; Avuguddi, R.B.; Dasaripalli, J.R.; Arza, V.S. Oriental J. Chemistry. 2016, 32(4), 2275-2282.
- Su, C,; Jiang, L.; Zhang; W. Environ. SkepticsandCritics. 2014, 3, 24-38.
- G. Mohan, D. and Pittman, C.U. Journal of hazardous materials.2006, 137(2), 762-811.
CrossRef - Subramanian, K.S. ;Selvan, T.A. GSI Publications, 2001, 2(1).
- Muchuweti, M.; Birkett, J.W.; Chinyanga, E.; Zvauya, R.; Scrimshaw, M.D.; Lester, J.N. Agriculture, Ecosystems & En-vironment. 2006, 112, 41-48.
CrossRef - E.Ong, M.C.; Menier, D.; Shazili, N.A.M.; Kamaruzzaman, B.Y. Oriental J. Chemistry. 2013, 29(1), 39-45.
CrossRef - F.Anda, M. Geoderma. 2012, 189, 388-396.
- Huq, S.I. Aciar Proceedings, Coimbatore. 1998, 31 January-4 February 1998.
- Afzal, M.; Shabir, G.; Iqbal, S.; Mustafa, T.; Khan, Q.M.; Khalid, Z.M. CLEAN—Soil, Air, Water. 2014, 42, 1133-1139.
CrossRef - I.metalsGivianrad, M.H.; Hashemi, A. Oriental J. Chemistry. 2014, 30(2), 737-743.
- Chowdhury, M.; Mostafa, , M.G.; Biswas, T.K.; Saha, A.K. Water Resources and Industry.2013, 3,11-22.
CrossRef - J .Singh, R. Oriental J.Chemistry. 2014, 30(1), 229-232.
- Krishna, A.K.; Govil, P.K. Environ. Geology. 2004, 47(1), 38-44.
CrossRef - Thangarajan, M. Environ. Geology. 1999, 38(3), 209-222.
CrossRef - Arora, M.; Kiran, B.; Rani, S.; Rani, A.; Kaur, B.; Mittal, N. Food Chemistry. 2008, 111, 811-815.
CrossRef - Aelion, C.M.; Davis, H.T.; McDermott, S.; Lawson, A.B. Scie. Total Environment. 2008, 402, 149-156.
CrossRef - K.Alshammary, S.F.; Al-Horayess, O.S. 2014. Oriental J. Chemistry. 2014, 29(4), 1515-1522.
CrossRef - Council Directive .Offic. J. Eur. Comm. 1986, 181, 0006-0012.
- Jung, C.; Matsuto, T.; Tanaka, N. Waste Management. 2006, 26, 1337-1348.
CrossRef - Mondol, M.; Chamon, A.S.; Faiz, B.; Elahi, S.F. Journal of Bangladesh Academy of Scie. 2011, 35, 19-41.
- Korotkova, T.G.; Ksandopulo, S.J.; Bushumov, S.A.; Burlaka, S.D.; Say, Y.V. Oriental J. Chemistry. 2017, 33(1), 186-198.
- Järup, L. British Medical Bulletin. 2003, 68, 167-182.
CrossRef - Adaikpoh, E.O. J. Environ. Earth Sci. 2013, 3, 45-54.
- Sharma, R.; Agrawal, M.; Marshall, F. Bulletin of Environ. Contamination and Toxicology. 2006, 77, 312-318.
CrossRef - Rao, M.; Gopalkrishnan, R.; Venkatesh, B. National Symposium on Role of Earth Sciences, Lucknow, 2001, 2-4 Nov-2001.
- Aelion, C.M.; Davis, H.T.; McDermott, S.; Lawson, A.B. Science of the Total Environ. 2008, 402, 149-156.
CrossRef

This work is licensed under a Creative Commons Attribution 4.0 International License.
![]()
A New Edition of Web of Science
Journal Impact Factor
2022: 0.5
Five Year: 0.8
Journal is Indexed in

Cabells Whitelist
![]()


