Synthesis and Characterization of Boron and 2-Aminophenol Schiff Base Ligands with Their Cu(II) and Pt(IV) Complexes and Evaluation as Antimicrobial Agents
University of Baghdad, College of Science, Chemistry Department, Baghdad, Iraq.
Corresponding Author E-mail: asmaa_mnk@yahoo.com
DOI : http://dx.doi.org/10.13005/ojc/330532
Download this article as:
![]()
Synthesis, Characterization and biological study of two Schiff base ligands derived from 2-aminophenol and 4-bromoacetophenone (1:1) (L1) and boron Schiff base which was derived from L1 and sodium borohydride (1:1) (L2). Cu(II) and Pt(IV) complexes of the Schiff base ligands were synthesized. The prepared compounds have been investigated by molar conductivity, elemental analysis, FTIR, 1H,13CNMR, thermal analysis, UV-VIS, as well as atomic absorption and magnetic susceptibility. The biological study of the ligands and their metal complexes were carried out against E-coli, Staphylococcus, as bacteria species, Candida and Mycrosporium Canis as fungi.
KEYWORDS:Schiff base; 2-aminophenol
Introduction
The Schiff bases have a wide range of uses and applications because these compounds have excellent properties such as structural similarities with biological molecules, simple preparation methods with flexibility[1],biological activity as antiviral, antileukemic, antibacterial, enzymatic reaction inhibitors and biocidal which is essential for plant growth regulators.[2]
Boron compounds have been well known since ancient times where used to prepare hard glasses and glazes. Today the uses of boron compounds expended to include semiconductors, hard materials and antitumor medicine.[3,4,5]
Boron is an electron deficient which possess four valance orbitals and only three electrons, boron tendency to fill the vacant orbital and this promote the electron acceptor behavior and lead to increase the stability of imine group (C=N) of boron Schiff base, therefore the organoborane compounds are more stable than organometallic compounds.[6] Boron Schiff bases have many applications such as catalyst[7], determination of enantiopurity of chiral amino alcohols[8], photoelectronic application[6,9] and nutraceutical industry[10].
In this paper we report the synthesis, structural characterization and biological evaluation of two Schiff base ligands, 2-aminophenol Schiff base (L1) and boron Schiff base (L2) with their Cu(II) and Pt(IV) complexes.
Experimental
Material and Instruments
All chemicals used were of analytical reagent grade. Melting points were determined by using Gallenkamp melting point apparatus. Thermal analysis (TG and DTG) were performed by using METTLER TA4000 SYSTEM for L1 and METTLER TOLEDO for L2. The spectra of 1H and 13C NMR were recorded on (Bruker NMR spectrometer 400 MHz Avance III 400). The electronic spectra of all prepared compounds were recorded on (SHIMADZU 1800-UV spectrophotometer) in DMSO. FTIR were carried out in the range (400-4000) cm-1 using KBr disk for the ligands and CsI disk in the range (250-4000) cm-1 for metal complexes by using SHIMADZU 8400s spectrophotometer. Elemental microanalysis were carried out by (CHNS Elemental Analyzer CHNS-932). Metal contents were determined by using (Nov AA 350 spectrophotometer). Magnetic susceptibility measurements were performed at room temperature by using (Auto Magnetic Susceptibility Balance Model Sherwood Scientific). Molar conductivity were measured in DMSO at room temperature by using Hunts Capacitor Trade Mark British made. Chloride contents were determined by using Mohr method.
Methods
Synthesis of 2-((1-(4-bromophenyl)ethylidine)amino)phenol (L1).
This ligand has been prepared in our previous work.[11]
Synthesis of 2-borane((1-(4-bromophenyl)ethylidene)amino)phenol (L2).
A hot solution of Schiff base (L1) (0.173 gm, 0.59 mmol) in 60 ml tetrahydrofurane (THF) was added gradually to a boiled suspension of sodium borohydride (0.045 gm, 1.19 mmol) in 10 ml THF. The mixture was heated under reflux for 16 hr with stirring and the color of solution changed from green to brown. The brown product was obtained by concentrated the reaction mixture and then a little amount of n-hexane was added, washed several times with n-hexane and dried in air.
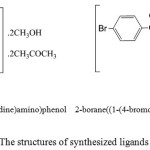 |
Figure 1: The structures of synthesized ligands L1 and L2. Click here to View figure |
Synthesis of Cu(II) Complexes C1 and C3.
To a hot solution of L1 (0.1 gm, 0.2128 mmol) in a mixture of methanol:aceton (2:1) was added a methanolic solution of CuCl2.2H2O (0.0181 gm, 0.1064 mmol) for C1 complex. The mixture was heated under reflux for four hours. Dark brown precipitate was obtained after evaporating part of the solvent and adding ether. Washed several times with ether and dried. The preparation method of copper complex (C3) was similar to that of (C1), using L2 (0.0713 gm, 0.2034 mmol) with CuCl2.2H2O (0.0173 gm, 0.1017 mmol).
Synthesis of Platinum Complexes C2 and C4.
The preparation methods of Platinum complexes were similar to that of (C1), using L1 or L2 0.1g (0.2128 and 0.2852 mmol) respectively and K2PtCl6(0.0517g, 0.1064 mmol) in 6 ml DMSO for C2 and (0.0693g, 0.1426 mmol) in 24 ml DMSO for C4 respectively.
Results and discussion
The physical and analytical data (Table 1) are agreement with suggested structures of studied compounds.
Table 1: The physical properties and analytical data for two ligands and their metal complexes
| Symbol | Color | Yield% | m.p °C | CHN analysis Found (calc.) |
M%Found (calc.) | Cl%Found (calc.) | ||
| L1 | Golden-brown | 21.9 | 134-137 | 56.27(56.18) | 5.95(6.80) | 4.34(2.97) |
_ |
_ |
| L2 | Brown | 57.2 | >240 | 48.30(49.29) | 5.04(5.76) | 4.93(3.99) |
_ |
_ |
| C1 | Dark brown | 48.3 | >360 | 52.53(51.92) | 3.57(3.70) | 3.82(4.32) |
10.88 (9.87) |
2.6 (2.7) |
| C2 | Dark brown | 39.2 | >360 | 24.42(23.43) | 2.55(3.06) | 1.59(1.95) |
_ |
2.8 (4.5) |
| C3 | Dark brown | 93.7 | >360 | 32.70(33.79) | 4.09(4.94) | 1.89(2.81) |
4.82 (5.63) |
7.4 (7.1) |
| C4 | Dark brown | 92.9 | >360 |
21 (21.92) |
3.19(4.17) | 1.79(1.82) |
_ |
_ |
IR Spectra
The data of IR spectra of studied ligands and their metal complexes are listed in Table (2) and the spectra of L1 and L2 are shown in Figure (2). The peaks appeared at (3420-3452) cm-1 were attributed to lattice water while the coordinated water was exhibited peaks at observed at (3379, 651) and (3406, 756) cm-1.[12,13,14] The spectra of L1, L2, C1 and C2 were exhibited strong peaks at (3400-3520) cm-1 which were assigned to stretching vibration of OH group, this band was shifted to lower frequency in the spectrum of C2 complex at 3400 cm-1 as a result of complexation[13,15, 16] and disappeared in spectra of C3 and C4 because of the binding of metal ions with oxygen atom of OH group. The band appeared at 2340 cm-1 in spectra of L2, C3 and C4 assigned to vibrational mode of B-H.[12] The band at 1415 cm-1 in spectrum of L2 was attributed to the stretching vibration of B-N, this band not changed in spectra of C3 and C4 complexes.[12] The azomethine group (C=N) exhibited peak at 1581 cm-1 for L1 while this peak shifted to lower frequency at 1562 cm-1 for L2 and this due to binding of BH3 with nitrogen atom of C=N. The spectrum of metal complex C2 showed shifted to lower frequency in this peak at 1577 cm-1 comparison with L1 and the spectrum of C1 exhibited change in profile of C=N peak, this due to the binding between N atom and metal ions.[16,17] Peaks that noticed at range 304-491 cm-1 were assigned to stretching vibration of M-Cl, M-O and M-N.[13,14,18]
Table 2: IRSpectra of two ligands and their metal complexes
| compound | ʋO-H | ʋB-H | ʋB-N | ʋC=N | H2O lattice(coordinate) | ʋM-O | ʋM-N | ʋM-Cl |
|
L1 |
3448 |
– |
– |
1581 |
– |
– |
– |
– |
|
C1 |
3440 |
– |
– |
1583 |
– |
– |
387 |
312 |
|
C2 |
3400 |
– |
– |
1577 |
3420 |
500 |
435 |
318 |
|
L2 |
3520 |
2340 |
1415 |
1562 |
3425 |
– |
– |
– |
|
C3 |
– |
2340 |
1413 |
1566 |
3452 (3406,756) |
441 |
– |
304 |
|
C4 |
– |
2340 |
1415 |
1565 |
3448 (3379,651) |
491 |
– |
329 |
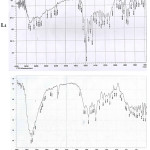 |
Figure 2: The IR spectra of Ligands L1 and L2. Click here to View figure |
1HNMR Spectra
The data of 1HNMR are listed in (Table 3) and the NMR spectra in DMSO of L1 and L2 are shown in (Figure 3). The spectra of two ligands showed chemical shift at 8.9 and 8.5 ppm for L1 and L2 respectively and this due to OH proton.[14] The multiple peaks observed at the range δ(6.3-6.8) ppm referred to aromatic protons. [19] The spectrum of L1 exhibited a peak at δ(1.9 ppm) which assigned to CH3 protons and acetone (CH3) .[14,16] Chemical shifts of methanolic CH3 protons and the dissolved water in DMSO appeared at δ(3.3 ppm).[16] The weak band appeared at δ(4.3 ppm) is due to methanolic OH proton.[16] The spectrum of L2 exhibited peak at δ(1 ppm) which was referred to CH3 protons.[14,16] The peak observed at (δ 1.65 ppm) attributed to THF protons (mark:16), while the broad peak appeared at δ(3.4 ppm) due to protons of THF (mark:17), BH, H2O and dissolved water in DMSO. [12,14,16,20 ] Strong peak appeared at δ(2.5 ppm) was assigned to residual DMSO[12,14].
Table 3: Chemical shifts for 1HNMR of L1 and L2.
|
L1 |
L2 |
||||
|
Chemical shifts δ(ppm) |
Mark |
Assignments in DMSO |
Chemical shifts δ(ppm) |
Mark |
Assignments in DMSO |
|
1.9,9H,s |
8,16,18 |
CH3 protons and CH3 in acetone protons |
1,3H,s |
8 |
CH3 protons |
|
3.3,3H,s |
15 |
Methanolic CH3 protons and dissolved water in DMSO |
1.65,4H,s |
16 |
2(CH2) of THF |
|
4.3,1H,s |
15 |
Methanolic OH proton |
3.4,9H,s |
15,17,18 |
BH,H2O,2(CH2) of THF and dissolved water in DMSO |
|
6.3-6.6,8H,m |
3-6 10,11,13,14 |
Aromatic protons |
6.3-6.8,8H,m |
3-6 10,11,13,14 |
Aromatic protons |
|
8.9,1H,s |
2 |
O-H proton |
8.5,1H,s |
2 |
O-H proton |
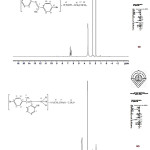 |
Figure 3: 1HNMR spectra of L1 and L2.
|
13CNMR Spectra
The data of 13CNMR are listed in (Table 4). The ligands spectra in DMSO exhibited multiple peaks at range δ(114-125.2) ppm which due to aromatic carbon.[14] The single peaks observed at δ(130.4, 125 ppm) for L1 and L2 respectively attributed to chemical shift of C-N (mark:1).[21] The peak at δ(132.6 and 132.5 ppm) for L1 and L2 respectively due to carbon of C-Br.[16] Chemical shift of phenolic carbon (mark:2) appeared at δ(144 and 144.1 ppm) for L1 and L2 respectively.[16] The azomethine carbon showed chemical shift at δ(172 and 166.1 ppm) for L1 and L2 respectively. [14] The spectrum of L1 exhibited peak at δ(20 ppm) which due to CH3 carbon,[14] while the peak at δ(34 ppm) was attributed to CH3 of acetone.[16] The methanolic carbon exhibited chemical shift at δ(49 ppm) and the carbon of acetone (mark:17) showed chemical shift at δ(204 ppm).[16] The spectrum of L2 showed another peaks, the peak appeared at δ(18 ppm) which assigned to methyl group carbon.[14] The carbons of THF (mark:16) showed a peak at δ(24.5 ppm) , while the carbons (mark:17) exhibited peak at δ(68.3 ppm).[16] The peak appeared at δ(40 ppm) was attributed to chemical shift of DMSO.[16]
Table 4: Chemical shifts (ppm) for 13CNMR of L1 and L2.
|
L1 |
L2 |
||||
|
Chemical shifts δ(ppm) |
Mark |
Assignment in DMSO |
Chemical shifts δ(ppm) |
Mark |
Assignment in DMSO |
|
20 |
8 |
Carbon of methyl group |
18 |
8 |
Carbon of methyl group |
|
34 |
16,18 |
Carbon of acetone |
24.5 |
16 |
2(CH2) of THF |
|
49 |
15 |
Methanolic carbon |
68.3 |
17 |
2(CH2) of THF |
|
114-12 5.2 |
3-6 9, 10, 11, 13, 14 |
Aromatic carbons |
114.5-12 0.5 |
3-6 9, 10, 11, 13, 14 |
Aromatic carbon |
|
130.4 |
1 |
Carbon of amine |
125 |
1 |
Carbon of amine |
|
132.6 |
12 |
Carbon of brom |
132.5 |
12 |
Carbon of brom |
|
144 |
2 |
Phenolic carbon |
144.1 |
2 |
Phenolic carbon |
|
172 |
7 |
Carbon of azomethine |
166.1 |
7 |
Carbon of azomethine |
|
204 |
17 |
Carbon of acetone |
|||
Thermal Analysis TG and DTG
TG and DTG data of studied ligands are listed in (Table 5) and their thermograms are showed in (Figure 4). The first step for each ligand involved loss of solvents and water molecules because of their low boiling points at temperature range (33.7-172.3°C) and (20.6-85°C) for L1 and L2 respectively. The thermogram of L1 showed the decomposition of L1 through four steps at temperature range (33.7-601.3°C) without residue, while the decomposition of L2 carried out through four steps at temperature range (20.6-650°C) with residue and this means the L2 is more stable than L1. [22,23,24]
Table 5: Thermal decomposition of L1 and L2.
| Compound | Steps | Temp. range of Decomposition°C |
Peak temp at DTG°C |
% weight loss Found (calc.) |
| L1C6H12NOBr.2CH3OH.2CH3COCH3M.
wt= 469.9 |
2 CH3OH 2 CH3COCH3 8 H |
33.7-172.3 |
146.3 |
38.83 (40.00) |
|
C6Br + C6 |
172.3-280.7 |
207.0 |
46.48 (47.64) |
|
|
C |
280.7-354.3 |
324.0 |
3.17 (2.55) |
|
|
CH3 + N + OH |
354.3-601.3 |
458.3 |
11.53 (9.78) |
|
| L2C14H15NOBBr.0.1C4H8O.2.2H2OM.
wt= 350.52 |
0.1C4H4O 2.2H2O |
20.6-85 |
88.0 |
12.30(13.35) |
|
Br |
85-170 |
178.0 |
21.53(22.79) |
|
|
BH3+CH3+OH |
170-320 |
323.0 |
13.73(13.07) |
|
|
C6H4 |
320-446 |
480.0 |
22.13(21.68) |
|
|
C6H4CN(residue) |
446-650 |
– |
30.30(29.09) |
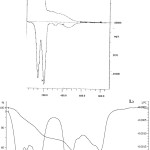 |
Figure 4: Thermograms of Ligands L1 and L2. Click here to View figure |
Electronic spectra, Magnetic Moments and Molar Conductivity
The data of UV-Vis spectra of L1, L2 and their metal complexes in DMSO are listed in (Table 6). The spectra of ligands (Figure 5) showed the intense band at 40650 and 41493 cm-1 for L1 and L2 respectively due to π→ π* transition and weak intensity band at 23980 and 19758 cm-1 of L1 and L2 respectively which referred to n→π* transition. The copper and platinum complexes of L1 and L2 exhibited blue shift of ligand bands (π→ π*). The spectrum of copper complex (C1) (Figure 5) showed three bands at 15329, 19794 and 20976 cm-1 which were assigned to 2B1g→2A1g, 2B1g→2B2g and 2B1g→2Eg transitions respectively of tetragonally distorted octahedral Cu(II) complexes.[14] A three absorption bands were observed in the spectrum of copper complex (C3) at 11030, 15480 and 19671 cm-1 which attributed to 2B1g→2A1g, 2B1g→2B2g and 2B1g→2Eg transitions respectively, as well as the absorption band at 24154 cm-1 which were belong to charge transfer transition (C.T).[ 13,14,25] The magnetic moments of copper complexes C1 and C3 were µeff.=2.4 and 2.6 B.M of C1 and C2 respectively, these values due to octahedral geometry.[26] The spectrum of diamagnetic platinum complex C2 showed bands at 12195, 22935 and 29614 cm-1 which assigned to 1A1g→3T1g(H), 1A1g→3T2g and 1A1g→1T1g(C.T) transition respectively of octahedral platinum (IV) complexes. [13,27,28] Two absorption bands were observed in spectrum of Pt(IV) complex (C4) (Figure 5) at 11035 and 21643 cm-1 which were referred to 1A1g→3T1g(H) and 1A1g→3T2g transitions respectively of octahedral platinum (IV) complexes. [13,27,28] The molar conductivity data in DMSO were 0.033, 0.059, 0.121 and 0.163 S.mol-1.cm-1 for C1, C2, C3 and C4 complexes respectively indicating the nonelectrolytic properties of complexes.[29] The suggested structures of complexes were shown in (Figure 6).
Table 6: Electronic spectra, magnetic moment and molar conductance with suggested structures of L1and L2 complexes.
|
symbol |
Band position cm-1 |
Assignments |
µeff. B.M |
Molar Conductivity S.mol-1.cm-1 |
Suggested structures |
|
C1 Cu(II) |
ʋ1 15329 ʋ2 19794 ʋ3 20976 |
2B1g→2A1g 2B1g→2B2g 2B1g→2Eg(C.T) |
2.4 |
0.0337 |
octahedral |
|
C2 Pt(IV) |
ʋ1 12195 ʋ2 22935 ʋ3 29614 |
1A1g→3T1g(H) 1A1g→3T2g 1A1g→1T1g(C.T) |
diamagnetic |
0.0591 |
octahedral |
|
C3 Cu(II) |
ʋ1 11030 ʋ2 15480 ʋ3 19671 ʋ4 24154 |
2B1g→2A1g 2B1g→2B2g 2B1g→2Eg L→M(C.T) |
2.6 |
0.121 |
octahedral |
|
C4 Pt(IV) |
ʋ1 11035 ʋ2 21643
|
1A1g→3T1g(H) 1A1g→3T2g |
diamagnetic |
0.163 |
octahedral |
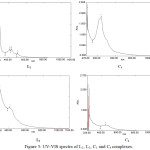 |
Figure 5: UV-VIS spectra of L1, L2, C1 and C4 complexes. Click here to View figure |
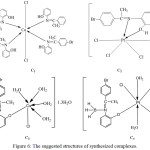 |
Figure 6: The suggested structures of synthesized complexes. Click here to View figure |
Biological Screening
The data of biological activity were listed in (Table 7). The studied compounds and starting materials were tested as antibacterial and antifungal agents against gram negative bacteria (E-Coli ), gram positive bacteria (Staphylococcus aureus), (Candida) and (Mycrosporium Canis). The test was carried out by diffusion method for studied compounds in DMSO and concentration 10-2 M. The tested compounds exhibited different activities against Staphylococcus aureus, Candida and Mycrosporium canis, while these compounds were inactive against E-Coli. The results have been compared with three kinds of antibiotics cephalexim, cefatoxim and ketoconazole.
Table 7: Antibacterial and antifungal activity of two ligands and their metal complexes.
|
Compounds |
Staphylococcus aureus diameter mm |
E-Coli diameter mm |
Candida diameter mm |
Mycrosporium Canis diameter mm |
|
DMSO |
zero |
zero |
zero |
zero |
|
2-aminophenol |
36 |
zero |
18 |
zero |
|
4-bromoacetophenone |
zero |
zero |
zero |
zero |
|
Sodium borohydride |
zero |
zero |
zero |
zero |
|
L1 |
20 |
zero |
12 |
15 |
|
L2 |
23 |
zero |
12 |
zero |
|
C1 |
32 |
zero |
34 |
23 |
|
C2 |
20 |
zero |
10 |
zero |
|
C3 |
20 |
zero |
15 |
13 |
|
C4 |
zero |
zero |
zero |
zero |
|
Cephalexim |
25 |
zero |
– |
– |
|
Cefatoxim |
48 |
45 |
– |
– |
|
Ketoconazole |
– |
– |
zero |
20 |
Conclusions
The new Schiff base ligand derived from 2-aminophenole with 4-bromoacetophenone (L1) and the Schiff base of boron (L2) with their metal complexes have been synthesized and characterized. The results showed that the coordination of L1 with Cu(II) and Pt(IV) through N atom as donor atom while the coordination of L2 with metal ions through O atom. The results of electronic spectra and magnetic susceptibitity exhibited the octahedral geometry for Pt complexes and destorted octahedral for Cu complexes. The thermal analysis give a good characterization of L1 and L2 and showed that L2 is more stable than L1. The synthesized compounds were studied as antibacterial and antifungal , the results showed a different activities against Staphylococcus aureus, Candida and Mycrosporium Canis , while inactive against E-Coli.
Acknowledgment
The authors gratefully acknowledgment chemistry department laboratories in college of science / Baghdad University and college of science / Al-Mustansiriya University for supporting in the measurements of FTIR ,UV-Vis spectra, melting point, conductivity and magnetic susceptibility
References
- John,A.M.X.; Arockia,M.R.; Margaret,J.M.; Journal of Chemical and Pharmaceutical Research. 2012, 4, 669-672
- Rai,B.K.; Rachana,K.; Amrita, T.; Oriental Journal of Chemistry. 2012, 28, 943-948
CrossRef - Anastassia,N.; Alexander, I. B.; Hua-jin, Z.; Lai-sheng,W.; Coordination Chemistry Reviews. 2006, 250, 2811-2866
CrossRef - Abdullatif,A.; International Journal of Engineering and Advanced Technology. 2015, 4, 147-155
CrossRef - Douglas,S.M.; Kenneth,J.S.; Nuclear Instruments and Methods in Physics Research A. 2004, 517, 180-188
- Qiufei,H.; Liyan,Z.; Hongyu,Z.; Yue,W.; Shimei,J.; Journal of Luminescence. 2007, 126, 447-451
CrossRef - Amitabha,M.; Lauren,J. D.; Jeffrey,E. S.; Bijal,P. P.; Sean,P.; David,A.A.; Inorganic Chemistry. 2006, 45, 9213-9224
CrossRef - Andrew,M. K.; Ph.D.Thesis, University of Bath 2008
- Rodrego,A.C.N.; Ph.D.Thesis, University of Autonoma Denuevoleon 2014
- Anca-Mihael,B.; Andrei,B.; Florentina,B.; Alina,P.; Johny,N.; Ludovic,E.B.; Cornelia,B.; George,D.M.; Rev. Chim. 2014, 65, 84-86
- Asmaa,M.N.K.; Marwa,I.J.; IOSR Journal of Applied Chemistry(IOSR-JAC). 2016, 9, 4-144
- Asmaa,M.N.K.; Iraqi Journal of Science. 2015, 56, 2762-2772
- Ahlam,J.A.; Asmaa,M.N.K.; Bioinorganic Chemistry and Applications. 2009, 1-12
- Ahlam,J. A.; Asmaa, M.N.K.; Bioinorganic Chemistry and Applications. 2013,1-14
- Kabeer,A.S.; Khaled,S.; Canadian Journal Transactions. 2015, 3, 207-224
- Robert,M.S.; Sixth Edition, John wiley and Sons Ink., Newyrk. 1997
- Xavier,A.; Srividhya,N.; IOSR Journal of Applied Chemistry(IOSR-JAC). 2014, 7, 6-15
CrossRef - Ritika,M.M.; Barhat,V.D.; International Journal of ChemTech Research. 2014, 6, 1003-1012
- Chaudhary,N.K.; Archives of Applied Science Research. 2013, 5, 227-231
- Fulmer,G.R.;Miller,A.J.M.; Sherden, N.H.; Gottlieb, H.E.; Nudelman, A.; Stoltz, B.M. ; Bercaw, J.E.; Goldberg,K.I.; Organometallics. 2010, 29, 2176-2179
CrossRef - Ismet,K.; Aysel,A.; Chinese Journal of Polymer Science. 2009, 27, 465-477
CrossRef - Pandhare,G.R.; Shinde,V.M.; Deshpande,Y.H.; Rasayan J.Chem. 2008, 1, 337-341
- Sahin,O.; Bulutcu,A.N.; Turk.J.Chem. 3003, 27, 197-207
- Magda,A.; Pode,R.; Muntean,C.; Medeleanu,M.; Popa,A.; J.Serb.Chem.Soc. 2010, 75, 951-963
CrossRef - Lever,A.B.P.; Elsevier Publishing Co. Amsterdam-London, New York. 1968
- Gehad,G.M.; Mohamed,M.O.; Ahmed,M.H.; Turk J Chem. 2006, 30, 361-382
- Rawaa,A.M. A.; MSc., Thesis, University of Baghdad 2000
- Ahlam,J. A.; Asmaa,M.N.K.; Proceeding of 3rd Scientific conference of the college of science, University of Baghdad. 2009, 1458-1471
- Geary,W.J.; Coordination Chemistry Reviews. 1971, 17, 81-122
CrossRef


ISSN Online: 2231-5039

![]()


