Randic Shape and Size Indices Account for the Variability in Xanthine Oxidase Inhibitory Activity of a Family of Fused Pyrans
Liza T. Billones, and Junie B. Billones
Department of Physical Sciences and Mathematics, College of Arts and Sciences, University of the Philippines Manila Padre Faura, Ermita, Manila, 1000 Philippines.
DOI : http://dx.doi.org/10.13005/ojc/330509
Gout and oxidative stress have been strongly associated with hyperuricemia, a metabolic defect marked by high levels of uric acid (UA) in the serum. Hyperuricemia has been managed by the use of drugs that inhibit xanthine oxidase. The recent account on synthesis of 4-aryl/heteroaryl-4H-fused pyrans as XO inhibitors provided excellent opportunity to uncover the crucial properties of these compounds that confer XO inhibitory action. In here, multiple linear regression analysis of DRAGON-type descriptors showed that the Randic Shape Index (PW3), and a size descriptor P_VSA_v_3 account for the 75% of the variability of IC50 values. Correlation studies with familiar QSAR descriptors indicate that the observed activity is primarily influenced by the molecular ovality and volume, and partly by charge distribution. The Comparative Molecular Field Analysis (CoMFA) models provide further insights on the steric and electronic features of this class of XO inhibitors.
KEYWORDS:Xanthine oxidase inhibitors (XOI); hyperuricemia; gout; fused pyrans; CoMFA; Randic Shape Index
Download this article as:| Copy the following to cite this article: Billones L. T, Billones J. B. Randic Shape and Size Indices Account for the Variability in Xanthine Oxidase Inhibitory Activity of a Family of Fused Pyrans. Orient J Chem 2017;33(5). |
| Copy the following to cite this URL: Billones L. T, Billones J. B. Randic Shape and Size Indices Account for the Variability in Xanthine Oxidase Inhibitory Activity of a Family of Fused Pyrans. Orient J Chem 2017;33(5). Available from: http://www.orientjchem.org/?p=38074 |
Introduction
Gout, oxidative stress, and other systemic disorders like cardiovascular and other metabolic diseases have been strongly associated with hyperuricemia, a disorder in the metabolism marked by high levels of uric acid (UA) in the serum1. The management of hyperuricemia involves reducing the production, increasing the excretion, and mopping out of excess uric acid2. The reduction of UA level in the blood has been accomplished by dispensing xanthine oxidase (XO) inhibitors. XO is responsible for the conversion of purine to UA in the latter part of the metabolic pathway, particularly the catabolism of hypoxanthine to xanthine followed by hydroxylation of xanthine to uric acid3,4. During purine oxidation, XO utilizes dioxygen as electron acceptor that is converted to reactive oxygen species (ROS) in the process. The ROS derived from XO has been linked to several disease conditions including carcinogenesis, atherosclerosis, inflammation, and chronic obstructive pulmonary disease (COPD)5. Therefore, the selective inhibition of XO may pave the way for multi-targeted chemotherapy for gout, cardiovascular disease, cancer, and oxidative damage6.
The current treatment for hyperuricemia involves purine-based XO inhibitors primarily Allopurinol6,7 along with 2-alkyl hypoxanthines8,9, and pterins10. However, Allopurinol potentially yields toxic purine metabolites that have been implicated in several adverse effects such as skin rashes, drowsiness, allergic reactions, and gastrointestinal, hepatic, renal and hematological problems5,6,11-13. These drawbacks have prompted the search for non-purine based XO inhibitors that lead to the discovery of recently approved drug Febuxostat14 and its derivatives Piraxostat15 and FYX-05116. Other classes of non-purine XO inhibitors reported in recent years include azaflavones17, pyrazolines18, acetamides19, naphthopyrans20, heteroarylpyrimidinones21, isocytosines22, thiadiazolo-pyrimidones23, benzaldehydes24, and xanthones25.
Recently, a series of forty-one 4-aryl/heteroaryl-4H-fused pyrans, has been prepared and tested for xanthine oxidase (XO) inhibition26. This family of compounds offers great opportunity to identify the relevant properties inherent in these compounds that dictate their xanthine oxidase inhibitory activity. A routine approach in drug design is the generation of quantitative structure-activity relationship (QSAR) models, which relate the observed bioactivity to the molecular properties27 as exemplified in our previous works28,29. QSAR studies are useful in the ligand-based design of next generation drug candidates with improved pharmacodynamics and pharmacokinetics properties. A QSAR study on this sizeable class of compounds unravels the crucial chemical properties and the extent of the contribution of each predictor to effect XO inhibition. Thus, in this study over 4000 DRAGON-type descriptors were generated for each member of the pyran family. The structure-derived predictors that influence the variation of experimental XO activity were determined by multiple linear regression analyses. The generated QSAR models were supplemented with Comparative Molecular Field Analysis (COMFA) on the same set of pyran XO inhibitors. In COMFA30, the 3D structure of a molecule defined by an array of grid structures is subjected to a probe atom or functional group to calculate the steric and electrostatic fields at certain points outside the grid27. The results of this work provide critical insight in the development of next generation of fused pyrans as therapeutic agents for hyperuricemia.
Materials and Methods
Data Collection
The biological data (IC50) of 4-aryl/heteroaryl-4H-fused pyrans (Table 1) included in this study were obtained from literature26. IC50 denotes the concentration of the test compound that exerts 50% inhibition of the biological action. The 3D structures of all compounds were generated using Spartan 14® (Wavefunction, Inc.) software. Geometry optimization was performed at semi-empirical PM3 level of theory prior to the generation of molecular electrostatic potential map and other isosurfaces. The CoMFA models were created with the use of BIOVIA Discovery Studio (DS) 2017 software (http://accelrys.com). The QSAR descriptors were computed using the DRAGON 5 software (http://www.talete.mi.it). Over 4000 descriptors were computed including 0D properties (constitutional); 1D descriptors (i.e. atom-centered fragments, functional groups, properties, and information descriptors); 2D descriptors (i.e. connectivity, edge adjacency, molecular walk counts, topological, topological charge indices, eigenvalue-based indices, Burden eigenvalues, and 2D autocorrelation descriptors); and 3D descriptors (i.e. geometry, charge, Randic molecular profiles, 3D-MoRSE, RDF, GETAWAY, and WHIM descriptors)31.
QSAR Model Building
To establish a quantitative relationship between structure-based properties (dependent variables) and experimental activity (independent variable) of pyrans, a multiple linear regression model was derived with the use of forward stepping protocol32 in SPSS version 20 that ran on MacOS 10.11 system. In order to relate the k independent variables or descriptors (Xi) to the dependent variable Y, a linear function, with parameters α and βi, were obtained in the form:
![]()
To preliminarily assess the quality of the fitted equation, the amount of the variability in the dependent variable that is explained by the regression equation was determined by calculating the squared correlation coefficient (r2)33. In addition, bivariate correlation studies were done to check for multi-collinearity among the predictors.
QSAR Model Validation
The predictive ability of the QSAR model was evaluated using Leave-One-Out (LOO)34 and Leave-Group-Out (LGO)35 techniques. In LOO method, a single entry (row) is removed from the dataset containing n entries, then a new equation is generated based on n – 1 dataset left. Subsequently, the equation is used to calculate the response variable y for the compound that had been removed. This process is done repeatedly until all y values in the dataset are obtained. In the LGO approach, the test set (a group of compounds omitted in each instance) is usually 20% of n. A model is then generated based on the remaining 80% of the dataset, also called as training set. The generated model is used to calculate the y values for the excluded compounds. After which, the original dataset of n compounds is restored and another round of test set selection, refitting based on new training set, and prediction of y values for the compounds in the test set. This process is continued until all the y values for n dataset have been calculated. In this work, four more cycles of y value calculations were done in order to obtain an average of five predicted values for each compound.
The cross-validated r2 value, (also known as q2) was determined to assess the statistical validity of the model. The q2 values for the cross-validated models were calculated from the model PRESS (prediction error sum of the squares) according to equations 2 and 3, respectively.
Both r2 and q2 are useful indicators of model validity. While the r2 value quantifies the goodness-of-fit, the q2 value determines the goodness of prediction33.
Furthermore, to verify the absence of chance correlation, y-randomization36 was performed by randomly scrambling the y values while keeping the x values intact. Accordingly, the QSAR model was used to predict the randomly scrambled y values.
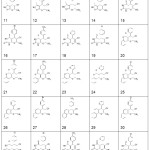 |
Table 1: Structures of 4-aryl/heteroaryl-4H-fused Pyrans26. Click here to View table |
Results and Discussion
QSAR in Drug Discovery
Drug discovery in modern times follows a repetitive, cyclic workflow involving three major steps that include design, synthesis, and evaluation33. One of the two approaches in drug design, called ligand-based discovery, is appropriate in cases where a set of compounds with common biological action is known. QSAR study can be performed on a set of compounds in order to decipher the structure-based properties that influence the experimental bioactivity. The deep understanding of the relationship between molecular structure and bioactivity is useful in the design of a lead compound and its derivatives.
QSAR models are mathematical equations derived from systematic analysis of diverse descriptors or properties of a compound using appropriate statistical techniques. A supervised univariate method of analysis called multiple linear regression (MLR) has been commonly employed in QSAR studies. MLR provides quantitative description of the relation between the relevant molecular descriptors and the experimental data.
DRAGON-Type Descriptors and QSAR Model
In this study, over 4000 molecular descriptors were calculated for each of the 41 XO inhibitors using the DRAGON software. The output of DRAGON as text file was converted to Microsoft Excel® format and, in turn, exported to SPSS®. After removing the descriptors that have zero or invariant values throughout the dataset of 41 compounds, only 3062 independent variables (descriptors) were left.
With a sample size of 41, the QSAR model should contain at most 8 descriptors, following the rule-of-thumb in model development of having 1 independent variable per 5 samples)33,37. Incidentally, the multiple linear regression analysis of this dataset using both Enter and Stepwise methods returned eight equations consisting of one, two, three up to eight variables, respectively. The eight-variable model includes the following descriptors: PW3, P_VSA_v_3, SpDiam_AEA(ed), RDF045u, SpMax2_Bh(m), H8m, R4i, and Mor15s, in order of decreasing contribution to the variability of the dependent variable (IC50).
Nevertheless, the correlation analysis on these descriptors revealed notable multi-collinearity involving several descriptors, particularly the four least important contributors to XO inhibitory activity. Thus, it is instructive to remove these four descriptors namely, SpMax2_Bh(m), H8m, R4i, and Mor15s. The r2value was hardly eroded (Δr2 = 0.067) by the exclusion of the four variables, and thus the resulting QSAR model (Equation 4) with just four predictors remains adequate in explaining the variability of IC50.
QSAR Equation:
IC50 = 507.335 (±37.711) – 1747.216 (±100.700) PW3 – 0.139 (±0.015) P_VSA_v_3
+ 25.837 (±4.061) SpDiam_AEA(ed) – 1.344 (±0.235) RDF045u
n = 41 r2 = 0.902 F = 82.6 Sig = 0.000 (Equation 4)
The MLR analysis showed that only 7% of the variability of IC50 values was explained by the four excluded descriptors combined. On the other hand, the four included predictors in the model account for 90% of the variation in XO inhibitory activity of fused pyrans. Specifically, the Randic shape index Path/Walk 3 (PW3) alone explains more than half (57%) of the variation of response variable, and the combined PW3 and a size index P_VSA_v_3, account for 75% of the fluctuations in IC50 values. The negative coefficient of PW3 indicates that its value should increase in order to minimize IC50 and improve the potency of the XO inhibitor. The graph theoretical index Path/Walk 3 introduced by Randic38 has been demonstrated to give regressions of high quality for a number of physicochemical properties. Meanwhile, P_VSA_v_3, which stands for P-VSA on van der Waals volume, bin 3, is obviously a size descriptor. P-VSA-like descriptors are defined as the amount of van der Waals surface area (VSA) having a property P in a certain range39.
To appreciate the remarkable influence of a poorly understood graph theoretical index like PW3 on the observed activity of a compound, the DRAGON-type descriptors were correlated with typical QSAR variables such as those that can be derived from Spartan software (e.g. MW, area, volume, etc.). The interrelatedness of the two groups of descriptors is evident in Table 2. It can be seen that PW3 is highly significantly inversely correlated with Ovality and LogP. These results indicate that a more spherical and more hydrophilic pyran-based lead tends to be a more potent XO inhibitor. Similarly, the negative coefficient of P_VSA_v_3, which is highly significantly correlated with size-dependent properties like MW, area, volume, and polarizability, indicates that a larger and more polarizable variant of fused pyran tends to have smaller IC50. Furthermore, a molecule with smaller SpDiam_AEA(ed) and larger RDF045u values tends to enhance potency, albeit these descriptors have minor contributions to observed XO inhibitory activity. SpDiam_AEA(ed) is an edge adjacency index while RDF045u is a radial distribution function descriptor (http://www.talete.mi.it).
Table 2: Correlations coefficients for the top four most important DRAGON-type descriptors and Spartan-derived QSAR descriptors.
| PW3 | P_VSA_V_3 | SpDiam_AEA(ed) | RDF045u | |
| MW | -0.348* | 0.737** | -0.060* | 0.077 |
| Area | -0.313* | 0.701** | 0.235 | 0.244 |
| Vol | -0.258 | 0.747** | 0.333* | 0.235 |
| PSA | -0.184 | -0.546** | -0.420** | -0.066 |
| Ovality | -0.445** | 0.398* | -0.170 | 0.126 |
| Acc Area | 0.082 | 0.746** | 0.525** | 0.157 |
| LogP | -0.411** | 0.541** | 0.079 | -0.008 |
| P Area | -0.201 | -0.501** | -0.424** | -0.070 |
| Acc P Area | -0.173 | -0.518** | -0.437** | -0.086 |
| Polarizability | -0.259 | 0.752** | 0.333* | 0.232 |
| HBA | -0.160 | -0.546** | -0.488** | -0.086 |
| Abs Hardness | -0.144 | 0.493** | 0.173 | 0.016 |
Correlation is significant at the 0.05 level (2-tailed).
Correlation is significant at the 0.01 level (2-tailed).
QSAR Model Validation
The predictive ability of the QSAR model was evaluated by performing cross-validation using both leave-one-out (LOO) and leave-group-out (LGO) methods. The results detailed in Table 3 and illustrated graphically in Figure 1 demonstrate the robustness (large q2) and thus the utility of the QSAR model in the design of next generation XO inhibitors. The random distribution of residuals around Z-score value of 0 and within ±3 (Figure 2) indicates the absence of any bias or systematic error, and outliers with the use of the QSAR model. Furthermore, the results of y-randomization validation also indicate the absence of chance correlation, with a negligible correlation coefficient (r = 0.089) for the jumbled experimental IC50 values and the calculated values.
Table 3:Essential QSAR descriptors, experimental, and predicted IC50 values of 4-aryl/heteroaryl-4H-fused Pyrans as xanthine oxidase inhibitors.
| Compound | PW3 | P_VSA_v_3 | SpDiam_AEA(ed) | RDF045u | Expt’l IC50 | Calc IC50 (LOO) | Calc IC50 (LGO)a | Scrambled Expt’l IC50 b | Calc IC50 (Y-scrambling)b |
| 1 | 0.360 | 96.335 | 6.882 | 14.791 | 22.2 | 23.08 | 23.02 | 12.4 | 9.74 |
| 2 | 0.359 | 135.868 | 6.617 | 14.849 | 10.9 | 12.39 | 12.34 | 1.67 | 9.95 |
| 3 | 0.361 | 89.615 | 6.617 | 15.521 | 13.4 | 14.33 | 14.14 | 4.32 | 9.07 |
| 4 | 0.366 | 81.909 | 6.675 | 15.998 | 3.58 | 7.93 | 8.05 | 8.4 | 8.31 |
| 5 | 0.366 | 105.006 | 6.675 | 18.605 | 3.08 | 0.31 | 0.19 | 3.01 | 8.16 |
| 6 | 0.359 | 129.508 | 6.617 | 17.512 | 4.32 | 9.99 | 9.70 | 5.5 | 9.47 |
| 7 | 0.354 | 120.122 | 6.715 | 21.455 | 12.58 | 18.37 | 18.30 | 22.2 | 9.56 |
| 8 | 0.349 | 144.624 | 6.624 | 15.517 | 33.12 | 26.21 | 26.56 | 1.97 | 11.30 |
| 9 | 0.364 | 94.751 | 6.887 | 19.032 | 12.4 | 10.18 | 10.07 | 8.39 | 8.53 |
| 10 | 0.363 | 134.284 | 6.589 | 14.066 | 6.4 | 5.75 | 5.64 | 7.57 | 9.47 |
| 11 | 0.365 | 88.031 | 6.589 | 17.067 | 8.4 | 4.08 | 4.09 | 12.6 | 8.23 |
| 12 | 0.371 | 80.325 | 6.680 | 14.322 | 3.2 | 0.94 | 0.74 | 9.7 | 7.88 |
| 13 | 0.371 | 103.422 | 6.680 | 11.233 | 2.24 | 2.26 | 3.06 | 17.4 | 8.61 |
| 14 | 0.363 | 127.924 | 6.589 | 14.85 | 4.01 | 5.80 | 5.91 | 19.87 | 9.28 |
| 15 | 0.356 | 125.35 | 6.886 | 14.77 | 26.4 | 25.95 | 25.77 | 26.4 | 10.60 |
| 16 | 0.356 | 164.883 | 6.588 | 14.464 | 14.4 | 13.07 | 12.86 | 10.87 | 10.69 |
| 17 | 0.358 | 118.63 | 6.588 | 15.128 | 17.4 | 15.10 | 15.42 | 1.9 | 9.81 |
| 18 | 0.362 | 134.021 | 6.679 | 18.14 | 7.4 | 4.15 | 4.05 | 7.5 | 9.10 |
| 19 | 0.356 | 158.523 | 6.588 | 15.794 | 9.4 | 12.67 | 12.66 | 3.58 | 10.42 |
| 20 | 0.364 | 137.123 | 6.957 | 16.967 | 7.43 | 9.55 | 9.43 | 1.3 | 9.41 |
| 21 | 0.363 | 176.656 | 6.836 | 17.116 | 5.5 | 1.90 | 1.77 | 0.59 | 9.80 |
| 22 | 0.365 | 130.404 | 6.836 | 17.441 | 4.5 | 4.69 | 4.73 | 13.4 | 8.97 |
| 23 | 0.369 | 122.697 | 6.836 | 12.871 | 0.9 | 5.58 | 5.88 | 3.08 | 9.05 |
| 24 | 0.369 | 145.794 | 6.836 | 14.982 | 0.59 | -1.35 | -1.37 | 9.4 | 8.97 |
| 25 | 0.363 | 176.656 | 6.836 | 17.16 | 1.3 | 2.17 | 2.32 | 7.4 | 9.79 |
| 26 | 0.362 | 145.601 | 6.852 | 14.785 | 9.5 | 12.05 | 11.74 | 10.9 | 9.97 |
| 27 | 0.361 | 185.134 | 6.734 | 14.82 | 7.5 | 4.70 | 4.58 | 6.4 | 10.38 |
| 28 | 0.363 | 138.882 | 6.734 | 14.843 | 8.5 | 7.84 | 7.91 | 8.5 | 9.60 |
| 29 | 0.367 | 154.272 | 6.734 | 12.79 | 1.9 | 1.47 | 1.74 | 9.5 | 9.54 |
| 30 | 0.361 | 178.774 | 6.734 | 15.727 | 2.9 | 4.82 | 5.07 | 34.3 | 10.17 |
| 31 | 0.356 | 92.149 | 6.886 | 14.891 | 34.3 | 28.86 | 29.29 | 3.2 | 10.22 |
| 32 | 0.356 | 131.682 | 6.588 | 15.368 | 16.4 | 16.61 | 16.71 | 2.9 | 10.19 |
| 33 | 0.358 | 85.43 | 6.588 | 16.942 | 19.87 | 17.08 | 16.62 | 7.43 | 9.17 |
| 34 | 0.362 | 100.82 | 6.679 | 14.481 | 10.87 | 14.14 | 12.94 | 4.01 | 9.30 |
| 35 | 0.356 | 125.322 | 6.588 | 16.404 | 12.6 | 16.49 | 16.17 | 33.12 | 9.96 |
| 36 | 0.361 | 145.601 | 6.938 | 17.112 | 9.7 | 13.00 | 13.02 | 16.4 | 9.86 |
| 37 | 0.36 | 185.134 | 6.819 | 17.126 | 7.57 | 5.51 | 5.65 | 12.58 | 10.27 |
| 38 | 0.362 | 138.882 | 6.820 | 18.735 | 8.39 | 6.45 | 6.27 | 2.24 | 9.24 |
| 39 | 0.366 | 131.175 | 6.819 | 18.046 | 1.97 | 1.53 | 2.89 | 0.9 | 8.72 |
| 40 | 0.366 | 154.272 | 6.819 | 17.583 | 1.67 | -1.26 | -1.42 | 14.4 | 9.05 |
| 41 | 0.36 | 178.774 | 6.819 | 18.144 | 3.01 | 5.56 | 6.00 | 4.5 | 10.04 |
a Average of 5 sets; b One of 5 iterations with r = 0.089.
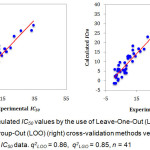 |
Figure 1: Calculated IC50 values by the use of Leave-One-Out (LOO) (left) and Leave-Group-Out (LOO) (right) cross-validation methods versus Experimental IC50 data. q2LOO = 0.86, q2LGO = 0.85, n = 41. Click here to View figure |
 |
Figure 2: Z Scores for LOO (left), r2 = -0.05; and LGO (right), r2 = -0.04 cross-validation methods. Click here to View figure |
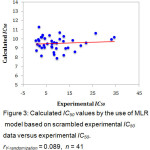 |
Figure 3: Calculated IC50 values by the use of MLR model based on scrambled experimental IC50 data versus experimental IC50. rY-randomization = 0.089, n = 41. Click here to View figure |
3D QSAR by CoMFA
Finally, Comparative Molecular Field Analysis (CoMFA) was also performed on the same set of 4-aryl/heteroaryl-4H-fused pyrans to further shed light on the structural features needed to effect XO inhibition. The 3D QSAR model was built using Partial Least Squares (PLS) regression using energy grids as descriptors. The energy grids were computed using two probe types, a positive point charge H+ and van der Waals Carbon, designed to measure electrostatic and steric effects, respectively. In model building, the most uncorrelated descriptors were chosen. The dataset of 41 compounds was split into two; the 11 compounds were randomly selected to constitute the test set, while the remaining 30 compounds served as the training set. Then, the logIC50 model was successfully created and validated. The external validation using the test set yielded a predictive squared correlation coefficient, q2 of 0.49, which is above the threshold value40 of 0.3, although lower than practical cut-off41 of 0.6. Although the 3D QSAR model is not as robust as Equation 4, the insights it offers are consistent with that of the QSAR model consisting of DRAGON-derived indices (vide infra).
The results of CoMFA (Figure 4) indicate that a new molecule must have stronger van der Waals (vdW) attractive interaction at the 4-aryl position and at distal end of the heteroaryl moiety (i.e. green vdW isosurface) of the fused pyran. These spots almost coincide with the red electrostatic potential (EP) isosurface, where there should be no negative functionalities. In addition, the EP isosurface of the 3D QSAR model favors the presence of electronegative groups at the proximal end (i.e. blue isosurface) of the heteroaryl fragment as well as the amino/nitrile-substituted side of the core pyran. Compounds 20 – 25, the most active class of fused pyrans satisfy these requirements, the additional benzene fused to the pyranone having set the stage for van der Waals interaction while the lactone functionality provided the negative electrostatic potential. Apparently, the compounds with larger heteroaryl group (i.e. 20 – 30, 36 – 41) are generally more active agents. Furthermore, the chromen-2-one-4H-fused pyrans (20 – 25), having negative potential at the right position, are more active than their naphthalene counterparts (26 – 30). These observations are consistent with the QSAR model derived from DRAGON-type descriptors and the 3D QSAR model. Both models point to a larger molecule with increased van der Waals attraction at the distal part of the heteroaryl group as well as the 4-aryl moiety. Moreover, a more negative potential at the proximal side of the heteroaryl fragment (that also tends to increase the hydrophilicity) further confers XO inhibitory activity.
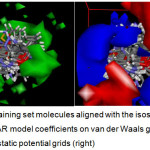 |
Figure 4: Training set molecules aligned with the isosurface of the 3D QSAR model coefficients on van der Waals grids (left) and electrostatic potential grids (right). Click here to View figure |
Conclusion
Quantitative structure-activity relationship (QSAR) studies have been carried out on a family of 4-aryl/heteroaryl-4H-fused pyrans that are active against xanthine oxidase, a crucial enzyme in the production of uric acid in the body. The QSAR model created by performing multiple linear regression analysis on a dataset consisting of 41 compounds, with over 4000 Dragon-type descriptors each, unveils the crucial molecular properties that confer XO inhibitory action. In particular, the Randic Shape Index Path/Walk 3 (PW3), and the size descriptor P_VSA-like on van der Waals Volume, bin 3 (P_VSA_v_3), which are highly significantly correlated with hydrophilicity and molecular size, respectively, account for three quarters of the variation in IC50 values. A more spherical, hydrophilic, and larger fused pyran tends to be a more active XO inhibitor. This is in accord with Comparative Molecular Field Analysis (CoMFA), which points to a compound with larger heteroaryl fragment that enhances van der Waals attraction at the distal end, and a negative functionality at its promixal side with respect to the pyran core. These findings provide useful insights in the design of more active drug candidates for hyperuricemia.
Acknowledgements
LTB acknowledges the Research Dissemination Grant of the University of the Philippines Manila. JBB is also grateful for the Professorial Chair 2016 awarded to him by the University of the Philippines Manila. The authors also acknowledge the computational facilities of EIDR, CAS, UP Manila (OVPAA-EIDR 12-001-121102).
References
- Crittenden, D.B.; Pillinger, M.H. Bull. NYU Hosp. Jt. Dis., 2011, 69, 257 – 263.
- Mapa, J.B.; Pillinger, M.H. Curr. Opin. Investig. Drugs., 2010, 11, 499 – 506.
- Borges, F.; Fernandes, E.; Roleira, F. Curr. Med. Chem., 2002, 9(2), 195 – 217.
CrossRef - Okamoto, K.; Kawaguchi, Y.; Eger, B.T.; Pai, E.F.; Nishino, T. J. Am. Chem. Soc., 2010, 132(48), 17080 – 17083.
CrossRef - Kim, B.S.; Serebreni, L.; Hamdan, O.; Lan Wang, L.; Parniani, A.; Sussan, T.; Stephens, R.S.; Boyer, L.; Damarla, M.; Hassoun, P.M.; Damico, R. Free Radic. Biol. Med., 2013, 60, 336 – 346.
- Pacher, P.; Nivorozhkin, A.; Szabó, C. Pharmacol. Rev., 2006, 58(1), 87 – 114.
CrossRef - Hille, R.
Eur. J. Inorg. Chem., 2006, 10, 1913 – 1926.
CrossRef - Biagi, G.; Giorgi, I.; Pacchini, F.; Livi, O.; Scartoni, V. II Farmaco, 2001, 56(11), 809 – 813.
CrossRef - Robins, R.K.; Revankar, G.R.; O’Brien, D.E.; Springer, R.H.; Albert, T.N.A.; Senga, K.; Miller, J.P.; Streeter, D.G. J. Heterocycl. Chem., 1985, 22(3), 601 –634.
CrossRef - Oettl, K.; Reibnegger, G. Biochim. Biophys. Acta, 1999, 1430(2), 387 – 395.
CrossRef - Harrison, R. Drug Metab. Rev., 2004, 36(2), 363 – 375.
CrossRef - Boueiz, A.; Damarla, M.; Hassoun, P.M. Am. J. Physiol. Lung Cell. Mol. Physiol.,
2008, 294(5), 830 – 840.
CrossRef - Okamoto, K.; Eger, B.T.; Nishino, T.; Pai, E.F.; Nishino, T. Nucleosides, Nucleotides Nucleic Acids., 2008, 27(6), 888 – 893.
CrossRef - Sorbera, L.A.; Revel, L.; Rabasseda, X.; Castaner, J. Drugs of the Future, 2001, 26(1), 32 – 38.
CrossRef - Ishibuchi, S.; Morimoto, H.; Oe, T.; Ikebe, T.; Inoue, H.; Fukunari, A.; Kamezawa,
M.; Yamada, I.; Naka, Y. Bioorg. Med. Chem. Lett., 2001, 11(7), 879 – 882.
CrossRef - Matsumoto, K.; Okamoto, K.; Ashizawa, N.; Nishino, T. J. Pharmacol. Exp. Ther.,
2011, 336(1), 95 – 103.
CrossRef - Dhiman, R.; Sharma, S.; Singh, G.; Nepali, K.; Bedi, P.M.S. Arch. Pharm. Chem. Life Sci., 2013, 346(1), 7 – 16.
CrossRef - Nepali, K.; Singh, G.; Turan, A.; Agarwal, A.; Sapra, S.; Kumar, R.; Banerjee, U.C.; Verma, P.K.; Satti, N.K.; Gupta M.K.; Suri, O.P; Dhar, K.L. Bioorg. Med. Chem., 2011, 19(6), 1950 –1958.
CrossRef - Nepali, K.; Agarwal, A.; Sapra, S.; Mittal, V.; Kumar, R.; Banerjee, U.C.; Gupta, M.K.; Satti, N.K.; Suri, O.P.; Dhar, K.L. Bioorg. Med. Chem., 2011, 19(18), 5569 – 5576.
CrossRef - Sharma, S.; Sharma, K.; Ojha, R.; Kumar, D.; Singh, G.; Nepali, K.; Bedi, P.M.S. Bioorg. Med. Chem. Lett., 2014, 24(2), 495 – 500.
CrossRef - Shukla, S.; Kumar, D.; Ojha, R.; Gupta, M.K.; Nepali, K.; Bedi, P.M.S. Arch. Pharm. Chem. Life Sci., 2014, 347(7), 486 – 495.
CrossRef - Bajaj, K.; Burudkar, S.; Shah, P.; Keche, A.; Ghosh, U.; Tannu, P.; Khanna, S.; Srivastava, A.; Deshmukh, N. J.; Dixit, A.; Ahire, Y.; Damre, A.; Nemmani, K. V. S.; Kulkarni-Almeida, A.; B-Rao, C.; Sharm, R.; Sivaramakrishnan, H. Bioorg. Med. Chem. Lett. 2013, 23(3), 834 – 838.
CrossRef - Sathisha, K.R.; Khanum, S.A.; Chandra, J.N.N.S.; Ayisha, F.; Balaji, S.; Marathe, G. K.; Gopal, S.; Rangappa, K. S. Bioorg. Med. Chem. Lett., 2011, 19(1), 2011 – 2020.
- Leigh, M.; Raines, D.J.; Castillo, C.E.; Duhme-Klair, A.K. ChemMedChem, 2011, 6(6), 1107 -1118.
CrossRef - Hu, L.; Hu, H.; Wu, W.; Chai, X.; Luo, J.; Wu, Q. Bioorg. Med. Chem. Lett., 2011, 21(13), 4013 – 4015.
CrossRef - Kaur, R.; Naaz, F.; Sharma, S.; Mehndiratta, S.; Gupta, MK.; Bedi, PMS.; Nepali, K. Med. Chem. Res., 2015, 24(8), 3334 – 3349.
CrossRef - Warr, W.A. Some Trends in Chem(o)informatics. In: Chemoinformatics and Computational Chemical Biology, Bajorath J. Ed., Humana Press, New York, 2011, pp. 1 – 38.
- Billones, L.; Billones, J. Phil. Sci. Lett., 2013, 6(2): 231 – 240.
- Billones, L.; Billones, J. J. Chem. Pharm. Res., 2014, 6(8): 209 – 217.
- Cramer, R.D.; Patterson, D.E.; Bunce, J.D. J. Am. Chem. Soc., 1988, 110(18), 5959 – 5967.
CrossRef - Todeschini, R.; Consonni, V. Molecular Descriptors for Chemoinformatics, WILEY-VCH, Weinheim (Germany), 2009.
CrossRef - Efroymson, M.A. Multiple Regression Analysis. In: Mathematical Methods for Digital Computers, Ralston, A.; Wilf, H.S., Eds. New York: Wiley, 1960, pp. 191 – 203.
- Leach, A.R.; Gillet, V.J. Computational Models. In: An introduction to Cheminformatics, Revised Edition, Springer, The Netherlands, 2007, pp. 75 – 97.
CrossRef - Gong, G. J. Am. Stat. Assoc.,1986, 81(393), 108–113.
CrossRef - Osten, D.W. Chemom. 1988, 2(1), 39 − 48.
CrossRef - Clark, R.D.; Fox, P.C. J. Comput.-Aided Mol. Des., 2004, 18(7-9), 563 – 576.
CrossRef - Tabachnick, B.G.; Fidell, L.S. Multiple Regression. In: Using Multivariate Statistics. 5th Edition, London: Pearson/Allyn & Bacon, 2007, pp. 117 – 194.
- Randic, M. J. Chem. Inf. Comput. Sci., 2001, 41, 607 – 613.
CrossRef - Labute, P. J. Mol. Graph. Model., 2000, 18, 464 – 477.
CrossRef - Norinder, U. Calculated Molecular Properties and Multivariate Statistical Analysis. In: Drug Bioavailability. 2nd Edition. Vol. 40. van de Waterbeemd, H.; Testa, B. Eds., Weinheim: Wiley-VCH Verlag GmbH, 2009, pp. 375 – 401.
- Wold, S. Quant. Struct. Act. Relat., 1991, 10(3), 191–193.
Crittenden, D.B.; Pillinger, M.H. Bull. NYU Hosp. Jt. Dis., 2011, 69, 257 – 263
CrossRef

This work is licensed under a Creative Commons Attribution 4.0 International License.
![]()
A New Edition of Web of Science
Journal Impact Factor
2022: 0.5
Five Year: 0.8
Journal is Indexed in

Cabells Whitelist
![]()


