Mixed Ligand Complexes Derived from Isoniazid and Amino Acids; Preparation, Characterization and Anti-Tuberculosis Assay
Khawla M. Sultan Al-Juboori
Department of Chemistry, College of Education for Pure Science (Ibn Al-Haitham), University of Baghdad.
Corresponding Author E-mail: khawla.mohammed57@gmail.com
DOI : http://dx.doi.org/10.13005/ojc/330524
A range of mixed ligand complexes derived from the reaction of alanine (alan), glycine (gly) and isoniazid (ison) ligands with Cr+3, Co+2, Cu+2, Fe+3, and Ni+2 ions are reported. Complexes were characterized using a variety of techniques that include; FTIR, UV-Vis., HPLC, TGA, elemental analyses, chloride content, magnetic susceptibility, melting point and conductivity. The obtained results indicated the formation of complexes in a 1:1:1:1mole ratio of M:alan:gly:ison with the general formula [M(Gly)(Alan)(Ison)(H2O)nClw]Y (M = Cr+3, w = 2, n = 1, Y = Cl; Fe+3,w = 0, n = 3, Y = 3(NO3-); Co+2, w = 1, n = 2, Y = Cl; Cu+2, w = 0, n = 3, Y = 2(NO3-) and Ni+2 , w = 0, n = 3, Y = 2Cl).The analyses data indicated distorted octahedral geometries about metal centres. The bio-assay of the prepared complexes show a positive activity against normal tuberculosis bacteria. However, the complexes exhibit no activity against the resistance tuberculosis bacteria.
KEYWORDS:Mixed ligand complexes; Isoniazid; Amino acids; Preparation and characterisation;; Anti-tuberculosis assay
Download this article as:| Copy the following to cite this article: Al-Juboori K. M. S. Mixed Ligand Complexes Derived from Isoniazid and Amino Acids; Preparation, Characterization and Anti-Tuberculosis Assay. Orient J Chem 2017;33(5). |
| Copy the following to cite this URL: Al-Juboori K. M. S. Mixed Ligand Complexes Derived from Isoniazid and Amino Acids; Preparation, Characterization and Anti-Tuberculosis Assay. Orient J Chem 2017;33(5). Available from: http://www.orientjchem.org/?p=38053 |
Introduction
Isoniazid is an organic compound that available in different pharmaceutical forms, which used to prevent and treat both latent and active tuberculosis [1]. Tuberculosis is a public health disease that caused several millions deaths annually worldwide [2]. The number of infected people in this disease have increased, in particularly immunocompromised patients. These include those who co-infected with human immunodeficiency virus (HIV), and human who are receiving anti-tumour therapy or diabetes [3-5]. Therefore, this critical situation has stimulated scientist to develop and explore new strategies in drug discovery to generate new agents with best performance for human health. The aim of this work is explore the influence of incorporating isoniazid in complexation, as a ligand, on the activity of the prepared complexes against tuberculosis bacteria. A series of metal-based complexes were prepared and characterised by mixing isoniazid (the active drug) with some amino acids as bio-active materials in presence of the central metal ion that used as a linkage between drug and amino acids. The bio-assay study shows a positive activity against normal tuberculosis bacteria. However, the complexes exhibit no activity against the resistance tuberculosis bacteria.
Experimental
Chemicals were obtained commercially (Aldrich) and used as received using salt sources; CrCl3.6H2O, Fe(NO3)3.6H2O, CoCl2.6H2O, NiCl2.6H2O and Cu(NO3)2.6H2O. Solvents used in the synthesis were distilled from appropriate drying agent immediately prior to use.
Physical measurements
FTIR spectra were recorded as KBr discs using a Shimadzu 8400 S FTIR spectrophotometer from 4000-400 cm-1. Electronic spectra were measured from 200-1100 nm for 10-3 M solutions in DMSO at 25 °C using a Shimadzu 1700 spectrophotometer. HPLC analysis was performed on a Shimadzu LC-2010 AHT in Ibn Sina Company, Ministry of Industry, Baghdad, IRAQ. Melting points were obtained on an Electro-thermal Stuart melting point SMP40apparatus and are uncorrected. Elemental analyses (C, H, N) for metal complexes were carried out on a Perkin-Elmer 2400 Series-II analyzer at Materials Research Centre, Ministry for Science and Technology, Baghdad, IRAQ. Metals were determined using a Shimadzu (A.A) 680 G atomic absorption spectrophotometer. Chloride content was determined using potentiometer titration method on a 686-Titrp processor-665Dosimat-Metrohm Swiss. Conductivity measurements were made with DMSO solutions using a Philips PW at 25°C for complex concentration of 10-3 M. Magnetic susceptibility were measured with a Brucker magnet B.M.6 apparatus at 20°C. TGA analyses were performed by Linseis instrument. Biological assay of the complexes was conducted in Baghdad Health City, Tuberculosis Treatment Centre where the drug resistance bacteria and ordinary one are obtained from. Primary isolation and culturing of mycobacterium from sputum specimens were followed according to standard procedures [6]. Drug susceptibility testing against isoniazid was performed by the proportional method on Löwenstein-Jensen media at concentrations of 0.2, 0.4 and 2.0 μg/ml, respectively. Drug resistance was defined as greater than 1% growth in the presence of 0.1 μg of isoniazid per millilitre [7, 8].
NaHPO4 standard buffer solution (0.02M) and acetonitrile were used in the HPLC analysis. For each ligand, a series of three dilutions in water ranged between 0.0001-0.01M were used to perform a calibration curve against the peak area with the following operational conditions;(i) column C18 with dimensions 250*4.6mm and pore 5µm, (ii) the mobile phase was [89% NaH2PO4 (0.02M) buffer standard solution pH=5 + 11% acetonitrile] for isoniazid determination and 5% acetonitrile in water solution for amino acid determination, (iii) the flow rate was 1.5 ml/min for isoniazid, while 1 ml/min for amino acids and, (iv) the UV detector wave length was 259 nm in isoniazid and 210 nm for amino acids. The injection volume was 20 µL and the operational temperature was 40°C. Alanine, glycine and isoniazid showed peaks with retention time 6.23, 6.74 and 5.40 minute, respectively.
General method for preparation of complexes
The complexes were prepared adopting a similar method and as follows;
To a solution of (0.01 mole) of the metal salt dissolved in 10-20 ml of deionized water, was added gradually with stirring a mixture of (0.01 mole) of each ligand dissolved in 10 ml of deionized water. The reaction mixture was left stirring for 4 h, and then the solution was allowed to evaporate on a water bath. The concentrated solution was left to stand and a coloured solid that formed was filtered, washed with cold water (3 ml), and then recrystallized from EtOH/H2O. The coloured solid was dried under vacuum. Melting points, colours and yields of the products are listed in Table (1).
Table 1: physical properties of the ligands and prepared complexes.
| Comp. | Yield % | Colour | m.p. °C | Free Cl–/mole | Micro analysis Found (calcd.) % | HPLC retention time (min.) | m S.cm2 .mol-1 | ||||
| M | C | H | N | Cl | |||||||
| Cr | 68 | Purple | 185 | 1 | 10.89(10.47) | 27.66(27.38) | 4.43(4.27) | 14.66(14.42) | 22.27(21.79) | – | 39.1 |
| Fe | 59 | Light- brown | 275 | – | 9.35(9.12) | 22.12(21.79) | 4.22(3.98) | 18.76(18.37) | – | – | 111.8 |
| Co | 65 | Pink | 155 | 1 | 12.64(12.28) | 28.34(28.10) | 4.76(4.43) | 15.02(14.76) | 15.21(14.87) | – | 60.9 |
| Cu | 53 | Green- blue | 330 | – | 11.70(11.24) | 24.34(24.07) | 4.64(4.38) | 18.06(17.81) | – | – | 54.7 |
| Ni | 77 | Light- blue | 280 | 2 | 12.10(11.82) | 27.24(26.97) | 5.20(5.02) | 14.44(14.25) | 14.62(14.18) | – | 48.2 |
| Iso | – | – | – | – | 5.9 | – | |||||
| Ala | – | – | – | – | 6.2 | – | |||||
| Gly | – | – | – | – | 6.8 | – | |||||
Results and Discussion
The mixed ligand complexes were obtained in good yields in a one-pot approach using an aqueous medium. The complexes were prepared from the reaction of Cr+3, Co+2, Cu+2, Fe+3, and Ni+2 with the amino acid ligands (alanine and glycine) and isoniazid. The mixed ligand complexes were prepared from mixing of 10 mmole of metal salt and 10 mmole of each ligand in an aqueous medium. A range of techniques were used to confirm the entity of the prepared compounds. These include FT-IR spectra (Table 2), UV–Vis (Table 3), HPLC, elemental analyses, chloride content, conductance, melting point and magnetic moment measurements. The conductance measurements in DMSO indicated that all complexes are electrolyte [9], see Table (1), complexes are electrolyte. These measurements agree well with the following formulas:
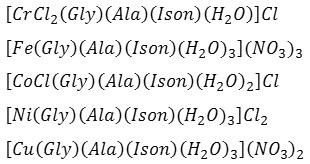
The physico-chemical data indicated the formation of complexes with the general formulae [M(Gly)(Alan)(Ison)(H2O)nClw]Y (M = Cr+3, w = 2, n = 1, Y = Cl; Fe+3,w = 0, n = 3, Y = 3(NO3–);Co+2, w = 1, n = 2, Y = Cl; Cu+2, w = 0, n = 3, Y = 2(NO3–) and Ni+2, w = 0, n = 3, Y = 2Cl). Complexes were isolated as solids, air-stable that showed solubility in high polar solvents such; H2O, DMF, DMSO, and insoluble in the low polar ones. The coordination spheres of the complexes were assumed from their spectra (FTIR, UV-Vis), magnetic susceptibility, HPLC, metal and chloride content and TGA, see Figure 1.
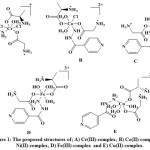 |
Figure 1: The proposed structures of; A) Cr(III)-complex, B) Co(II)-complex, C) Ni(II)-complex, D) Fe(III)-complex and E) Cu(II)-complex. Click here to View figure |
HPLC and chloride content analysis
HPLC technique was used to clarify the amount of the unreacted organic ligands after complex formation. The HPLC data of glycine (gly), alanine (alan), and isoniazid (ison) have shown retention times of 6.75, 6.23and 5.88 min., respectively. A calibration curve based on a series of standard organic ligands in aqueous solutions was established. The HPLC data indicated that; there is no free ligands remain after the reaction of 1 equivalent of metal ion in an aqueous solution with a mixture of 1 equivalent of each ligand, confirming the involvement of the three ligands in complexation, equation (1):
![]()
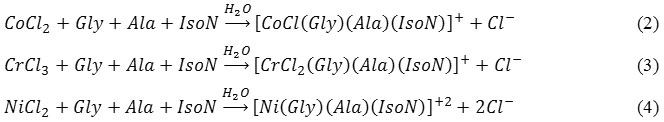
The analytical data of checking on the ionic chloride content using AgNO3 solution indicated the precipitation of a 1 equivalent of chloride ion in the Co(II) and Cr(III) complexes, and 2 equivalents in the Ni(II). Therefore, the previous stoichiometry equation for these complexes can be redraw as follows, equation (2-4):
FT-IR spectra
The FTIR data of the complexes and their ligands are listed in Table (2). The FTIR spectra of the free alanine and glycine amino acid display peaks at 1593, 1412 and 1595 and 1412 cm-1assigned to νas(COO–) and νs(COO–), respectively. These bands were shifted to higher frequencies in the spectra of Cr(III), Co(II), Fe(III) and Ni(II) (Figures (1, 2, 4 and 5)) and appeared in the range 1595-1618 and 1412-1418 cm-1 for νas(COO–) and νs(COO–), respectively. However, in the Cu(II)-complex, Figure (3), these bands were shifted to lower frequencies and appeared at 1580 and 1416 cm-1. The shift to higher wave number, compared with that in the free amino acid ligands, can be attributed to a weak linkage between the carboxylate groups in the amino acids and metal ion. While, shifting to lower wave number, compared with that in the free amino acid ligands, is related to delocalisation of metal electron density (t2g) to the π-system of the ligands [10]. The differences between the asymmetric and symmetric vibration of -COO– group for both amino acids in all complexes is laying between 164-206 cm-1. This is in accordance with results indicated the carboxylate group coordinated to a metal ion in a monodentate fashion [11]. The spectra of complexes indicated peaks around ca. 3100 cm-1, similar to that recorded in the spectra of amino acid ligands, which assigned to ν(NH3+) group. This result indicated that amino acid ligands behaved as a zwitterion species upon complexation. Therefore, they behave as neutral ligands.
The FTIR spectrum of isoniazid shows peak at 3304 cm-1 related to ν(N-H) group. This peak appeared as a broaden in the spectra of the complexes, indicating the involvement of the nitrogen atom in complexation. Further, the FTIR spectrum indicated peak at 1668 cm-1 assigned to ν(C=O) group. This band was shifted to lower frequency in all complexes, except that for Cu(II)-complex, which shifted to higher frequency. This shifting indicated the involvement of the isoniazid moiety in complexation. More, the isoniazid moiety coordinate to the metal centre as a neutral species. The spectra of the complexes revealed new peaks in the range 400-430 and 459-511 cm-1 that assigned to ν(M-N) and ν(M-O), respectively, which indicated that both the nitrogen of isoniazid and carboxylate of amino acids were coordinated to the metal centre [12]. Further, the spectra of ligands and complexes indicated a strong hydrogen bonding that appeared as medium broad band above 3400 cm-1. Further, this band includes the (OH) and (NH) stretching of the water and the amine fragments. In the Fe(III) and Cu(II) complexes, the spectra indicated peaks at 1517-1560 and1334-1342 cm-1 related to the ionic NO3–group, see Table (2).
Table 2: IR frequencies (cm–1) of the compounds.
| Comp. | νasy(COO-) | νsym(COO-) | νasy(NH3+)Ala, Gly | νsy (NH3+)Ala, Gly | Ala ν (NH3+) | Gly- ν (NH3+) | ν(N-H) | ν(C=O) | ν(M-N) | ν(M-O) | Δ(νas-νsy) |
| Ala | 1593 | 1412 | – | 2604 | |||||||
| Gly | 1595 | 1412 | 3159 and 3078 | 2823 | 2604 | 3304 | |||||
| Ison | 1668 | ||||||||||
| Cr | 1618 | 1412 | 3103 | 2617, 2729 | 2823 | 1649 | 1668 | 415 | 496 | 206 | |
| Co | 1595 | 1418 | -3123 | 2619, 2870 | 2617 | 2729 | 1668 | 415 | 496 | 177 | |
| Cu | 1580 | 1416 | 3200 and 3000 | 2610, 2830 | 2619 | 2870 | 1668 | 415 | 496 | 164 | |
| Fe | 1608 | 1418 | 3196 and 3062 | 2610, 2839 | 2610 | 2830 | 1668 | 415 | 496 | 190 | |
| Ni | 1595 | 1412 | 3127 and 3055 | -, 2866 | 2610 | 2839 | 1668 | 415 | 496 | 183 |
Electronic spectra and magnetic moment measurement
The electronic spectra of the complexes exhibited bands related to the π → π* and n → π*transitions. The Cr(III)-complex showed additional peaks at 552 and 683 nm related to4A2g(F)→4T1g(F) and 4A2g(F)→4Tg(F) transitions, respectively indicating an octahedral arrangement about metal centre [13]. The magnetic moment value 3.73 BM confirmed octahedral geometry around metal ion [12]. The Co(II)-complex, showed additional peaks at 462 and 502 nm, type 4T1g(P)→4T1g(P) and 4T1g(F)→4A1g(F), respectively. This result with the magnetic moment value 4.45 BM confirmed an octahedral geometry around Co atom [14]. The Cu(II)-complex, Figure (8), showed additional peaks at 710 nm correlated to 2Eg→2T2g transition that confirmed a distorted octahedral arrangement about the Cu atom. The magnetic moment value 1.72 BM confirmed octahedral geometry around metal ion [15]. The Fe(III) and Ni(II)-complexes, Figures (9 and 10), showed additional peaks at 520, 380 and 630 nm, type 6A1g→2Eg(G), 3A2g→3T1g(P) and A2g→3T1g, respectively. The magnetic moment values 4.33 and 2.88 BM confirmed distorted octahedral geometries around Fe(III) and Ni(II) centres, respectively [16] (see Table 3).
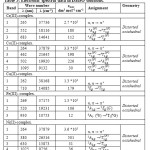 |
Table 3: Electronic spectral data in DMSO solutions. Click here to View table |
Thermal decomposition of Fe(III) and Ni(II)complexes
The TGA thermal analysis curve for [Fe(Ala)(Gly)(Ison)(H2O)3](NO3)3 complex is shown in Figure 2. The complex decomposes in three steps, from 90 to 594.9ºC. The complex undergoes a rapid decomposition and weight loss initially at 160.3 ºC (obs. = 12.0833%, calc.=11.9518%) related to loss (3H2O+NH3) molecules. This mass loss could be attributed to the elimination of and ammonia species. This is in agreement with results reported previously in literature [16-18]. The second decomposition step refers to the loss of (C6H5N+CO+N2H2+3CO2+O2+CH3CN) segment with weight loss (obs. =57.1328, calc. =56.8975%), at 323ºC). The final weight of the compound observed with 28.8015 (calc.=30.43775%) related to (Fe+ H3O+3NO).
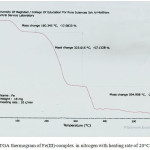 |
Figure 2: TGA thermogram of Fe(III)-complex in nitrogen with heating rate of 20 °C min–1. Click here to View figure |
The TGA thermal analysis curve for [Ni(Ala)(Gly)(Ison)(H2O)3]Cl2complex is depicted in Figure 3. The complex decomposed in three steps, from 95 to 593.7ºC. The complex undergoes a rapid decomposition and weight loss at (obs. = 11.8463%, calc.=11.2028%). The mass loss occurred may relate to losing of 3H2O molecules, which related to the loss of three aqua water molecules. This is in agreement with results reported previously in literature [9,10]. The second and third decomposition steps refer to the loss of (2CO2+2N2+CO) and (C6H5N+Cl2) molecules, with weight loss (obs. = 35.3517, calc. = 35.2697 %), at 454.5 ºC) and (obs. = 30.5574, calc. = 31.1203 %), at 593.7 ºC, respectively.
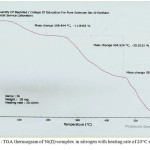 |
Figure 3: TGA thermogram of Ni(II)-complex in nitrogen with heating rate of 20 °C min–1. Click here to View figure |
The differences in the calculated and observed weight may be related to oxidation upon thermal decomposition. This is in agreement with results reported previously in literature [19, 20].
Biological assay
The biological assay data of the complexes against sensitive and resistance tuberculosis bacteria are listed in Table (4). The obtained results indicated the complexes have a similar activity, compared with the original isoniazid drug which is active against sensitive bacteria and did not affect the resistance ones, see Figure 4. This may indicate that upon testing complexes, in vivo or in vitro, they intend to liberate the isoniazid drug in to the biological system. This will lead to the formation of more stable complexes in which the amino acids act as a bidentate chelate ligand. Further, this result may indicate the need to examine the formation of complexes at different pH and elucidate the geometry and stability of complexes, forming upon testing stable complexes containing isoniazid ligand.
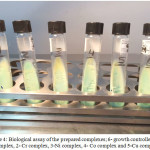 |
Figure 4: Biological assay of the prepared complexes;6- growth controller, 1- Fe complex, 2- Cr complex, 3-Ni complex, 4- Co complex and 5-Cu complex. Click here to View figure |
Table 4: Biological assay of the prepared complexes.
| Compound |
Bacteria growth |
|
|
Resistance |
Sensitivity |
|
|
Cr |
– |
+ |
|
Co |
– |
+ |
|
Cu |
– |
+ |
|
Fe |
– |
+ |
|
Ni |
– |
+ |
|
Iso |
– |
+ |
Conclusion
In this paper, the synthesis of mixed ligands complexes derived from two amino acids and isoniazid ligands are reported. The complexes were prepared by mixing with stirring an equivalent amount of each amino acids and isoniazid with the appropriate metal chloride or nitrate salts. Physico-chemical analysis indicated the formation of six coordinate species in which the geometry around metal centre is a distorted octahedral. Bio-assay study revealed these complexes showed a similar effect against tuberculosis bacteria, compared with the isoniazid compound.
References
- Pilon, S. Medicines Sans Frontieres. 2016.
- Schmir, K. M.; Wansaula, Z.; Prarr,R, F.; Price, S.; Langer, A. J., Centers for Disease Control and Prevention, Morbidity and Mortality Weekly Report. 2017, 66, (11), 289- 309.
- Harries, A.; Maher, D.; Graham, S. TB/HIV a Clinical Manual, 2nd edition, WHO Library Cataloguing-in-Publication Data. 2004.
- Christopoulos, A.; Katsarou, I.; Christopoulos, I., Eur. Respir. J. 2013, 42, (57), 4490.
- Pereira, S.; Araujo, G.; Santos, C.; Oliveira, M.; Barreto, M. Revista de Saude Publica. 2016, 50, (82), 1-7.
- Espasa, M.; González-Martín, J.; Alcaide, F.; Aragón, L. M.; Lonca, J.; Manterola, J. M.; Salvadó, M.; Tudó, G.; Orús, P.; Coll, P. J Antimicrob. Chemother. 2005, 55, (6): 860-865.
CrossRef - Merza, M.; Farnia, P.; Salih, A.; Masjedia, M.; Velayatia, A. Chemotherapy. 2010, 56, (3), 248-257.
CrossRef - Velayati, A.; Farnia, P.; Masjedi, M.; Ibrahim, T.; Tabarsi, P.; Haroun, R. Eur. Respir. J. 2009, 34, (5), 1202-1203.
CrossRef - Geary, W.J., Coord. Chem. Rev. 1971, 7, (1), 81–122.
CrossRef - Poggi, M.; Barroso, R.; Costa-Filho,A. J.;de Barros, H. B.;Pavan, F.;Leite, C. Q.;Gambino, D.; Torre, M. H. J. Mex. Chem. Soc. 2013, 57, (3), 198-204.
- Al-Jeboori, M. J.; Al-Dujaili, A. H.; and Al-Janabi, A., Transition Metal Chemistry. 2009, 34, (1), 109-113.
CrossRef - Ahmed, R. M.; Hamdan, T. A.; Numan, A. T.; Al-Jeboori, M. J.; Potgieter, H. Complex Met. 2014, 1, 1, 38-45,
- Ahmed, R. M.; Yousif, E. I.; Hasan, H. A.; Al-Jeboori, M. J. The Scientific World Journal: Inorganic Chemistry. 2013, 2013, 1-7.
CrossRef - Sancak, K.; Mustafa Er.; Unver, Y.; Yildirim, M.; Degirmencioglu, I. Transition Metal Chemistry. 2007, 32, 16-22.
CrossRef - Abdul-Ghani, A. J.; Al-Jeboori, M. J.; Al-Karawi, A.J. J. Coord. Chem., 2009, 62, 16, 2736–2744.
CrossRef - Nakamoto, K. 2002, 5th edition, John Wiley and Sons Inc., New York.
- Ma, Q.; Zhu, M.; Feng, L. L.; Yan, Y. Inorg. Chem. Acta. 2011, 370, 102-107.
CrossRef - Rosadoa, M. S.; Leonor, M.; Duarte, R.S.; Fausto, R. Journal of Molecular Structure. 1997, 410-411, 343-348.
- Rosadoa, M. S.; Leonor,M.; Duarte, R.S.; Fausto, R. Vibrational Spectroscopy. 1999, 16, 35–54.
CrossRef - Guanasekaran, S.; Sailatha, E.; Seshadri, S.; Kumaresan, S. Indian Journal of Pure & Applied Physics. 2009, 47, 12-18.

This work is licensed under a Creative Commons Attribution 4.0 International License.
![]()
A New Edition of Web of Science
Journal Impact Factor
2022: 0.5
Five Year: 0.8
Journal is Indexed in

Cabells Whitelist
![]()


