Metal Distribution at River Water of Mining and Nickel Industrial Area in Pomalaa Southeast Sulawesi Province, Indonesia
Ilham1,4, Djoko M. Hartono2, Emirhadi Suganda1 and Muhammad Nurdin3
1School of Environmental Science, Universitas Indonesia, Jl. Salemba Raya, Jakarta10430 – Indonesia.
2Faculty of Engineering, Universitas Indonesia, Depok 16424 – Indonesia.
3Department of Chemistry, Faculty of Mathematics and Sciences, Universitas Halu Oleo, Kampus Hijau Bumi Tridharma Anduonohu Kendari 93232 – Southeast Sulawesi, Indonesia.
4Faculty of Engineering, Universitas Halu Oleo, Kampus Hijau Bumi Tridharma Anduonohu Kendari 93232 – Southeast Sulawesi, Indonesia.
Corresponding Author E-mail: ilham.arst.unhalu@gmail.com
DOI : http://dx.doi.org/10.13005/ojc/330557
Nickel mining industrial activity in Pomalaa, Southeast Sulawesi Province – Indonesia has provided revenue for government and community. However, this mining has caused impact for an environmental issue. This study aims to analyze river quality in the nickel mining industrial area in Pomalaa. The Total Suspended Solid (TSS) parameter was tested by a gravimetric technique, Fe ions were analyzed by spectrophotometry, and Cr, Cd, Zn, Cu, Ni, Co, and Pb were performed by Atomics Absorbance Spectroscopy (AAS) to analyze of. Subsequently, the determination of pH was compared to an Indonesia standard parameter (SNI 06-6989.11-2004). It was performing an evaluation towards the Pollutant Index (PI) value were 0 ≤ PIj ≤ 1.0 (good condition), 1.0 < PIj ≤ 5.0 (lightly polluted), and PIj> 10 (heavily polluted). The result shows that the seven rivers located around Pomalaa nickel mining industrial area are still categorized in a good condition for conducting the mining activity, but Huko-huko river has been categorized lightly polluted because of the impact activity of nickel industrial processing. The quality of Kumoro and Puuroda rivers are still in a good condition for mining activity, processing, and as the second class water quality standard. However, the water quality of Baula, Huko-huko, Pesouha, Sopura, and Oko-oko rivers are categorized to be lightly polluted at which functions as facilities and infrastructure of water recreation, freshwater fish farming, livestock, and irrigation. Meanwhile, the water quality of the Kumoro and Puuroda rivers are still in a good condition.
KEYWORDS:Mining; Industry; Nickel; River; Pomalaa
Download this article as:| Copy the following to cite this article: Ilham I, Hartono D. M, Suganda E, Nurdin M. Metal Distribution at River Water of Mining and Nickel Industrial Area in Pomalaa Southeast Sulawesi Province, Indonesia. Orient J Chem 2017;33(5). |
| Copy the following to cite this URL: Ilham I, Hartono D. M, Suganda E, Nurdin M. Metal Distribution at River Water of Mining and Nickel Industrial Area in Pomalaa Southeast Sulawesi Province, Indonesia. Orient J Chem 2017;33(5). Available from: http://www.orientjchem.org/?p=38812 |
Introduction
An abundant potential of metal mineral resources in Indonesia consists of ferrous and many others (iron, nickel, cobalt, base metal, and rare earth metal)[i],[ii]. Indonesia is the second biggest country which produces nickel after Russia[iii]. Sulawesi, Kalimantan, and Papua are an area having an abundant potential of nickel by a reserve of 577 million tons ore[iv]. Therefore, it was interested by mining companies for exploration the mining activity. In Southeast Sulawesi Province since 2014, the government has published 113 Mining Business Permit (IUP) for nickel commodity and 11 among them is located in Kolaka District.
The implementation of Indonesia Law No. 4/2009 on Mineral and Coal Mining, the mining companies were encouraged to build a smelter and the nickel export activity only permitted in the level of <1.7% so several companies have an IUP to stop an exploration and exploitation activity. One of them the PT. Aneka Tambang Tbk. (Antam) has still existed for exploration and exploitation of nickel ore because it has smelter building in Pomalaa area.
Mining activity is not only having the potential for increasing revenue and community’s income but also giving bad effect on the environmental baseline. Change of environmental setting continuously happens in all aspects of the living environment, physical, chemical, and biological environment, as well as socio-community. Elzbieta et al. explained that it needs to be pursued a balance between economic improvement and social needs, as well as environment protection in mining activity and mineral industry[v]. To know how well this change, environmental quality monitoring should be done on an ongoing basis. It does to see the change occur and recovery of environmental quality.
This study aims to analyze the quality of river water located in the area of mining and nickel industry Pomalaa– Southeast Sulawesi, so it can be a material for the quality improvement of river water in that area.
Experimental Method
The first stage to do was taking a sample of river water located in the area of Pomalaa mining and nickel industry. The next stage, it was testing in the Kendari Health laboratory. A method specification performed to test Total Suspended Solid (TSS) was through gravimetric, parameter of Ferro (Fe) through spectrophotometry, the parameter of Cr, Cr6+, Cd, Zn, Cu, Ni, Co, and Pb trough method specification of AAS, as well as parameter of pH are suitable for SNI 06-6989.11-2004.
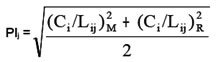
Furthermore, water quality status was assessed by the water pollution index method referring to the Minister of Environment Decree No. 115/2003 on Guidelines for Determination of Water Quality Status[i]. The water pollution index was calculated by the following measures. The formula in Excel was used for calculation:
Selection of parameters that exist in the water quality standard
Calculation of Ci/Li for each parameter of every sampling location. Ci is a measure of water quality parameter. Li is standard water quality for each parameter.
The use of measurement (Ci/Li) is if the value smaller than 1.0, and the use of (Ci/Li)new if the value of (Ci/Li)measurement greater than 1.0. (Ci/Li)new = 1.0 + P log (Ci/Li)measurement
Determination of the average value and the maximum value of the overall Ci/Li [(Ci/Li)R and (Ci/Li)M].
Determination of water pollution index:
|
Pollution Index of Water Quality Status |
|
|
0 ≤ Pij ≤ 1.0 |
Meet quality standards (good) |
|
1.0 < Pij ≤ 5.0 |
Lightly polluted |
|
5.0 < Pij ≤ 10 |
Moderately polluted |
|
Pij > 10 |
Heavily polluted |
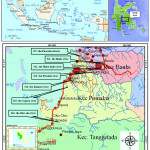 |
Figure 1: Location of the research, Baula sub-district, Pomalaa sub-district, and Tanggetada sub-district, Kolaka District, Southeast Sulawesi, Indonesia. Click here to View figure |
Results and Discussion
River water quality measurement was done at mining and nickel industrial area covering to seven rivers in the area of Baula, Pomalaa, and Tanggetada. Those seven rivers are the Baula, Huko-huko, Pesouha, Kumoro, Sopura, Oko-oko, and Puuroda estuary.
Standard of river water quality in mining and nickel industry area according to the Regulation of Minister of Environment No. 9/2006 on discharge standards for business/ore mining nickel activity[i], and Government Regulation No. 82/2001 on water quality management and water pollution control6. The result of river water quality measurement in the area of Pomalaa can be seen in Table 2.
Table 2. River Water Quality at Pomalaa Area
|
No |
Parameter |
Unit |
Result |
Quality Standard |
||||||||
|
St. 1 |
St. 2 |
St. 3 |
St. 4 |
St. 5 |
St. 6 |
St. 7 |
Minister Regulation of Environment No. 9/2006 |
Government Regulation No. 82/2001 |
||||
|
Mining |
Processing |
The second class water quality standard |
||||||||||
|
1 |
Total Suspended Solid (TSS) |
mg/L |
97 |
190 |
43 |
14 |
67 |
53 |
48 |
200 |
100 |
50 |
|
2 |
Degree of Acidity (pH) |
– |
7.84 |
7.98 |
7.99 |
7.06 |
7.23 |
7.11 |
6.79 |
6-9 |
6-9 |
6-9 |
|
3 |
Iron (Fe) |
mg/L |
0.16 |
0.54 |
0.4 |
0.15 |
1.7 |
0.36 |
0.22 |
5 |
5 |
0.3 |
|
4 |
Chromium (Cr) |
mg/L |
0.0026 |
0.0088 |
0.0025 |
0.0038 |
0.0192 |
0.0106 |
0.0029 |
0.5 |
0.5 |
|
|
5 |
(Cr 6+) |
mg/L |
0.0018 |
0.0065 |
0.0021 |
0.0028 |
0.0158 |
0.0117 |
0.0035 |
0.1 |
0.1 |
0.05 |
|
6 |
Cadmium |
mg/L |
0.0038 |
0.0072 |
0.0022 |
0.0027 |
0.0185 |
0.0105 |
0.0033 |
0.05 |
0.05 |
0.01 |
|
7 |
Zinc (Zn) |
mg/L |
0.0144 |
0.0239 |
0.0096 |
0.0048 |
0.0411 |
0.0317 |
0.0133 |
5 |
5 |
0.05 |
|
8 |
Copper (Cu) |
mg/L |
0.0032 |
0.0086 |
0.0014 |
0.001 |
0.0067 |
0.0085 |
0.0025 |
2 |
2 |
0.02 |
|
9 |
Nickel (Ni) |
mg/L |
0.0086 |
0.0296 |
0.0128 |
0.0136 |
0.0368 |
0.031 |
0.0012 |
0.5 |
0.5 |
|
|
10 |
Cobalt (Co) |
mg/L |
0.0042 |
0.0286 |
0.0033 |
0.0038 |
0.0311 |
0.0162 |
0.0064 |
0.4 |
0.4 |
0.2 |
|
11 |
Lead (Pb) |
mg/L |
0.0005 |
0.0016 |
0.0008 |
0.0018 |
0.0018 |
0.0012 |
0.0008 |
0.1 |
0.1 |
0.03 |
Source: The result of measurement, 2016
Quality Standard
Minister Regulation of Environment No. 9/2006 on discharge standards for business/ore mining activity.
Government Regulation No. 82/2001 on Water Quality Management and Water Pollution Control.
Location of Water Sample Collection
St. 1. the Baula river S: 04° 09′ 33,6″ E: 121° 41′ 03,8″
St. 2. the Huko-huko river S: 04° 10′ 29,0″ E: 121° 38′ 57,8″
St. 3. the Pesouha river S: 04° 10′ 38,6″ E: 121° 38′ 34,4″
St. 4. the Kumoro river S: 04° 11′ 43,9″ E: 121° 35′ 58,0″
St. 5. the Sopura river S: 04° 16′ 01,2″ E: 121° 33′ 51,2″
St. 6. the Oko-oko river S: 04° 17′ 41,9″ E: 121° 33′ 35,1″
St. 7. the Puuroda estuary S: 04° 08′ 25,1″ E: 121° 37′ 04,8″
The result of water quality measurement at several rivers in the area of Pomalaa mining and nickel industrial is explained as follows:
Parameter that Has Exceeded Quality Standard
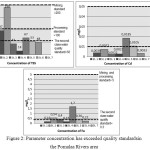 |
Figure 2: Parameter concentration has exceeded quality standardsin the Pomalaa Rivers area Click here to View figure |
The result of measurement was conducted at 7 rivers in the area of mining and nickel industry at Pomalaa. The TSS parameter of Huko-huko has exceeded the quality standard for nickel processing activity, i.e. 190 mg/L which has exceeded a threshold of the quality standard by 100 mg/L. According to Effendi, TSS has suspended materials with diameter > 1 µm restrained in a Millipore filtration with pore diameter by 0.45 µm[i]. TSS is commonly in the form of mud, fine sand, and any kinds of microorganism that are naturally caused by abrasion and erosion of land that goes into the water body. Casali et al. stated that sediment in the runoff coming from forest land is mostly affected by mining activity at which in the mining activity an amount of sediment in the water becomes increase[ii]. Sediment quality has been used as an important indicator of pollution since it is considered as a major sink for various pollutants. In addition, sediments are normally mixtures of several components and they can play a significant role in remobilization of contaminants in aquatic systems and interactions between water and sediments[iii]. If compared to the second class water quality standard which is suitable for Government Regulation No. 82/2001 on water utilization as facilities/infrastructure of water recreation, freshwater fish farming, livestock, and irrigation through standards of TSS by 50 mg/L, so TSS level in the Baula river (97 mg/L), the Huko-huko river (190 mg/L), the Sopura river (67 mg/L), and the Oko-oko river (53 mg/L) has exceeded quality standard.
Determination of iron parameter (Fe) in the river Huko-huko (0.54 mg/L), the river Pesouha (0.4 mg/L), the Sopura river (1.7 mg/L), and the Oko-oko river (0.36 mg/L) has exceeded the second class water quality standard having been assigned by 0.2 mg/L. However, in general, the level of iron (Fe) in those 7 rivers is still under the class water quality for mining and nickel processing activity. According to Johnson et al. The level of Fe which is more than 1 mg/L will cause skin and eye irritation, and if the solubility of iron in the water exceeds 10 mg/L, it will cause a foul smell in the water[iv],[v].
The level of Cadmium content in the Sopura River and the Oko-oko River reaches up to 0.0185 mg/L and 0.0105 mg/L respectively. It shows that it has exceeded the second class water quality standard (Government Regulation No. 82/2001) assigned by 0.01 mg/L, but for mining and nickel processing activity, it is still under water quality standard (Government Regulation of Living Environment No. 9/2006). Cadmium (Cd) is a heavy metal with a very wide deployment in nature. The importance of each source varied by metal; mine waste pile runoff contributed 70% of Cd, while mine drainage contributed 90% of Pb, and both sources contributed similarly to Zn loading[vi]. However, according to Tarigan et al. Cd tends to be poisonous and harms all of the living organism, including human being[vii]. Cd soluble in a 1% ppm can make aquatic biota die. Hefni et al. explained that Cadmium (Cd) is one of the types of harmful heavy metals for human blood vessels and may accumulate in vitals organs, especially liver and kidney[viii].
Heavy metals that leached out from these disposal points and may contaminate the groundwater, as well as surface water resources nearby area, could affect the health and livelihood of the local population[ix].
Parameter Which Has Not Exceeded Quality Standard
According to the measurement of water quality that has been conducted, it can be seen that 8 other parameters are still under the quality standard of water which is assigned, both discharge standards for business or activity of ore mining and quality standard of water quality management or water pollution control[i].
pH of all rivers located in the area of Pomalaa is still in the range suitable for environment quality standard, that is, in the range of 4-9 [ii]. It is affected by the number of termination of exploration that becomes higher and exploitation performed by companies holding IUP in that area. The pH in the active mining site tends to be very acidic as a result of mineral exposure and leaching through mining processes and excavation. Conversely, the water pH in the abandoned mining ponds shows a near-neutral pH range suggesting the presence of sufficient alkalinity (e.g. bicarbonate) buffer the pH known to be acidic years before the mining operations have ceased[iii].
Cr concentration in the rivers around the area of Pomalaa is still under the quality standard assigned (0.5 mg/L). The highest Cr concentration found in the Sopura river by 0.0192 mg/L and the lowest is in the Pesouha River by 0.0025 mg/L. Chromium (Cr), a heavy metal found in solid or mineral form and less than the other elements. The natural source of Cr is rock mineral erosion, a flow of water and settles in the sediment through absorption process15.
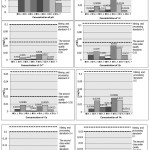 |
Figure 3: Parameter Concentration That Not Exceeded Quality Standard Click here to View figure |
Even though the concentration of Cr6+ in the rivers around Pomalaa area is still under a quality standard, but in the Sopura river and the Oko-oko river, it has reached up to 0.0158 mg/L and 0.0117 mg/L respectively. Chromium occurs in water with two predominant states: trivalent Cr3+ and hexavalent Cr6+ where the latter is more soluble than former one[i]. These both states can contaminate the surface water and even groundwater when there is no control to treat the industrial wastewater before contact with water resources. Because of the toxicity of Cr6+ even in low concentrations (>0.05 mg/L) on the human health, it is important to remove it from the water. There are many developed techniques for removing of Cr6+ ions from water: among them adsorption[ii],[iii],[iv],[v], membranes[vi],[vii], electrochemical precipitation[viii],[ix], and ion exchange[x],[xi].
The parameter of Zinc (Zn) has approached the second class water quality standard by 0.05 mg/L. It happens to the Sopura River and the Oko-oko Riber by 0.0411 mg/L and 0.0317 mg/L respectively. In the high level, Zinc tends to be poisonous, but conversely, it needs by an organism as a co-enzyme in the low level. Although mining operations removed much of the metal ore, the mine waste material remains elevated in labile Zn, Pb, and Cd, especially in fine particle size fractions[xii].
The parameter of copper (Cu) in the Huko-huko river and the Oko-oko river has approached the second class water quality standard which has been assigned by 0.02 mg/L. The level of Cu content in the Huko-huko river and in the Oko-oko river reaches up to 0.0086 mg/L and 0.0085 mg/L respectively. Copper (Cu) is a heavy metal that can be found in aquatic environments as well as in the sediments[xiii]. Cu belongs to the group of essential metals, at which in the low levels it needs of the organism as a coenzyme in the metabolism of the body, the new toxic nature appears in high levels[xiv].
The highest nickel concentration is in the Sopura River by 0.0368 while the lowest is in the Puuroda Estuary by 0.0012 mg/L. That concentration is still under the quality standard of environment for mining and nickel industrial activity by 0.5 mg/L. Hefni et al. explained that Nickel (Ni) found in the water is in the form of colloids. It is formed by insoluble hydrolyze mineral15.
Cobalt (Co) concentration in the seven rivers of Pomalaa area is still below the quality standard of an environment, both quality standard of mining and nickel industrial activity and the second class water quality standard (0.2 mg/L). The range of Co concentration in those rivers is about 0.0033 mg/L in the river Pesouha until 0.0311 mg/L in the Sopura river. Cobalt is a naturally occurring element found in rocks, soil, water, plants, and animals. It is an essential micronutrient required for the growth of both plants and animals[xv]. On the other hand, large amounts of cobalt can produce toxicological effects including vasodilation, flushing, and cardiomyopathy in humans and animals[xvi].
Pb concentration in the rivers around the area of Pomalaa is in the range of 0.0005 mg/L until 0.0018 mg/L which means that it is still under the quality standard of water for an activity of mining, nickel processing, and as the second class water quality standard. However, Pb concentration in nature has to get a serious attention as stated by Hefni et al. that Pb and As may cause a significant ecological effect on the sediment surface15.
The result of measurement of river water quality was then measured by using Water Pollution Index which is suitable for Ministerial Decree of Environment No.115/2003 on Guidelines for Determination of Water Quality Status6.
Table 3: River Pollution Index of Pomalaa Area
|
Station |
River’s name |
Pollution Index |
|||||
|
Mining Activity |
Processing Activity |
to Result in the Second Class Water quality standard |
|||||
|
Value of |
Evaluation |
Value of |
Evaluation |
Value of |
Evaluation |
||
|
1 |
Baula river |
0.354 |
Good |
0.698 |
Good |
1.786 |
Lightly Polluted |
|
2 |
Huko-huko river |
0.694 |
Good |
1.720 |
Lightly Polluted |
2.901 |
Lightly Polluted |
|
3 |
Pesouha river |
0.353 |
Good |
0.358 |
Good |
1.214 |
Lightly Polluted |
|
4 |
Kumoro river |
0.300 |
Good |
0.301 |
Good |
0.403 |
Good |
|
5 |
Sopura river |
0.301 |
Good |
0.507 |
Good |
3.555 |
Lightly Polluted |
|
6 |
Oko-oko river |
0.270 |
Good |
0.397 |
Good |
1.155 |
Lightly Polluted |
|
7 |
Puuroda estuary |
0.647 |
Good |
0.651 |
Good |
0.779 |
Good |
Source: The result of calculation, 2016
In Table 3, it is seen that 7 rivers located in the area of Pomalaa mining and nickel industry are still in a good condition for conducting mining activity. But, to conduct an activity of nickel industrial processing, the Huko-huko river has been categorized to be lightly polluted. As the second class water quality standard, water quality in these five rivers (the river Baula, the river Huko-huko, the river Pesouha, and the river Oko-oko) is categorized to be lightly polluted, while the quality of water in the river Kumoro and the river Puuroda is still good as the second class water quality standard. It is according to the Government Regulation No. 82/2001 on water quality management and water pollution control.
Several kinds of literature cite the importance of water quality index application in determination of river water quality status. Water quality index plays a major role in water quality assessment of a given source as a function of time and other influencing factors[i] (Poonam et al., 2015).
Conclusion
Water quality at seven rivers located in the area of Pomalaa mining and nickel industry Southeast Province is still in a good condition. The parameters which still under the quality standard are pH, Zn, Cu, Cr, Cr6+, Ni, Co, and Pb. While for TSS, Fe, and Cd parameter has exceeded the second class water quality standard since its function as facilities and infrastructure of water recreation, freshwater fish farming, livestock, and irrigation.
The seven rivers located in the area of Pomalaa mining and nickel industry are still in a good condition for mining activity, while in the river Huko-huko, it has been categorized to be lightly polluted to process nickel. As the second class water quality standard, five rivers are categorized to be lightly polluted such as Baula river, Huko-huko river, Pesouha river, Sopura river, and Oko-oko river, while the river water quality of Kumoro river and Puuroda river is still in a good condition.
Acknowlegement
We acknowledge the financial support of the Ministry of Research, Technology and Higher Education, the Republic of Indonesia.
References
- Nurdin, M.; Maulidiyah; Watoni, A.H.; Abdillah, N.; Wibowo, D. Int. J. ChemTech Res., 2016, 9, 483-491.
- Nurdin, M.; Zaeni, A.; Maulidiyah; Natsir, M.; Bampe, A.; Wibowo, D. Orient. J. Chem., 2016, 32, 2713-2721.
CrossRef - Kramadibrata, S. Procedia Earth & Planetary Sci., 2013, 6, 6–7.
CrossRef - Center for Data and Information Energy Mineral Resources. Jakarta: Department of Mining and Energy Mineral Resources, 2012, 1, 2-4.
- Elzbieta, P.S.; Uberman, R.; Kulczycka, J. Gospodarka Surowcami Mineralnymi-Mineral Resources Management, 2015, 31, 45-63.
- Hefni, E.; Romanto; Yusli, W. Procedia Environ. Sci., 2015, 24, 228 – 237.
- Rahmawati, K.; Widyastuti, M. Jurnal Bumi Indonesia, 2013, 2, 1-8.
- Effendi, H. Telaah Kualitas Air: Bagi Pengelolaan Sumberdaya Alam dan Lingkungan Perairan. Kanisius, Yogyakarta, 2003, 7, 64.
- Casali, J.; Gimenez, R.; Diez, J.; Álvarez-Mozos, J.; Lersundi, J.D.V.d.; Goni, M.; Campo, M.A.; Chahor, Y.; Gastesi, R.; Lopez, J. Agricultural Water Management, 2010, 97, 1683– 1694.
CrossRef - Zarei, I.; Pourkhabbaz, A.; Khuzestani, R.B. Environ. Monitoring & Assessment, 2014, 186, 6047–6060.
CrossRef - Johnson, V.; Peterson, R.; Olsen, K. Environ. Monitoring & Assessment, 2005, 110, 271–289.
CrossRef - Knobeloch, L. Environmental Health Perspectives, 2000, 108, 675-678.
CrossRef - Laurel A. S.; David B.S.; Emily R. E.; Daniel J. B.; James P. S. Sci. Total Environ., 2014, 490, 456–466.
CrossRef - Tarigan, Z.; Edward; Rozak, A. Makara Sains, 2003, 7, 119-127.
- Hefni, E.; Mujizat, K.; Mursalin; Dea, F.L. Procedia Environ. Sci., 2016, 33, 574-582.
- Tiwari, M.K.; Bajpai, S.; Dewangan, U.K.; Tamrakar, R.K. Karbala Int. J. Modern Sci., 2015, 1, 9-14.
CrossRef - Arham, Z.; Asmin, L.O.; Rosmini; Nurdin, M. Int. J. ChemTech Res., 2017, 33, 1164-1170.
- Paull, B.; Nesterenko, P.; Nurdin, M.; Haddad, P.R. Anal. Communic., 1998, 35, 17-20.
CrossRef - Kusin F.M.; Aris A.; Tengku Ismail T.; Harun R.; Abdullah A.; Ishak M. Springer, Singapore, 2014, 1, 369-373.
- Sarin, V.; Pant, K.K. Bioresource Technology, 2006, 97, 15-20.
CrossRef - Li, L.; Fan, L.; Sun, M.; Qiu, H.; Li, X.; Duan, H.; Luo, C. Colloids and Surfaces B: Biointerfaces, 2013, 107, 76–83.
CrossRef - Baral, S.S.; Das, S.N.; Rath, P. Biochemical Engineering Journal, 2006, 31, 216–222.
CrossRef - Gupta, V.K.; Rastogi, A.; Nayak, A. J. Colloid & Interface Sci., 2010, 342, 135-141.
CrossRef - Mohan, D.; Singh, K.P.; Singh, V.K. Industrial & Eng. Chem. Res., 2005, 44, 1027–1042.
CrossRef - Kulkarni, P.S.; Kalyani, V.; Mahajani, V.V. Industrial & Engineering Chem. Res., 2007, 46, 8176–8182.
CrossRef - Piedra, E.; Alvarez, J.R.; Luque, S. Desalination and Water Treatment, 2015, 53, 1431–1439.
CrossRef - Golder, A.K.; Chanda, A.K.; Samanta, A.N.; Ray, S. Separation and Purification Technology, 2011, 76, 345-350
CrossRef - Fang, X.; Zhang, G.; Chen, J.; Wang, D.; Yang, F. Int. J. Electrochem. Sci., 2012, 7, 11847–11858.
- Petruzzelli, D.; Passino, R.; Tiravanti, G. Indus. & Engin. Chem. Res., 1995, 34, 2612–2617.
CrossRef - Rafati, L.; Mahvi, A.; Asgari, A.; Hosseini, S. Int. J. Environ. Sci. Technol., 2010, 7, 147–156.
CrossRef - Schaider, L.A.; Senn, D.B.; Brabander, D.J.; McCarthy, K.D.; Shine J.P. Environ. Sci. &Technol., 2007, 41, 4164–4171.
CrossRef - Anazawa, K.; Kaida, Y.; Shinomura, Y.; Tomiyasu, T.; Sakamoto, H. Anal. Sci., 2004, 20, 79-84.
CrossRef - Rochayatun, E., Kaisupy, M.T. & Rozak, A. Jurnal Makara Sains, 2006, 10, 35-40.
- Lemos, V.A.; da Franca, R.S.; Moreira, B.O. Separat. & Purific. Technol., 2007, 54, 349–354.
CrossRef - Chen, J.R.; Teo, K.C. Analytica Chimica Acta, 2001, 434, 325–330.
CrossRef - Poonam, T.; Tanushree, B.; Sukalyan, C. Int. J. Advances in Chem., 2015, 1, 15-29.

This work is licensed under a Creative Commons Attribution 4.0 International License.
![]()
A New Edition of Web of Science
Journal Impact Factor
2022: 0.5
Five Year: 0.8
Journal is Indexed in

Cabells Whitelist
![]()


