Isotherm and Kinetic Study of Disulfin Blue and Methyle Orange Dyes by Adsorption onto by Titanium Dioxide- NPs loaded onto Activated Carbon : Experimental Design
Mohammad Reza Parvizi and Nima Karachi
Department of Chemistry, Marvdasht Branch, Islamic Azad University, Marvdasht, Iran.
Corresponding Author E-mail: nimakarachi@miau.ac.ir
DOI : http://dx.doi.org/10.13005/ojc/330552
The applicability of TiO2 nanoparticles (TiO2-NPs-AC) for removing Disulfine Blue (DSB) and Methyl Orange (MO) from aqueous solutions has been reported. The influence of nanoparticle loaded on activated carbon (TiO2-NPs-AC) dosage, pH of the sample solution, individual dye concentration, contact time between the sample and the adsorbent were studied by central composite design (CCD) under response surface methodology (RSM). The kinetic results revealed that the pseudo-second-order equation is the best model to analyze the adsorption mechanism. The isotherm analysis indicated that the equilibrium data are well fitted to the Langmuir isotherm model with maximum adsorption capacities of 100 and 50 mg g-1 of the adsorbent for removal Disulfine Blue and Methyl Orange respectively.
KEYWORDS:Adsorption; Methyl Orange; Disulfine Blue; Langmuir and Temkin Isotherms; Response Surface Methodology
Download this article as:| Copy the following to cite this article: Parvizi M. R, Karachi N. Isotherm and Kinetic Study of Disulfin Blue and Methyle Orange Dyes by Adsorption onto by Titanium Dioxide- NPs loaded onto Activated Carbon : Experimental Design. Orient J Chem 2017;33(5). |
| Copy the following to cite this URL: Parvizi M. R, Karachi N. Isotherm and Kinetic Study of Disulfin Blue and Methyle Orange Dyes by Adsorption onto by Titanium Dioxide- NPs loaded onto Activated Carbon : Experimental Design. Orient J Chem 2017;33(5). Available from: http://www.orientjchem.org/?p=38248 |
Introduction
Hues are widely used in the fabric, paper, plastic, leather, guest–host liquid crystal displays, solar cells, food and mineral processing industries. The effluents containing hues and pigments have been paid great attention in recent years since they can cause environmental problems. The removal methods of hues include physical adsorption, chemical degradation, biological degradation, photo degradation or the synergic therapy of different methods [1–5]. Many methods are accessible for the removal of pollutants contaminants from water, the most important of which are reverse osmosis, ion exchange, precipitation, and adsorption. Among these methods, adsorption is by far the most versatile and widely used method for the removal of toxic contaminants [6-8] because of its inexpensive nature and ease of operation. Methyl Orange (MO, Fig 1(a),4-[[(4-Di methyl amino) phenyl]azo] benzene sulfonic acid sodium salt, C.I. 13025 ,chemical formula ,MW=327.34 g/mol, λmax= 500 nm. It shows several side effects such as eye and skin sensitivity. Also, inhalation of its dust may cause digestion and respiratory tract burning. Disulfine blue (DSB, Fig. 1(b)) is a hazardous dye that is widely used for dyeing of wool and silk, carbon paper, cosmetics, and leather [9, 10].
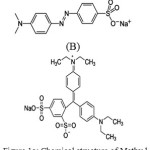 |
Figure 1a: Chemical structure of Methyl Orange (B). Disulfine Blue Click here to View figure |
Experimental
Apparatus and Materials
Hues concentrations were determined using Jasco UV–Vis spectrophotometer model V-530 (Jasco Company, Japan). Disulfine blue, Methyl orange activated carbon, sodium hydroxide, hydrochloric acid, activated carbon, sodium hydroxide, hydrochloric acid, ethanol and titanium tetra chloride were also from Merck (Germany).
Preparation of TiO2 -NPs-AC
Titanium dioxide nanoparticles was synthesized by the sol–gel process at room temperature directly from titanium tetra chloride and ethanol. 2 mL of titanium tetra chloride was added in 20 mL of dry Ethanol drop wise under stirring. Obtain solution was maintained at room temperature for 36 h to obtain a homogeneous gel which was then was dried in 80oC and calcined at 500 oC for 2 h. The titanium dioxide (TiO2) loaded onto AC with a weight ratio 1: 10 in the following manner: AC was thoroughly dispersed in 250 mL of ethanol under sonication for 1h,. Then 0.2 g the titanium TiO2-NPS was added to ethanolic mixture. The suspension was sonicated for 1h and stirred for 20 h at 400 rpm. TiO2 –NP-AC was filtrated by centrifugation and dried for 18 hour at AoC.
Measurements of dye Uptake
In accordance with the experiments layouted method, in their binary solution Hues onto TiO2-NPs-AC was carried out in a batch system as follows: 50 mL of binary hues solution with certain hues concentrations was prepared. After the adjustment of test solution pH 6.5.0 added into 50 mL Erlenmeyer flask containing 0.03 g of TiO2-NPs-AC. The experiments were performed at room temperature and predetermined sonication time (3 min) in ultrasonic bath. Finally, the sample solution was immediately centrifuged. The final concentration of hues by using a UV–Vis spectrophotometer set at a wave-length of 500 and 639 nm for MO and DSB, respectively. The removal percentage of each dye (R% MO and DSB) and the capacity for the adsorption of each dye (qi, mg g-1) was determined as: [11,12]:
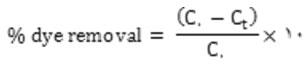
Where C. (mg L-,) and Ct (mg L-,) is the concentration of target at initial and after time t respectively.
Where mW is the mass of TiO2 –NP-AC (g) and V is the volume of the solution (L).
Table 1: Matrix for the central composite Design(CCD).
|
levels |
Star pointα = 2.0 | ||||||||||||
| Factors | Low (-1) | Central (0) | High(+1) | -α | +α | ||||||||
| DSB Concentration (mg L-1) (X1) | 10 | 15 | 20 | 5 | 25 | ||||||||
| MO Concentration (mg L-1) (X2) | 10 | 15 | 20 | 5 | 25 | ||||||||
| pH(X3) | 5.0 | 6.0 | 7.0 | 4.0 | 8.0 | ||||||||
| Adsorbent mass (g) (X4) | 0.0150 | 0.025 | 0.0350 | 0.005 | 0.045 | ||||||||
| Sonication time (min) (X5) | 2.0 | 4.0 | 6.0 | 2.0 | 6.0 | ||||||||
| Run | X1 | X2 | X3 | X4 | X5 | R %DSB | R %MO | ||||||
| 1 | 10 | 20 | 7 | 0.035 | 2 | 98 | 100 | ||||||
| 2 | 15 | 15 | 4 | 0.025 | 4 | 95 | 95 | ||||||
| 3 | 20 | 20 | 7 | 0.035 | 6 | 97.9 | 99.4 | ||||||
| 4 | 25 | 15 | 6 | 0.025 | 4 | 98 | 100 | ||||||
| 5 | 15 | 15 | 6 | 0.025 | 4 | 94.45 | 94.87 | ||||||
| 6 | 10 | 10 | 7 | 0.015 | 2 | 88 | 88 | ||||||
| 7 | 10 | 10 | 7 | 0.035 | 6 | 100 | 100 | ||||||
| 8 | 15 | 15 | 8 | 0.025 | 4 | 97.5 | 95.77 | ||||||
| 9 | 15 | 15 | 6 | 0.025 | 4 | 95 | 95 | ||||||
| 10 | 15 | 15 | 6 | 0.025 | 4 | 94.7 | 95 | ||||||
| 11 | 20 | 10 | 7 | 0.015 | 6 | 95 | 95 | ||||||
| 12 | 10 | 10 | 5 | 0.035 | 2 | 100 | 100 | ||||||
| 13 | 15 | 15 | 6 | 0.025 | 4 | 95 | 95 | ||||||
| 14 | 15 | 5 | 6 | 0.025 | 4 | 97 | 99 | ||||||
| 15 | 10 | 20 | 5 | 0.035 | 6 | 100 | 100 | ||||||
| 16 | 15 | 15 | 6 | 0.025 | 4 | 95 | 95 | ||||||
| 17 | 20 | 20 | 5 | 0.015 | 6 | 73 | 81.8 | ||||||
| 18 | 15 | 15 | 6 | 0.005 | 4 | 70 | 78.8 | ||||||
| 19 | 20 | 10 | 5 | 0.015 | 2 | 80 | 96.47 | ||||||
| 20 | 20 | 10 | 7 | 0.035 | 2 | 99.69 | 100 | ||||||
| 21 | 10 | 20 | 5 | 0.015 | 2 | 88.5 | 90 | ||||||
| 22 | 20 | 20 | 5 | 0.035 | 2 | 100 | 98.45 | ||||||
| 23 | 15 | 25 | 6 | 0.025 | 4 | 95 | 95 | ||||||
| 24 | 15 | 15 | 6 | 0.045 | 4 | 100 | 100 | ||||||
| 25 | 15 | 15 | 6 | 0.025 | 8 | 99.48 | 98.52 | ||||||
| 26 | 10 | 10 | 5 | 0.015 | 6 | 99.33 | 100 | ||||||
| 27 | 5 | 15 | 6 | 0.025 | 4 | 100 | 100 | ||||||
| 28 | 10 | 20 | 7 | 0.015 | 6 | 100 | 96 | ||||||
| 29 | 15 | 15 | 6 | 0.025 | 4 | 94.57 | 94.7 | ||||||
| 30 | 20 | 20 | 7 | 0.015 | 2 | 80 | 81.7 | ||||||
| 31 | 20 | 10 | 5 | 0.035 | 6 | 100 | 100 | ||||||
| 32 | 15 | 15 | 6 | 0.025 | 4 | 95 | 95 | ||||||
Results and Discussions
Textural and Chemical Characterization of TiO2-NPs-AC
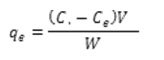
The FT-IR spectra of TiO2-NPs-AC were shown in Fig.2. The absorption band at 533 cm−1 may be attributed to angular deformation and Ti–O stretching modes of TiO2-NPs. In the range of 1500–3500cm−1, water has three dominant peaks. Absorption band at 1733 cm_1 corresponding to the stretching vibration of carbonyl groups. The broad peaks at 1029 cm_1 could be assigned to C–O stretching from phenolic, alcoholic, etheric groups and to C–C bonds. The morphological features of the samples studied by SEM are shown in Fig. (3).
 |
Figure 2: FT-IR spectrum of TiO2 -NPs-AC. Click here to View figure |
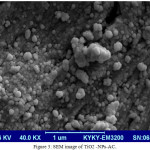 |
Figure 3: SEM image of TiO2 -NPs-AC. Click here to View figure |
Central Composite Design (CCD)
ANOVA was performed to obtain information on the most important variables and their possible interactions (Table 2). The “Lack of Fit F-value” of 3.611 and 2.239 for DSB and MO respectively and the corresponding p-value implied the significance of this model for the prediction of experimental data. Data analysis gave a semi-empirical expression applies to model the removal percentage (R %) of for DSB and MO respectively:
R%DSB=95.709-2.1767X1 -1.0258X2+0.94833X3+6.3233X4+2.0955X5-1.4350X1X2+1.3388X1X3+2.9638X1X4-1.1638X1X5+0.69000X2X3+1.0650X2X4-1.3900X2X5-1.6612X3X4+1.4612X3X5-1.9138X4X5+0.66726X12+0.91726X22-0.020244X32-2.8327X42-0.41595X52 (1 )
R%MO=95.775-0.88250X1-1.3383X2-0.21167X3+4.6367X4+1.2054X5-1.7575X1X2+0.33625X1X3+1.0550X1X4-1.1513X1X5+1.2700X2X3+1.7388X2X4-0.21750X2X5+0.53250X3X4+1.4887X3X5-0.98000X4X5+0.94960X12+0.94960X22-0.20415X32-1.7004X42-0.12982X52 (2)
Table 2: Analysis of variance (ANOVA) for CCD.
|
DSB |
MO |
||||||||
|
Source of variation |
Df |
Sum of square |
Mean square |
F-value |
P-value |
Sum of square |
Mean square |
F-value |
P-value |
|
Model |
20 |
1920.3 |
96.013 |
11.161 |
0.00011 |
977.95 |
48.898 |
8.4833 |
0.000412 |
|
X1 |
1 |
113.71 |
113.71 |
13.218 |
0.003918 |
18.691 |
18.691 |
3.2428 |
0.099187 |
|
X2 |
1 |
25.256 |
25.256 |
2.9359 |
0.11463 |
42.987 |
42.987 |
7.4579 |
0.019546 |
|
X3 |
1 |
21.584 |
21.584 |
2.509 |
0.1415 |
1.0753 |
1.0753 |
0.18655 |
0.67415 |
|
X4 |
1 |
959.63 |
959.63 |
111.55 |
< 0.0001 |
515.97 |
515.97 |
89.516 |
< 0.0001 |
|
X5 |
1 |
74.495 |
74.495 |
8.6597 |
0.013382 |
24.653 |
24.653 |
4.277 |
0.062979 |
|
X1X2 |
1 |
32.948 |
32.948 |
3.83 |
0.076198 |
49.421 |
49.421 |
8.5741 |
0.013736 |
|
X1X3 |
1 |
28.676 |
28.676 |
3.3335 |
0.095127 |
1.809 |
1.809 |
0.31385 |
0.58655 |
|
X1X4 |
1 |
140.54 |
140.54 |
16.337 |
0.001942 |
17.808 |
17.808 |
3.0896 |
0.10655 |
|
X1X5 |
1 |
21.669 |
21.669 |
2.5189 |
0.14079 |
21.206 |
21.206 |
3.6791 |
0.081416 |
|
X2X3 |
1 |
7.6176 |
7.6176 |
0.88551 |
0.3669 |
25.806 |
25.806 |
4.4772 |
0.057977 |
|
X2X4 |
1 |
18.148 |
18.148 |
2.1096 |
0.1743 |
48.372 |
48.372 |
8.3921 |
0.014525 |
|
X2X5 |
1 |
30.914 |
30.914 |
3.5936 |
0.084568 |
0.7569 |
0.7569 |
0.13132 |
0.72394 |
|
X3X4 |
1 |
44.156 |
44.156 |
5.1329 |
0.044651 |
4.5369 |
4.5369 |
0.78711 |
0.39396 |
|
X3X5 |
1 |
34.164 |
34.164 |
3.9714 |
0.071677 |
35.462 |
35.462 |
6.1524 |
0.030552 |
|
X4X5 |
1 |
58.599 |
58.599 |
6.8119 |
0.024259 |
15.366 |
15.366 |
2.6659 |
0.13079 |
|
X12 |
1 |
12.981 |
12.981 |
1.509 |
0.24493 |
26.291 |
26.291 |
4.5613 |
0.056021 |
|
X22 |
1 |
24.53 |
24.53 |
2.8515 |
0.1194 |
26.291 |
26.291 |
4.5613 |
0.056021 |
|
X32 |
1 |
0.011948 |
0.011948 |
0.001389 |
0.97094 |
1.2151 |
1.2151 |
0.21081 |
0.65508 |
|
X42 |
1 |
233.96 |
233.96 |
27.196 |
0.000288 |
84.299 |
84.299 |
14.625 |
0.002822 |
|
X52 |
1 |
2.9101 |
2.9101 |
0.33829 |
0.57254 |
0.28347 |
0.28347 |
0.049179 |
0.82856 |
|
Residual |
11 |
94.627 |
8.6025 |
63.404 |
5.764 |
||||
|
Lack of Fit |
5 |
71.027 |
14.205 |
3.6115 |
0.074721 |
41.28 |
8.2561 |
2.2391 |
0.17741 |
|
Pure Error |
6 |
23.6 |
3.9334 |
22.123 |
3.6872 |
0.000412 |
|||
|
Cor Total |
31 |
2014.9 |
1041.4 |
0.099187 |
|||||
Response Surface Methodology
The 3D RSM surfaces was developed by considering all the significant interactions in the CCD to optimize the critical factors and describe the nature of the response surface in the experiment. Fig (4a, b) show that the removal percentage changes versus the adsorbent dosage. The positive increase in the dye removal percentage with increase in adsorbent amount is seen. Fig (4c) that the removal percentage changes versus the adsorbent dosage. The positive increase in the dye removal percentage with increase in adsorbent mass is seen.
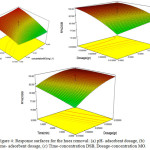 |
Figure 4: Response surfaces for the hues removal: (a) pH- adsorbent dosage, (b) Time- adsorbent dosage, (c) Time-concentration DSB, Dosage-concentration MO. Click here to View figure |
Adsorption Isotherms
An adsorption isotherm is characterized by certain constant amounts, which express the surface properties of the adsorbent and so on the percentages adsorption of MO and DSB hues as a function of initial concentration of MO and DSB hues are given in table the 3. Based on the linear form of Langmuir isotherm model [13-21] . indicating that the Langmuire adsorption of MO and DSB onto TiO2 -NPs-AC are favorable.
Table 3: The resultant amounts for the studied isotherms in connection to MO and DSB hues adsorption onto TiO2-NPs-AC.
|
Isotherm |
parameters |
MO |
DSB |
|
Langmuir |
qm /(mg g-1) |
50 |
100 |
|
b/L mg-1 |
1.53 |
0.487 |
|
|
R2 |
0.997 |
0.998 |
|
|
Freundlich |
1/n |
0.24 |
0.55 |
|
p/ (L mg-1) |
3.66 |
4.09 |
|
|
R2 |
0.985 |
0.982 |
|
|
Tempkin |
b1 |
5.76 |
14.15 |
|
KT/ (L mg-1) |
56.723 |
6.855 |
|
|
R2 |
0.98 |
0.978 |
|
|
Dubinin-Radushkevich (DR) |
qs (mg g-1) |
29.66 |
39.64 |
|
B x ). -v |
-4 |
-1 |
|
|
E (kj mol-1) |
3546 |
2237 |
|
|
R2 |
0.95 |
0.963 |
Study Kinetic
The prediction of batch adsorption kinetics is necessary for the layout of industrial adsorption columns. Such kinetic models including pseudo first and second-order, Elovich and intraparticle diffusion were investigated to study the rate and mechanism of an adsorption process[22-27]. Table 4 summarized the properties of each model with the experimental adsorption. higher values of R2 were obtained for pseudo-second-order adsorption rate model indicating that the adsorption rates of both dyes onto the TiO2-NPs-AC can be more appropriately described by using the pseudo-second order rate. This means that the rate of the surface adsorption depends on the rate of the chemical adsorption process as the rate-determining step.
Table 4: Kinetic parameters for MO and DSB hues adsorption onto TiO2-NPs-AC.
|
Concentration (mg/l) |
Model |
parameters |
Value of parameters for DSB |
Value of parameters for MO |
|||
|
10 20 |
pseudo-First-order kinetic |
k1/(min-1) |
1.43 |
0.987 |
|||
|
30 40 |
|||||||
|
50 60 |
R2 |
0.95 |
0.95 |
||||
|
10 20 |
pseudo-Second-order kinetic |
k2 /(min-1) |
0.507 |
0.154 |
|||
|
30 40 |
|||||||
|
50 60 |
R2 |
0.999 |
0.999 |
||||
|
10 20 |
Intraparticle diffusion |
Kdiff/ (mg g-1 min-1/2) |
4.59 |
8.05 |
|||
|
30 40 |
|||||||
|
50 60 |
R2 |
0.94 |
0.97 |
||||
|
10 20 |
Elovich |
β /(g mg-1) |
1.379 |
0.609 |
|||
|
30 40 |
|||||||
|
50 60 |
R2 |
0.94 |
0.98 |
||||
Conclusions
In this study, TiO2 nanoparticles loaded onto carbon activated were produced and tested as adsorbents for the removal of Disulfine Blue and Methyl Orange dyes from aqueous samples. The results of this work show TiO2 -NPs-AC under the sonication is an efficient, fast and sentient adsorption method for the removal of DSB and MO. Results showed that the Langmuir isotherm model was fitted well with adsorption data. Kinetic data for both dyes were appropriately fitted to a pseudo-second-order adsorption rate.
Acknowledgement
All authors expresses their appreciation to the Marvdashat Islamic Azad University, Marvdashat, Iran for financial support of this work.
References
- S. Eftekhari, A. Habibi-Yangjeh, Sh. Sohrabnezhad, Application of AlMCM-41 for competitive adsorption of methylene blue and rhodamine B: thermodynamic and kinetic studies, J. Hazard. Mater. 178 (2010) 349–355.
CrossRef - J.M. Monteagudo, A. Duran, C. Lopez-Almodovar, Homogenous ferrioxalateassisted solar photo-Fenton degradation of orange II aqueous solutions, Appl. Catal. B: Environ. 83 (2008) 46–55.
CrossRef - C. Marc, S. Marc, M.M. Joachim, G. Siegmar, Degradation of reactive hues in wastewater from the textile industry by ozone: analysis of the products by accurate masses, Water Res. 43 (2009) 733–743.
CrossRef - A.B. dos Santos, F.J. Cervantes, J.B. van Lier, Review paper on current technologies for decolorisation of textile wastewaters: perspectives for anaerobic biotechnology, Bioresource Technol. 98 (2007) 2369–2385.
CrossRef - T. Aarthi, P. Narahari, G. Madras, Photocatalytic degradation of Azure and Sudan hues using nano TiO2, J. Hazard. Mater. 149 (2007) 725–734.
CrossRef - Mattson, J. S.; Mark, H. B. Activated Carbon Surface Chemistry and Adsorption from Aqueous Solution; Marcel Dekker: New York, 1971.
- Cheremisinoff, P. N.; Ellerbush, F. Carbon Adsorption Handbook; Ann Arbor Science Publishers: Ann Arbor, MI, 1979.
- Gupta, V. K.; Ali, I. Adsorbents for water treatment: Low cost alternatives to carbon. In Encyclopedia of Surface and Colloid Science; Hubbard, A., Ed.; Marcel Dekker: New York, 2002; Vol. 1, pp 136-166
- S.Bagheri, Oriental Journal of Chemistry , Application of response surface methodology to modeling and optimization of removal of Bismarck Brown and Thymol Blue by Mn-Fe2O4- NPs-AC: Kinetics and thermodynamic studies, Vol. 32, (2016)
- F.N. Azad, M. Ghaedi, K. Dashtian, S. Hajati, V. Pezeshkpour, Ultrasonically assisted hydrothermal synthesis of activated carbon–HKUST-1-MOF hybrid for efficient simultaneous ultrasound-assisted removal of ternary organic hues and antibacterial investigation: Taguchi optimization, Ultrasonics Sonochemistry, 31 (2016) 383-393.
CrossRef - J. Luan, P.-X. Hou, C. Liu, C. Shi, G.-X. Li, H.-M. Cheng, Efficient adsorption of organic hues on a flexible single-wall carbon nanotube film, Journal of Materials Chemistry A, 4 (2016) 1191-1194.
CrossRef - Y. Liu, G. Cui, C. Luo, L. Zhang, Y. Guo and S. Yan, RSC Adv., 2014, 4, 55162–55172.
- A. Asfaram, M. Ghaedi, S. Hajati, A. Goudarzi and A. A. Bazrafshan, Spectrochim. Acta, Part A, 2015, 145, 203–212.
CrossRef - Langmuir I.The constitution and fundamental properties of solids and liquids. PartI. Solids. J Am Chem Soc 1916;38:2221–95.
CrossRef - HoY-S.Second-order kinetic model for the sorption of cadmium onto tree fern: a comparison of linearand non-linear methods.Water Res 2006;40:119–25.
CrossRef - Juang R,Wu F,Tseng R.The ability of activated clay for the adsorption of hues from aqueous solutions. Environ Technol 1997;18:525–31.
CrossRef - Robinson T, Mc Mullan G,March an tR, Nigam P.Remediation of hues in textile effluent: acritical review on current treatment technologies with aproposed alternative. Bioresour Technol 2001;77:247 –55.
CrossRef - Wood GO.Review and comparisons of D/R models of equilibrium adsorption of binary mixtures of organic vapors on activated carbons. Carbon 2002;40:231–9.
CrossRef - S. Javad Hosseini, H. Aghaie, And M.Ghaedi, Oriental Journal of Chemistry, The Synthesis of Ag Nanoparticles and Loading in on Activated Carbon as A Novel Adsorbent for Removing Methyl Orange by Using Surface Response Methodology2014, Vol. 30, No. (4): Pg. 1883-1895
- C. Namasivayam, R.T. Yamuna, Adsorption of chromium by a low-cost adsorbent: biogas residual slurry, Chemosphere 30 (1995) 561–578.
CrossRef - 35 M. Ghaedi, B. Sadeghian, A. A. Pebdani, R. Sahraei, A. Daneshfar and C. Duran, Chem. Eng. J., 2012, 187, 133–141.
CrossRef - S. Hajati, M. Ghaedi, B. Barazesh, F. Karimi, R. Sahraei, A. Daneshfar and A. Asghari, J. Ind. Eng. Chem., 2014, 20, 2421–2427.
CrossRef - M. Toor and B. Jin, Chem. Eng. J., 2012, 187, 79–88.
CrossRef - S. Hajati, M. Ghaedi, B. Barazesh, F. Karimi, R. Sahraei, A. Daneshfar and A. Asghari, J. Ind. Eng. Chem., 2014, 20, 2421–2427.
CrossRef - M. Toor and B. Jin, Chem. Eng. J., 2012, 187, 79–88.
CrossRef - A. Asfaram, M. Ghaedi, S. Agarwal, I. Tyagi, V.K. Gupta, Removal of basic dye auramine-O by ZnS: Cu nanoparticles loaded on activated carbon: optimization of parameters using response surface methodology with central composite layout, RSC Adv. 5 (2015) 18438–18450.
CrossRef - M. Ghaedi, A. Ansari, P. Assefi Nejad, A. Ghaedi, A. Vafaei, M.H. Habibi, Artificial neural network and bees algorithm for removal of eosin b using cobalt oxide nanoparticle-activated carbon: isotherm and kinetics study, Environ. Progress Sustainable Energy 34 (2015) 155–168.
CrossRef

This work is licensed under a Creative Commons Attribution 4.0 International License.
![]()
A New Edition of Web of Science
Journal Impact Factor
2022: 0.5
Five Year: 0.8
Journal is Indexed in

Cabells Whitelist
![]()


