Distribution of Manganese and Iron in the two Compartments of Wadi Tislit-Talssint, Descriptive Study and Variance Analysis
H. Taouil1,2, M. Elkouali2, A. Amine4, M. Doubi1, H. Lemacha3 , S.Elanza5 and S. Ibn Ahmed1
1Laboratory of Materials, Electro-Chemistry and Environment, Faculty of Sciences University IBN Tofail kénitra Morocco.
2Laboratory of Analytical Chemistry and Physical Chemistry of Materials Hassan II University of Casablanca.
3Laboratory of Applied Geology, Geomantics and Environment. Department of Geology. Faculty of Sciences Ben M'sik, Hassan II University of Casablanca, Morocco.
4Laboratory of condensed matter and renewable energy, Faculty of Sciences and Technology. Hassan II University.
5Laboratory of Organic Synthesis and Process of Extraction, Faculty of Sciences, University Ibn Tofail, Kentia, Morocco.Corresponding Author E-mail: hamidsup@yahoo.fr
DOI : http://dx.doi.org/10.13005/ojc/330561
In order to assess the distribution of manganese and iron contained in the two compartments of Wadi Tislit-Talssint, sampling campaigns were carried out weekly during May 2011 and an approach is represented by descriptive study and variance analysis. The results of these analyzes have shown the existence of a fairly high content of Mn in the stations so and SC1, the levels measured are markedly higher than the potability standard. Thus, the total average Mn concentrations in all stations in the studied waters are significantly different. On the other hand, the total average Mn concentrations in all the sediment stations studied are not significantly different; the total average Mn concentrations in all the stations of the mixture (water + sediments) studied are highly significant. In addition, no significant difference in metal accumulation was observed between the two compartments, manganese is more abundant at the station So in water (1434 μg / l) than in the sediment. However, the origin could be natural and that contributes to this contribution in manganese, since the formation of the watershed is rich in Mn (limestone and marl). In addition, iron with a distribution similar to manganese, it abounds in all study stations, but with higher levels by than those found in manganese.
KEYWORDS:ANOVA; Manganese; Iron; Distribution; Oued Tslit-Talssint
Download this article as:| Copy the following to cite this article: Taouil H, Elkouali M, Amine A, Doubi M, Lemacha H, Ahmed S. I. Distribution of Manganese and Iron in the two Compartments of Wadi Tislit-Talssint, Descriptive Study and Variance Analysis. Orient J Chem 2017;33(5). |
| Copy the following to cite this URL: Taouil H, Elkouali M, Amine A, Doubi M, Lemacha H, Ahmed S. I. Distribution of Manganese and Iron in the two Compartments of Wadi Tislit-Talssint, Descriptive Study and Variance Analysis. Orient J Chem 2017;33(5). Available from: http://www.orientjchem.org/?p=38860 |
Introduction
Some metallic elements, such as iron and manganese present in the state of traces, are essential for organisms, but in low doses1. However, increasing concentrations in the environment cause toxicity. These two chemical elements are often encountered together in nature. The presence of iron in water can have various origins: natural by the leaching of clay or industrial soil2. But the presence of manganese, at the industrial level, can be linked to metallurgy, the electrical industry and the chemical industry2. The presence of manganese at high levels in soils, sediments and metamorphic and sedimentary rocks can be a source of natural pollution. In addition, the manganese accumulated by the plants can be found in solution in runoff water or at ground level after decomposition of the vegetation cover3. The use of manganese in the manufacture of fertilizers, feeds, fungicides, pharmaceuticals, dyes, paint desiccants, catalysts and wood preservatives4,5 , May also contribute to the contamination of surface waters by this metal. Iron mills and steel mills can also release manganese into the atmosphere, which is then redistributed by precipitation6. In addition, iron is the most abundant metal in the earth’s crust, where it represents about 5%. Because of this, it can be released naturally, mainly from igneous rocks and sulphide minerals as well as sedimentary rocks. In addition, the increased use of iron in several industrial processes can constitute a major source of pollution in rivers. The main industries are mining and processing, chemicals, metallurgy, textiles, canning and titanium oxide production4. In addition, wastewater can be loaded with iron due to corrosion phenomena in the pipes or manufacturing equipment, the phenomenon of leaching of soils, rejects industries, etc.7-9. Thus the evaluation of contamination by heavy metals (Al3+, As2+, Cd2+, Cr3+, Cu2+, Fe2+, Mn2+, Ni2+ and Pb2+) in the Beht wady has been studied10. On the other hand, the contamination of surface waters and sediments by heavy metals was studied by H. TAOUIL et al11-14. The presence of these metals even at low concentrations in surface waters can have significant ecological and health impacts15. Thus the chemical elements Fe and Mn may be at the origin of the degradation of water quality. They are distinguished from other chemical pollutants by their low biodegradability and high bioaccumulation potential along the trophic chain. It is for this reason that we investigated the distribution of manganese and iron in the two compartments (waters and sediments) of Wadi Tislit-Talsint of the watershed of Guir in Morocco.
Study Environment
The Talssint region belongs to the eastern high Moroccan Atlas area, forming part of the eastern region, bringing it into contact with the regions of Tafilalt-Meknes and Fes-Boulmane. Thus the Talssint region can be divided into two units: In the west, the mountains of the high eastern atlas, with altitudes above 2000 m, the highest of which are: Falchou mount (2303m), Skendis mount (2173m ), And Mechkakour mount (2122m). In the center and east of the country, the highland area covers two thirds of the eastern region with altitudes between 1000 and 1650m. Talssint belongs administratively to the province of Figuig, to the south of the region of the oriental. Its surface covers 11,000 km2, bounded to the north by Missour and Ouatat-L’haj, by Benitadjit to the south, Maatarka to the east, and by Gourrama to the west.
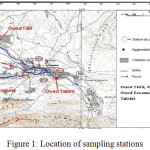 |
Figure 1: Location of sampling stations Click here to View figure |
Bioclimatic Plan
Bioclimatically, the region is characterized by pre-Saharan and Saharan atmospheres. Temperatures are high in summer and very cold in winter, the average of the coldest month (January) minimum is -5°C and the mean maximum of the hottest month (July) is 47°C. The annual average16 rainfall was around 245 mm for the period 1983/2007 with significant inter annual variances, and is about 500 mm for the period 2008/2010: the recorded extremes were 61 mm in 1998/99 and 684.5 mm in 2009/2010.
Sampling and Analytical Methods
Water sampling was carried out during two surveys during a low-water period (May and June of 2011). In order to determine the average concentrations of heavy metals Fe and Mn, and thus their distributions in the two compartments of Tislit-Talssint wadis, samples were chosen on its main flow axis, their choices result from a compromise between The possibility of sampling and the need to account for the spatial organization of the wadi. The water samples are stored in polyethylene bottles washed thoroughly with a slightly acidified solution and rinsed several times with distilled water17. Water samples used for the determination of heavy metals are treated in the field with ultra pure HNO3. Mn, Fe concentrations were determined using ICP-MS (Inductively Coupled Plasma Mass Spectrometry) at the National Science and Technical Research Center (CNRST) –MoroccoLaboratory.
Results
Statistical Study
Station Effect on the Distribution of Mn
Distribution of Mn and Fe in the Waters
The total average concentrations of Mn in the any of the water stations studied are significantly different (F = 740772,60; p = 0.0) with a total average of 404,64µg/L (Table (1)) and standard deviation of 461,53 with 95% confidence interval for the average is 260,81-548.46 µg/L, in addition, the variance coefficient is of the order 114,06%. As well, the average concentrations of total Fe in all the stations of the waters studied are significantly different with a total average of 404,64µg/L (Table (2)) and gap-type to the order 461,53 with 95% confidence interval for the average is 260,81-548.46 µg/L, as well the coefficient of variance is of the order 114,06%. This results show that the average concentrations of total Mn and Fe in all the stations of the waters studied are significantly different.
Table 1: Distribution of Mn in the waters of Wadi Tislit-Talssint (µg/L)
|
|
average |
Standard Deviation |
standard Error |
confidence interval for the 95% for the average |
Minimum |
Maximum |
CV% |
P |
||
|
Lower limit |
Upper limit |
|||||||||
|
Mn |
SO |
1435,25 |
1,54 |
0,63 |
1433,63 |
1436,87 |
1434 |
1438 |
0,11%(g) |
0,000** |
|
SC1 |
574,58 |
1,01 |
0,41 |
573,52 |
575,65 |
573 |
576 |
0,18%(f) |
||
|
SR1 |
160,5 |
1,87 |
0,76 |
158,54 |
162,46 |
158 |
163 |
1,17%(d) |
||
|
|
SR2 |
82 |
0 |
0 |
82 |
82 |
82 |
82 |
0,00%(b) |
|
|
|
SR3 |
113,13 |
1,45 |
0,59 |
111,61 |
114,65 |
111 |
115 |
1,28%(c) |
|
|
|
SC2 |
402,75 |
1,54 |
0,63 |
401,13 |
404,37 |
401 |
405 |
0,38%(e) |
|
|
|
SS |
64,25 |
1,54 |
0,63 |
62,63 |
65,87 |
62 |
66 |
2,40%(a) |
|
|
|
Total |
404,64 |
461,53 |
71,22 |
260,81 |
548,46 |
62 |
1438 |
114,06% |
|
Table 2: Distribution of Fe in Wadi Waters Tislit-Talssint (μg / l)
|
Fe |
Interval |
Minimum |
Maximum |
Sum |
average |
Standard Deviation |
|
|
Statistic |
Statistic |
Statistic |
Statistic |
Statistic |
std Error |
Statistic |
|
|
S0 |
3,5 |
2040,0 |
2043,5 |
12250,5 |
2041,750 |
0,5439 |
1,3323 |
|
SC1 |
1330,5 |
145,0 |
1475,5 |
2210,5 |
368,417 |
221,4174 |
542,3597 |
|
SR1 |
4,0 |
415,0 |
419,0 |
2502,5 |
417,083 |
0,5833 |
1,4289 |
|
SR2 |
4,00 |
426,00 |
430,00 |
2568,46 |
428,0767 |
0,58242 |
1,42663 |
|
SR3 |
4,00 |
255,00 |
259,00 |
1540,25 |
256,7083 |
0,64684 |
1,58443 |
|
SC2 |
4,00 |
103,00 |
107,00 |
630,76 |
105,1267 |
0,59108 |
1,44785 |
|
SS |
4,00 |
28,00 |
32,00 |
180,34 |
30,0567 |
0,58012 |
1,42101 |
Distributions of Mn in Sediments
According to Table 3, the analysis of variance shows a very highly significant deference, it is found that the mean total Mn concentrations in all the sediment stations studied are significantly different, with a total mean of 388.73μg / l and standard deviation in the order of 106.06 with 95% confidence interval, mean 355.68-421.78μg / l, thus the coefficient of variance Is of the order of 27.28%. So the Mn evolves in a comparable way during the period of study. As a result, there was a significant difference in metal accumulation in all the studied stations.
Table 3: Distribution of Mn in wadi Tislit-Talssint sediments
| average | Standard Deviation | standard Error | confidence interval for the 95% for the average | Minimum | Maximum | |||||
| Lower limit | Upper limit | CV% | P | |||||||
| Mn | SO | 440,33 | 1,63 | 0,67 | 438,62 | 442,05 | 438,00 | 442,00 | 0,37%(f) | 0,000** |
| SC1 | 380,26 | 1,55 | 0,63 | 378,63 | 381,89 | 378,00 | 382,00 | 0,41%(d) | ||
| SR1 | 230,09 | 1,43 | 0,58 | 228,59 | 231,60 | 228,00 | 232,00 | 0,62%(a) | ||
| SR2 | 421,11 | 1,44 | 0,59 | 419,60 | 422,62 | 419,00 | 423,00 | 0,34%(e) | ||
| SR3 | 338,79 | 5,46 | 2,23 | 333,07 | 344,52 | 328,00 | 342,76 | 1,61%(c) | ||
| SC2 | 320,13 | 1,45 | 0,59 | 318,61 | 321,65 | 318,00 | 322,00 | 0,45%(b) | ||
| SS | 590,42 | 1,74 | 0,71 | 588,59 | 592,25 | 588,00 | 592,50 | 0,30%(g) | ||
| Total | 388,73 | 106,06 | 16,37 | 355,68 | 421,78 | 228,00 | 592,50 | 27,28% |
Distributions of Mn and Fe in the mixture (water + sediments)
The total average concentrations of Mn at all stations of the mixture (water + sediment) studied are highly significant (F = 13.72, p = 0.0) with a total average of 396.69μg / l (Table (4)) and A standard deviation in the order of 332.93 with a 95% confidence interval for the mean 324.43-468.94μg / l, thus the coefficient of variance is of the order of 83.93%.
Table 4: distribution of Mn in the mixture (water + sediments).
| confidence interval for the 95% for the average | |||||||||||
| average | Standard | Standard Error | Minimum | Maximum | |||||||
| deviation | Lower limit | Upper limit | |||||||||
| CV% | FISHER | P | |||||||||
| SO | 937,79 | 519,58 | 149,99 | 607,67 | 1267,92 | 438,00 | 1438,00 | 55,40%(b) | 13,72 | 0,000** | |
| SC1 | 477,42 | 101,49 | 29,30 | 412,94 | 541,91 | 378,00 | 576,00 | 21,26%(a) | |||
| SR1 | 195,30 | 36,38 | 10,50 | 172,18 | 218,41 | 158,00 | 232,00 | 18,63%(a) | |||
| SR2 | 251,55 | 177,10 | 51,12 | 139,03 | 364,07 | 82,00 | 423,00 | 70,40%(a) | |||
| Mn | SR3 | 225,96 | 117,91 | 34,04 | 151,05 | 300,88 | 111,00 | 342,76 | 52,18%(a) | ||
| SC2 | 361,44 | 43,17 | 12,46 | 334,01 | 388,87 | 318,00 | 405,00 | 11,94%(a) | |||
| SS | 327,33 | 274,79 | 79,32 | 152,74 | 501,92 | 62,00 | 592,50 | 83,95%(a) | |||
| Total | 396,69 | 332,93 | 36,33 | 324,43 | 468,94 | 62,00 | 1438,00 | 83,93% |
Table 5: Distribution of Fe in the mixture (water + sediments).
| average | Standarddeviation | Standard error | confidence interval for the 95% for the average | Minimum | cv % | |||
| Lower limit | Upper limit | |||||||
| Fe | SO | 1032 | 1054,65032 | 304,45132 | 3,619,072 | 1702,0928 | 20,12 | 102,19% |
| SC1 | 2,077,525 | 402,32674 | 116,14173 | -478,737 | 4,633,787 | 45,1 | 193,66% | |
| SR1 | 2,198,858 | 205,9707 | 5,945,862 | 890,183 | 3,507,534 | 20,87 | 93,67% | |
| SR2 | 2,587,958 | 176,81336 | 5,104,162 | 146,454 | 3,711,377 | 87,41 | 68,32% | |
| SR3 | 1,544,717 | 106,79243 | 3,082,832 | 86,619 | 2,223,243 | 50,15 | 69,13% | |
| SC2 | 620,225 | 45,04191 | 1,300,248 | 334,042 | 906,408 | 17,04 | 72,62% | |
| SS | 262,725 | 4,187 | 120,868 | 236,122 | 289,328 | 20,64 | 15,94% | |
| Total | 2,801,715 | 531,00772 | 5,793,769 | 1,649,358 | 3,954,073 | 17,04 | 189,53% |
The total average Fe concentrations at all stations of the mixture (water + sediment) studied are highly significant, with a total average of 280.1715μg / l (Table (5)) and a standard deviation in the order of 531.00 with 95% confidence interval for the mean 164.9358- 395.4073μg / l, thus the coefficient of variance is of the order of 189.53%. Thus, on the other hand, these metals show that a large significant difference according to the studied stations.
Effect Compartment on the Distribution of Mn and Fe
From Table (6), which gives information on the distribution of Mn in the two compartments: water and sediment, we see that the probability is of the order P = 0.83, which means that there is no difference between the average value of Mn in sediments and in water, because the probability value P is greater than 0.05, so the difference is not significant. Thus, no significant difference in metal accumulation was observed between the two compartments. From Table 7, which gives information on the distribution of Fe in the two compartments: water and sediment, it is found that average is of the order 280.17 and a standard deviation at the order of 531, 00772 with a 95% confidence interval for the average 164.9358- 395.4073μg / l, as well the coefficient of variance is of the order 189,53% and the probability is of the Order P =0.65 which mean that there is no difference between the average value of Mn in the sediment and in the water, because the value of the probability P is greater than 0.05, so the difference is not significant. Therefore no significant difference of the metal accumulation has been raised between the two compartments.
Table 6: Descriptive study and analysis of variance “effect compartment” on the distribution of Mn.
| average | Standard deviation | Standard | confidence interval for the 95% for the average | Minimum | Maximum | ||||||
| Error | Lower limit | Upper limit | CV% | FISHER | P | ||||||
| Mn | Water | 4,046,379 | 461,53 | 71,21 | 260,81 | 5,484,621 | 62,00 | 1438,00 | 114,06% | 0,05 | |
| SEDIMENT | 3,887,329 | 106,05 | 16,36 | 355,68 | 4,217,827 | 228,00 | 592,50 | 27,28% | |||
| Total | 3,966,854 | 332,93 | 36,32 | 324,43 | 4,689,362 | 62,00 | 1438,00 | 83,93% | 0,83 |
Table 7: Descriptive study and analysis of variance “effect compartment” on the distribution of Fe
| average | Standard deviation | Standard | confidence interval for the 95% for the average | Minimum | P | ||||
| Error | Lower limit | Upper limit | CV% | ||||||
| Fe | Water | 5,210,312 | 671,84063 | 103,66726 | 3,116,709 | 7,303,915 | 28 | 128,94% | 0,65 |
| SEDIMENT | 393,119 | 2,427,364 | 37,455 | 317,477 | 468,761 | 17,04 | 61,75% | ||
| Total | 2,801,715 | 531,00772 | 5,793,769 | 1,649,358 | 3,954,073 | 17,04 | 189,53% |
Conclusion
The distribution of manganese contained in the two compartments of Wadi Tislit-Talssint has been studied. The results obtained showed that, the total average concentrations of Mn in all stations of the mixture (water-sediment) studied are highly significant. In addition, no significant difference of the metal accumulation has been raised between the two compartments. On the other hand, the existence of a fairly high content of Mn in the stations so and SC1 the measured contents are clearly superior to the drinking water standard. The waters of several stations have a very lower concentration of manganese than the sediment. Thus, these stations are considered to be favorable to irrigation since their levels do not reach the limit value established by the Moroccan standards. In addition to the iron with a distribution similar to manganese, it is abundant in all the study stations, but at high levels by contribution to those found in manganese.
References
- Rodier, J. (1984). -Analyse de l’eau: eaux naturelles, eaux résiduaires, eau de mer 7ème édition, Dunot, Paris.
- Taha-Hocine DEBIECHE, Thèse, Doctorat. U.F.R. des Sciences et Techniques de l’Université de Franche-Comté « Evolution de la qualité des eaux (salinité, azote et métaux lourds) sous l’effet de la pollution saline, agricole et industrielle » n° 900 (2002)
- Mc Neely, R.N, Neimanis, V.P. Et Dwyer, L (1980). Référence sur la qualité des eaux, Guide des paramètres de la qualité des eaux Environnemental Canada, Direction de la qualité des eaux. Ottawa, Canada
- Haguenoer, J.M. et Furon, D. (1982). -Toxicologie et hygiène industrielles. Les dérivés minéraux. 2ème partie. Technique et Documentation, Paris.
- O.M.S. (1981). Critère d’hygiène de l’environnement (T7): le manganèse, Organisation Mondiale de la Santé, Genève.
- Foutlane, A. (1983). -Spéciation des métaux lourds dans l’oued Moulaya au Maroc Thèse de 3ème cycle Université de Paris XII.
- JD. HEM. Chemical factorsthat influence the availability of iron and manganese in Aqueous systems. Geol. Soc. Am. Spec. Pap., 140, (1972), 17
- BG. Oliver and Eg. Cosgrove. Metal concentrations in the sewage, effluents and sludges of some southern Ontario waste water treatment plants, Environ. Lett. 9 (1975), 75.
CrossRef - SC. James. Metals in municipal landfill each ate and their health effects. Am. J. Public Health, (1977), 67 42.
CrossRef - lakhili ferdaous, Dr. benabdelhadi mohammed, Ph. bouderka nouzha, Dr. european scientific journal april 2015 édition vol.11, no.11 Issn: 1857 – 7881 (print) e – Issn 1857- 74.
- H. Taouil. et al (2012), « Evaluation de la pollution métallique : manganèse, fer, zinc, cobalt et chrome des eaux de l’oued Tislit Talsint: Maroc oriental » ScienceLib Editions Mersenne : Volume 4, N° 120301 I SSN 2111470.
- Hamid Taouil et al. 2011- Contribution à l’évaluation de la pollution métallique des sédiments de l’oued tislit-talsint, bassin versant de guir (Maroc oriental). ScienceLib Editions Mersenne : Volume 3, N° 111109 I SSN 2111470.
- H. Taouil1, S. Ibn Ahmed1, A. El Assyry, N. Hajjaji, A. Srhiri, 2013 – Water quality evaluation of the river Tislit-Talsint (East Morocco). J. Mater. Environ. Sci. 4 (4) 502-509.
- H. Taouil1 et al., 2014 -Evaluation of métal pollution: Aluminium, Zinc, Iron and Copper of Tiykomiyne well water (East Morocco). J. Mater. Environ. Sci. 5 (1) 177-182
- Lakhili Ferdaous, Dr.Benabdelhadi Mohammed, Ph. Bouderka Nouzha, Dr. « Étude de la qualité physicochimique et de la contamination métallique des eaux de surface du bassin versant de beht (Maroc) » European Scientific Journal April 2015 édition vol.11, No.11 ISSN: 1857 – 7881 (Print) e – ISSN 1857- 7.
- Office National de l’Eau Potable, (2007), étude d’assainissement du centre de Talsint et quartiers périphériques (province de Figuig). Rapport provisoire, Direction Régionale de l’Oriental, Maroc.
- Afnor, (1972). Echantillonnage. Précaution à prendre pour effectuer, conserver et traiter les prélèvements. T90-100.

This work is licensed under a Creative Commons Attribution 4.0 International License.
![]()
A New Edition of Web of Science
Journal Impact Factor
2022: 0.5
Five Year: 0.8
Journal is Indexed in

Cabells Whitelist
![]()


