Determination of Selected Toxic Trace Elements in Agricultural Soil and Wells Water Samples by ICP-OES
Malik Abdalla Abdelrahman Elsheikh1, Mohamed Hesham Hassan Mahmoud2,3 and Awad Abdalla Momen1,4
1Department of Chemistry, Faculty of Applied Medical Sciences (Turabah Branch), Taif University, Saudi Arabia.
2Department of Chemistry, College of Sciences, Taif University, Taif, Saudi Arabia.
3Central Metallurgical Research and Development Institute, P.O. Box 87, Helwan, Cairo, Egypt.
4Department of Chemistry, College of Applied and Industrial Sciences, University of Bahri , Khartoum, Sudan.
DOI : http://dx.doi.org/10.13005/ojc/330514
Agricultural soil and wells water that used for irrigation and drinking may contain high levels of toxic trace elements. In this study the concentration of Al, Ni, Co, Mn, Cr, Pb, As and Cd in agricultural soil and wells water samples from Turabah Province (Saudi Arabia) were determined by using Inductively coupled plasma optical emission spectrometer (ICP–OES) and microwave acid digestion techniques for soil samples. According to limit of detection (LOD) Co was not detected in all samples, while other studied trace elements (TEs) were detected in different concentrations values according to type and location of the sample. Furthermore, Al recorded at high values of concentration in some soil samples. The analysis method was validated in terms of accuracy, precision, limit of detection (LOD) and limit of quantification (LOQ) and confirmation reliability. The recovery percent was found to be between 91.6–103.4 %.
KEYWORDS:Trace Elements; Agricultural Soil; Wells Water; ICP-OES
Download this article as:| Copy the following to cite this article: Elsheikh M. A. A, Mahmoud M. H. H, Momen A. A. Determination of Selected Toxic Trace Elements in Agricultural Soil and Wells Water Samples by ICP-OES. Orient J Chem 2017;33(5). |
| Copy the following to cite this URL: Elsheikh M. A. A, Mahmoud M. H. H, Momen A. A. Determination of Selected Toxic Trace Elements in Agricultural Soil and Wells Water Samples by ICP-OES. Orient J Chem 2017;33(5). Available from: http://www.orientjchem.org/?p=38977 |
Introduction
Agricultural soil and wells water that used for irrigation may contain high levels of toxic trace elements such as aluminum, arsenic, cadmium, lead, mercury, cobalt, chromium, beryllium and nickel may be hazardous to human health. Trace elements in soil cannot be decomposed by microbial or chemical degradation, so the total contents and eco-toxicity of TEs persist in soils for a long time after introduction. These TEs may affect soil ecosystem safety, agricultural product quality and human health. The uptake of toxic metals can be directly by humans and animals through the inhalation of dusty soil or they may enter the food chain as a result of their uptake by edible food (plants and animals) or leach down to groundwater and contaminate drinking water resources, and may cause, in both cases, hazards to humans and animals health1-4. Trace elements have both positive and negative impacts on human health. Although some elements (e.g. lead and cadmium,) are considered to have only toxic effects, many TEs provide beneficial effects up to certain exposures before exhibiting detrimental effects, and in some cases (e.g. Se) the concentration window of beneficial effects is extremely narrow. Adding an extra level of complexity is the influence of the chemical form of the element. The bioaccessability, bioavailability and transformation of an element in humans depend on which elemental species is ingested. The importance of this type of information for environmental and human health has driven the area of research known as elemental speciation analysis, where by those methods were developed to identify and quantify the various species of an element5. All TEs are toxic if consumed at sufficiently high levels for long enough periods. The difference between toxic intakes and optimal intakes to meet physiological needs for essential TEs is great for some elements but is much smaller for others.
Accumulation of TEs in human body leads to different types of diseases such as cancer, cardiovascular, hair loss, nail damage and kidney diseases. There are more than 10 million new cancer cases each year, that cause of approximately 12% of all deaths. Given this, a large number of epidemiologic studies have been undertaken to identify potential risk factors for cancer, amongst which the association with TEs has received considerable attention6. Trace elements, such as Se, Zn, As, Cd, and Ni, are found naturally in the environment, and human exposure derives from a variety of sources, including air, drinking water, and food. The carcinogenic capability of trace metals depends mainly on factors such as oxidation states and chemical structures.
Different Techniques have been developed for the analysis of TEs to increase the accuracy of the low amount in matrices. Some factors affect the choice of an analytical technique, including susceptibility to matrix effects, the range of elements covered the detection limits and suitability for the matrix of interest. The usefulness of an analytical method for TEs analysis also depends on the range of elements covered and the order of magnitude of its DL for the elements at the top and bottom of its sensitivity range7.
Historically, atomic absorption spectrophotometers (flame and furnace) have been the instruments of choice for most soil analysis. Recently, ICP-OES has been used to provide fast and multi-element analysis of soil samples. ICP-OES is rugged and can handle a higher dissolved solid content, which is important in the analysis of soils8.
Elsheikh et al.9 and Elsheikh7 studied the concentration of 22 TEs in drinking water of Turabah Province (Saudi Arabia) by using ICP-OES, they found that the concentration of some TEs are blew the maximum level that recommended by World Health Organization (WHO) and Saudi Arabian Standard Organization (SASO), while others elements concentrations are above the maximum level. Momen et al.10,11 studied the concentration of some important TEs such as Al, B, Ba, Cd, Cr, Cu, Mn, Pb and Zn in human blood and urine samples by using digestion procedure and ICP-OES, Also Momen et al.12 studied TEs in scalp hair and fingernails as biomarkers in clinical studies by using ICP-OES. Eight TEs (Cd, Co, Cr, Cu, Mn, Ni, Pb, and Zn) in soil samples were determined by using ICP-OES after Microwave acid digestion versus aquaregia extraction, very low LOD were obtained, (i.e. below 0.05 μg g-1), for all elements, except for Zn, 2.3 μg g-1 was obtained13.
Microwave digestion in sealed containers have become popular and are widely used the technique provides rapid, safe, and efficient digestion and is not susceptible to losses of volatile metals14. This technique been adopted by the EPA (EPA Methods 3051 and 3051a) to extract metals from sludge, soil or sediment15,16. In addition, with microwave digestion, analysis time can be greatly reduced.
The present study aimed to determine and evaluate the concentration of essential and toxic trace elements including, Al, Ni, Co, Mn, Cr, Pb, As and Cd in agricultural soil and wells water samples from Turabah Province (Saudi Arabia) by using ICP–OES. Also this study was aimed to compare and contrast the level of the toxic TEs in agricultural soil and wells water. Furthermore, the conductivity and the pH of the wells samples were measured to investigate correlation between their values and the concentrations of the TEs under the study.
Materials and Methods
Samples Collection and Preparation
Forty five representative water samples were collected from 15 wells in Turabah province (Figure 1). The water of all these wells is used in irrigation for different types of the plant. The samples were taken at different interval period. The depth and the age of the wells were recorded. The well water samples were directly filtered through a 0.45 μm pore diameter membrane filter at the time of collection and transferred to polyethylene bottles (metal free containers will be used). Sixty samples of agricultural soil were collected from 10 sampling points at the same area of the wells from the surface and depth of 25 cm length by using a hand-held polyethylene spoon after autumn season (Figure 2). Three samples of each point (each of them about 500 g) were reduced to one representative sample by coning and quartering. After that the soil samples dried at 1100Cand ground to pass through 63 μm nylon grid sieve and transferred to polyethylene bottles (metal free containers will be used), until analysis.
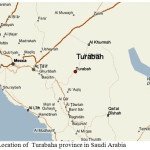 |
Figure 1: Location of Turabaha province in Saudi Arabia
|
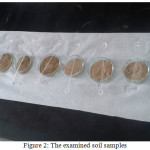 |
Figure 2: The examined soil samples
|
Approximately 0.25 g of each agricultural soil samples was weighed directly into the PTFE-TFM digestion vessel liners. Nine ml of concentrated nitric acid, 3.0 ml of concentrated hydrofluoric acid, 2.0 ml concentrated hydrochloric acid and 1.0 ml of hydrogen peroxide were added to each vessel. Some vessels contained only the acids and hydrogen peroxide with no soil sample to act as analytical reagent blanks. The vessels were sealed and placed into the rotor of microwave digestion. After digestion was completed, the digestates were transferred to 50.0 ml volumetric flasks, and diluted to 50.0 ml with De-ionized distilled water (DDW).
Instrumentation and Conditions
Inductively Coupled Plasma Optical Emission Spectrometer
Calibration of Inductively coupled plasma optical emission spectrometer (Perkin Elmer. Optima 2100 DV, USA was used to analyze the standard and the sample solutions. The ICP-OES operating conditions were optimized to maximize the sensitivity for the desired analytes and to obtain the best precision and accuracy (Table 1).
Table 1: Operating parameters for determination of selected TEs by ICP-OES
|
Parameter |
Value |
|
Power |
1600 watts |
|
Frequency |
40.68 MHz |
|
Nebulizer Flow |
0.60 L/min Argon |
|
Plasma flow |
15 L/min Argon |
|
Auxiliary Flow |
0.2 L/min Argon |
|
Pump Rate |
2.0 ml/min |
TEs=Trace Elements
Microwave Digestion System
Microwave accelerated reaction system (MARS), CEM was used with TFM (tetrafluormethaxil) vessels for digestion of soil samples.
pH Meter
HANNA instruments, Model Hi2210 pH meter was used to measure the pH of water well samples.
The Conductivity Meter
HANNA instruments, Model EC 215 conductivity meter was used to measure the conductivity of water well samples.
Statistical Analysis
The results were statistically evaluated by Q-test, F-test, and ANOVA test (P=0.05), in addition, Microsoft Excel and Origin software’s were also used. The concentration values obtained were expressed as average value ± confidence interval (at 95% confidence). All statistical analysis was based upon triplicate measurements of all standards and samples.
Results and Discussion
The method was validated in terms of accuracy, precision, limit of detection (LOD) and limit of quantification (LOQ) and confirmation reliability (Table 2). The results obtained for the certified reference materials using microwave acid digestion yield a recovery of 91.6–103.4, The recovery of each metal is calculated based on the mean value for CRMs [(measured concentration (mg kg−1)/mean CRM certified value (mg kg -1))×100].
Table 2: LOD and LOQ for determination of selected TEs.
|
Element |
Wavelength (nm) |
LOD |
LOQ |
|
Al |
308.212 |
0.0055 |
0.964 |
|
Pb |
220.353 |
0.0062 |
0.086 |
|
Cd |
226.502 |
0.0007 |
0.013 |
|
As |
188.979 |
0.0054 |
0.046 |
|
Cr |
267.716 |
0.0012 |
3.471 |
|
Mn |
257.610 |
0.0005 |
0.006 |
|
Ni |
231.604 |
0.0011 |
0.003 |
|
Co |
238.892 |
0.0008 |
0.007 |
LOD=Limit of Detection; LOQ=Limit of Quantification
The pH of the wells water samples were found to be in the range 7.71 – 8.36 (Table 3), while the conductivity of the same samples were found to be in the range 430 – 7000 μs (Table 3). The conductivity range seem to be in wide range, this indicate that the great different between the constituent of the wells water samples, the correlation coeffiention (R) between the pH and the conductivity is -0.933 which indicate that the relation between the pH and the conductivity is inverse proportional (Figure 3). The results in Table 4 show that the absent of Ni, Mn and Co metal in wells water samples due to the LOD of each element, the absent of Mn in the well samples was in contrast with the results obtained by Elsheikh who found that the concentration of Mn was above the level that recommended by WHO and SASO.7 The results in Table 4 also indicate that Cd detected in 2 samples only with concentrations higher than 0.003 ppm which it is above the limit recommended by WHO and SASO for drinking water (Table 5). Chromium were detected in 3 samples only with concentrations less than 0.05 ppm which it the normal limit that recommended by WHO and SASO. Arsenic and lead detected in 6 and 5 samples respectively 2 of which contain high value than that recommended by WHO and SASO. While 3 of them there values are below the limit that recommended by WHO and SASO. Aluminum was detected in 13 samples, all values are lower than the recommended values by WHO and SASO for drinking water, this agree with the results obtained by Elsheikh et al.9 In all values obtained of the TRs under study there is no high values except Pb concentration in sample number 7 (Figure 4). Table 6 and 7 show no Cd and Co were detected in all samples at surface or depth of the soil. Moreover Al, As, Cr, Mn, Ni, and Pb were detected in all samples with different values. The concentration of AL was in the range of 16.33 – 104.2 ppm with average value of 67.47 ppm for the surface samples, while it is range 5.93 – 76.98 ppm with average value of 43.061 ppm for the depth samples (Figure 5). Manganese show concentration values in the range 2.559 – 4.338 ppm with average value of 3.157 ppm for the soil surface samples and for the soil depth samples the range is 2.14 – 3.54 with average 2.804. Figure 6 show average values of Cr, Ni, As and Pb and for surface and depth of the soil samples, its indicates that Cr and Pb have higher values compared to Ni and As, Ni show some higher values in 2 samples of soil surface samples, but Ni was not detected in the soil depth samples (Figure 7). The average values of Cr, Ni, As and Pb in the surface samples were found to be 0.261, 0.147, 0.044 and 0.067 ppm respectively, while for depth samples were found to be 0.229, 0.00, 0.043 and 0.028 ppm respectively (Table 6,7 ). Aluminum concentration show high values compared to all other element under studies. Furthermore, in some surface samples they show very high concentration values reach above 200 ppm. The concentrations of the all TEs obtained in this study were lower than the results obtained by Uriah and Shehu whose studied the contamination of the agricultural soil in Nigeria.17
 |
Table 3: The pH and conductivity of the wells water samples Click here to View table |
 |
Table 4: Concentration (ppm) of selected TEs in wells water samples Click here to View table |
ND = Not Detected
Table 5: WHO and SASO Guide line for selected TEs maximum limit
|
Element |
Concentration (ppm) |
|
|
WHO Standard |
SASO Standard |
|
|
Al |
0.2 |
0.2 |
|
Pb |
0.01 |
0.01 |
|
Cd |
0.003 |
0.003 |
|
As |
0.01 |
0.01 |
|
Cr |
0.05 |
0.05 |
|
Mn |
0.5 |
0.5 |
|
Ni |
0.02 |
0.02 |
|
Co |
NL |
NL |
NL = No Limit Listed
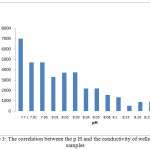 |
Figure 3: The correlation between the p H and the conductivity of wells water samples Click here to View table |
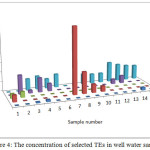 |
Figure 4: The concentration of selected TEs in well water samples Click here to View figure |
Table 6: Concentration (ppm) of selected TEs in soil surface samples
|
Element |
Sample number |
Average value |
|||||||||
|
1 |
2 |
3 |
4 |
5 |
6 |
7 |
8 |
9 |
10 |
||
|
Concentration (ppm) |
|||||||||||
|
Al |
80.54 |
104.2 |
45.11 |
34.9 |
16.33 |
208.8 |
45.52 |
47.49 |
41.59 |
50.22 |
67.47 |
|
Pb |
0.043 |
0.034 |
ND |
0.081 |
0.122 |
0.111 |
0.04 |
0.106 |
0.057 |
0.079 |
0.067 |
|
Cd |
ND |
ND |
ND |
ND |
ND |
ND |
ND |
ND |
ND |
ND |
ND |
|
As |
0.132 |
0.119 |
0.028 |
ND |
ND |
ND |
0.048 |
0.054 |
0.028 |
0.028 |
0.044 |
|
Cr |
0.296 |
0.264 |
0.162 |
0.256 |
0.310 |
0.33 |
0.249 |
0.236 |
0.253 |
0.253 |
0.261 |
|
Mn |
3.554 |
3.604 |
2.559 |
3.101 |
3.311 |
3.152 |
2.696 |
4.338 |
2.627 |
2.627 |
3.157 |
|
Ni |
0.152 |
0.911 |
0.023 |
ND |
ND |
ND |
ND |
0.297 |
0.041 |
0.041 |
0.147 |
|
Co |
ND |
ND |
ND |
ND |
ND |
ND |
ND |
ND |
ND |
ND |
ND |
ND = Not Detected
Table 7: Concentration (ppm) of selected TEs in soil depth samples
|
Element |
Sample number |
Average value |
|||||||||
|
1 |
2 |
3 |
4 |
5 |
6 |
7 |
8 |
9 |
10 |
||
|
Concentration (ppm) |
|||||||||||
|
Al |
60.14 |
66.66 |
56.36 |
51.38 |
5.93 |
76.98 |
22.87 |
32.92 |
30.52 |
26.85 |
43.061 |
|
Pb |
0.037 |
ND |
ND |
0.022 |
ND |
0.018 |
0.074 |
0.004 |
0.025 |
0.101 |
0.028 |
|
Cd |
ND |
ND |
ND |
ND |
ND |
ND |
ND |
ND |
ND |
ND |
ND |
|
As |
0.084 |
0.074 |
0.036 |
0.067 |
0.012 |
0.105 |
ND |
0.004 |
0.014 |
0.03 |
0.043 |
|
Cr |
0.270 |
0.162 |
0.234 |
0.245 |
0.145 |
0.234 |
0.165 |
0.287 |
0.244 |
0.301 |
0.229 |
|
Mn |
3.539 |
2.186 |
2.620 |
2.802 |
2.14 |
2.187 |
3.321 |
2.692 |
3.011 |
3.54 |
2.804 |
|
Ni |
ND |
ND |
ND |
ND |
ND |
ND |
ND |
ND |
ND |
ND |
ND |
|
Co |
ND |
ND |
ND |
ND |
ND |
ND |
ND |
ND |
ND |
ND |
ND |
ND = Not Detected
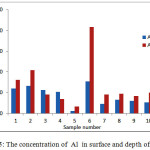 |
Figure 5: The concentration of Al in surface and depth of the soil Click here to View figure |
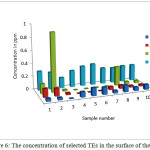 |
Figure 6: The concentration of selected TEs in the surface of the soil Click here to View figure |
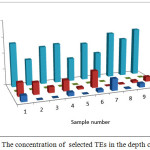 |
Figure 7: The concentration of selected TEs in the depth of the soil Click here to View figure |
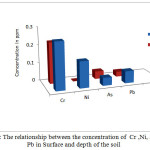 |
Figure 8: The relationship between the concentration of Cr ,Ni, As and Pb in Surface and depth of the soil Click here to View figure |
From the results, it was indicated that there were positive correlation between the concentrations of soil surface samples and the soil depth samples for Cr, Ni, As and Pb (correlation coefficient equal 0.80),while for the Al is equal to 0.77 (When the correlation coefficient is equal to 0.60, the relation is high).
Conclusions
For wells water samples the TEs under studies were detected in low concentration or not detected at all according to LOD of element. In soil samples Cd and Co were not detected in both soil surface and soil depth samples, while Ni was not detected in the depth of the soil samples. All other TEs were detected in different concentration range, but generally are low, while Al was detected in some samples with high concentrations. So intensive study to Al on it is transfer pathway soil-plant and it is concentration in plant is recommended. The future proposed study should base on characteristics of hazards and risk degrees caused by soil pollution.
Acknowledgements
The authors gratefully thank the dean of the Deanship of Scientific Research, Taif University, Saudi Arabia for sponsoring this project.
References
- Gleyzes, C.; Tellier, S.; Astruc, M. Trends Anal Chem. 2002, 21, 451.
CrossRef - Moreno, DA.; V´ıllora, G.; Soriano, MT.; Castilla, N.; Romero, L. J Environ Manage. 2005, 74, 89.
CrossRef - Tuzen, M. J Trace Microprobe Tech. 2003, 21, 513.
CrossRef - Senesil, GS.; Baldassarre, G.; Senesi, N.; Radina, B. Chemosphere. 1999. 39,343.
CrossRef - Kevin, A.; Francesconi, Doris K.; Sabine, K.; Georg, R. J of Trace Elements in Medicine and Biology. 2011, 5, 25S2.
- Stephanie, A.; Navarro, S.; Thomas, E. Rohan. Cancer Causes & Control. 2007, 18, (1), 7-27, February.
- Elsheikh, M.A.A.; J Environ Anal Toxicol. 2016, 6, 382. doi:10.4172/2161-0525.1000382.
- Praveen, S. Application Note ICP-Optical Emission Spectroscopy 2012, PerkinElmer, Inc. Shelton, CT 06484 USA.
- Elsheikh M.A.A.; Ali D.M.H.; Momen, A.A.; Khalid, M.A.A.; Int J.Multidisciplinary and Current research. 2015, 3, 13-22.
CrossRef - Momen, A.A.; Ali, D.M.H.; Khalid, M.A.A.; Elsheikh, M.A.A. Open Science Repository Chemistr. 2013; e70081933. doi: 10.7392 / Chemistry.70081933.
- Momen, A.A.; Khalid, M.A.A.; Elsheikh, M.A.A.’ Ali, D.M.H. J Health Spec. 2013,1,122-8.
- Momen, A.A.; Khalid, M.A.A.; Elsheikh, M.A.A.; Ali, D.M.H. J Health Spec.2015,3,28- 34.
CrossRef - Melaku, S.; Dams, R.; Mqens, L. Analytica Chimica Acta. 2005, 543, 117–123.
CrossRef - Hewitt, A.D.; Reynolds, C.M. Atomic Spectrosc. 1990, 11, 187-192
- Robache, A.; Mathe, F.; Galloo, J.C.; Guillermo, R. Analyst. 2000, 125, 1855.
CrossRef - U.S. Environmental Protection Agency. Method 3051a: Microwave assisted acid dissolution of sediments, sludges, soils, and oils. 1997, 2nd ed. U.S. Gov. Print. Office, Washington, DC.
- Uriah, L.A; Shehu, U. American Journal of Environmental Protection. 2014, 3(6-2);1-13. doi: 10.11648/j.ajep.s.2014030602.11.

This work is licensed under a Creative Commons Attribution 4.0 International License.
![]()
A New Edition of Web of Science
Journal Impact Factor
2022: 0.5
Five Year: 0.8
Journal is Indexed in

Cabells Whitelist
![]()


