Use of Pure and N, S-Codoped Bimetallic Cerium Cadmium Oxide Nanoparticles as Photocatalyst for the Photodegradation of Fast Green
Jyoti Sharma and K. L. Ameta
Department of Chemistry, Mody University of Science and Technology, Lakshmangarh-332311; Rajasthan, India.
Corresponding Author E-mail: klameta77@hotmail.com
DOI : http://dx.doi.org/10.13005/ojc/330449
Photocatalytic degradation of fast green using pure and N-Scodopedbimetal nanoparticles CeCdO3has been studied. The CeCdO3nanoparticles were synthesized by wet precipitation method and characterized by X-ray diffraction (XRD), scanning electron microscopy (SEM) and FTIR. The rate of photocatalytic reaction was examinedspectrophotometrically using pure and N, S-codoped catalyst. The effect of variation in parameters like pH, concentration of dye, amount of nanoparticle, dopant percentage and light intensity on the photocatalytic degradation of dye was studied. A tentative mechanism for the photocatalytic degradation has been suggested.
KEYWORDS:Fast green; N; S codoped cerium cadmium oxide; photodegradation
Download this article as:| Copy the following to cite this article: Sharma J, Ameta K. L. Use of Pure and N, S-Codoped Bimetallic Cerium Cadmium Oxide Nanoparticles as Photocatalyst for the Photodegradation of Fast Green. Orient J Chem 2017;33(4). |
| Copy the following to cite this URL: Sharma J, Ameta K. L. Use of Pure and N, S-Codoped Bimetallic Cerium Cadmium Oxide Nanoparticles as Photocatalyst for the Photodegradation of Fast Green. Orient J Chem 2017;33(4). Available from: http://www.orientjchem.org/?p=34712 |
Introduction
Historically speaking, evidence has been found that textile dyeing existed even during the Neolithic period. In areas as far as Far East (in china) dyeing was done in about 3000 BC and for this plants, barks and insects were used1. Various dyes are used in dyeing, paper and pulp, textile, plastics leather, cosmetics and food industries. Dyes are usually complex aromatic molecular structure and hence they are difficult to biodegrade2.A number of industries use dyes to provide color to their products. Traces of dyes are always present in waste water from such industries3-6.
A number of methods are used for dye removal which includecoagulation and flocculation, oxidation or ozonation and membrane separation7. For purifying and complete mineralizing of organic pollutants in industrial waste water and air, the heterogeneous photocatalytic process is one of the upcoming and fast growing research area8. Research has been carried out using 3-d transition metal ions for the preparation of ternary oxides so that these ternary oxides becomes more applicable in visible range .It is possible to change redox potential with change in size of nanoparticle, which in turn effects photocatalytic activity9-12.
For degradation of fast green various methods such as FCF using Azardirachtaindica (neem) leaf powder has been reported13. Preparation from Gloriosasuperba pericarp and live fungal biomass of Altenariaraphani has been used by adsorption techniques under different condition of agitation time, dye concentration, adsorbent dose and pH14. Bleaching of fast green using ammonium phosophatemolybdate has been repoted by D.scahdeva15.Degradation of fast green dye, paper dyeing and printing effluent by using ZnO/ZrO2 nanoparticles by electrochemical method is reported by G.Chaitanya16. Use of nano-sized cerium copper oxide for bleaching of yellowish orange and fast green has been reported by Induet al.17-18.Mittal and co-workers19reported removal of fast green from waste water by adsorption over deoiled soya and bottom ash from agricultural and power plant waste. Photocatalysis has been considered as promising technology as photocatalytic process can mineralize the hazardous organic chemical to CO2,H2O and simple ions20.
The present research focuses on using pure and doped cerium cadmium oxide as semiconductor for the degradation of fast green.
Experimental
Materials and Methods
The fast green dye was procured from the company SD-Fine Chem and was used as such. The preparation of dye solution was done using doubly distilled water as and when needed. A 200 W tungsten lamp was used as source of light. UV visible spectrophotometer (Systronics model 106) was used for measuring optical density at varying time intervals. Optimum pH of the solution was maintained using standardized H2SO4 and NaOH solutions.
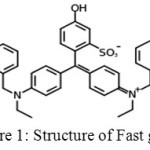 |
Figure 1: Structure of Fast green |
Synthesis of Bimetal Cerium-Cadmium Oxide
Preparation of CeCdO3– Cerium-Cadmium oxide was prepared by mixing aqueous solution of 1M of both Ce (NO3) 3.6H2O and Cd (NO3).H2O with continuous stirring. The pH of the reaction mixture was adjusted to 8 by adding 1 M NaOHdropwise. Complete precipitation was observed. The color of the solution changed from off white to light brown. After 4 hours of stirring the Precipitate formed was filtered and washed several times with cold distilled water.The residue was dried in oven at 110o C for 4 hours & then grounded with acetone in mortal & pestle the powder was then calcined at 5000C for 4 Hours in a muffle furnace.
Preparation of N, S Doped CeCdO3
Doped nanoparticles of different % are prepared by stirring similar amount of nanoparticles CeCdO3 and thiourea in 100 ml of water for 5 hours. Then the mixture was filtered and washed many times with cold distilled water. After that filtrate was dried for 4 hours at 800C and calcined at 4000 C for 4 hours. Using varying amounts of dopant source 0.5, 2.0, 1.5, 2.0, and 2.5 % respectively, a yellow N, S co-doped CeCdO3 powder was prepared.
Fourier Transform Infrared (FTIR) Spectroscopy
The Fourier transform infrared spectrum of pure and N, S-Codoped CeCdO3 was recorded using Perkin Elmer spectrophotometer. Spectrum was observed in the range of 400-4000 cm-1. (Figure 2 and 3)
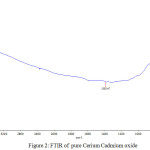 |
Figure 2: FTIR of pureCerium Cadmium oxide |
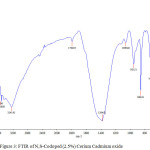 |
Figure 3: FTIR of N,S-Codoped (2.5%) Cerium Cadmium oxide |
X-Ray Diffraction (XRD)
The XRD pattern of cerium-cadmium oxide is shown below Figure-4. The 2Ө values (in degrees have been shown on the x-axis and intensity (cycles per second) has been shown on the y-axis). For general considerations, 2Ө values range from 20º to 80º, as the characteristic peaks for ternary oxides of cerium and lanthanum with transition metals appear in the same range. The synthesized catalyst is in nanoform (33.75)as determined by the Scherer equation. (Figure-4)
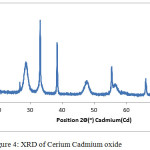 |
Figure 4: XRD of Cerium Cadmium oxide Click here to View figure |
Scanning Electron Microscope (SEM)
SEM has been used to identify and for morphological characterization of nano CeCdO3.Scanning electron microscope was used for conduct of surface and morphological studies using Jeol JSM-390 LV with EDS (INCA) as shown in Figure 5. (N, S-Codoped CeCdO3) and Figure 6.(Pure CeCdO3).
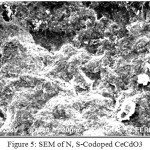 |
Figure 5: SEM of N, S-Codoped CeCdO3 Click here to View figure |
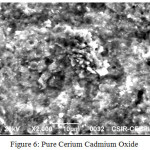 |
Figure 6: Pure Cerium Cadmium Oxide |
Photocatalytic Degradation of Dye using Cerium Cadmium Oxide
Doubly distilled water was used for preparing a stock solution of fast green (1.0x 10⁻³ M). Dilution of the stock solution was done as per requirement.The absorbance of dye solutions was determined with help of U-V visible Spectrophotometer at maximum λ= 620nm. A dye solution of 1.40 x10⁻⁵ M concentration was prepared in double distilled water and 0.04 gm of CeCdO3was added to it. The pH of reaction mixture was kept at 6.5 for this solution and was exposed to 200W tungsten lamp. It was found that with increase in time of exposure,observance of fast green dye solution got decreased.Decrease in observance indicates that dye was degraded on irradiation. It was also noted that 1+ log ODenjoyed a linear relationship with time. Hence it can be deduced that the reaction follows pseudo first order kinetics. The rate constant was calculated by using k = 2.303 x slope.
The typical run for the photo catalytic degradation of dye in presence of pure CeCdO3and N, S- doped CeCdO3is shown in Table 1andpresented in the form of graph in Figure 7.
Table 1: A Typical Run
pH = 6.5 Fast green = 1.40 x 10⁻⁵ M
Nanoparticle = 0.04 gm (2.5%) Light Intensity = 40.0 mWcm-2
|
Time (Min) |
Pure CeCdO3 |
N, S Co-doped – CeCdO3 |
||
|
Optical Density |
1+log OD |
Optical Density |
1+log OD |
|
|
0 |
1.196 |
1.078 |
1.196 |
1.078 |
|
20 |
1.045 |
1.019 |
0.912 |
0.960 |
|
40 |
0.892 |
0.950 |
0.662 |
0.821 |
|
60 |
0.749 |
0.874 |
0.451 |
0.654 |
|
80 |
0.602 |
0.780 |
0.309 |
0.490 |
|
100 |
0.502 |
0.701 |
0.215 |
0.332 |
|
120 |
0.413 |
0.616 |
0.152 |
0.182 |
|
140 |
0.325 |
0.512 |
0.112 |
0.049 |
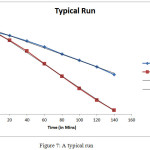 |
Figure 7: A typical run Click here to View figure |
Different parameters affecting photocatalytic degradation of the dye were varied and most optimum conditions for the degradation of the dye were determined.
Effect of pH
The impact of pH on Photocatalytic degradation was examined. The findings are shown in Table 2.
Table 2: Effect of pH
% of Dopant =2.5 Fast green = 1.40 x 10⁻⁵ M
Nanoparticle = 0.04 gm Light Intensity = 40.0 mWcm-2
|
pH |
kx10-4 |
|
4.0 |
0.85 |
|
4.5 |
1.25 |
|
5.0 |
1.72 |
|
5.5 |
2.02 |
|
6.0 |
2.42 |
|
6.5 |
2.82 |
|
7.0 |
2.40 |
|
7.5 |
2.09 |
|
8.0 |
1.64 |
It was reported that as the pH is increases, the rate of degradation of dye also increases.However this is true only up to 6.5 pH.If the pH is increased beyond 6.5, a decrease in the rate of photocatalysis is observed. It may because of negative charge on semiconductor and neutral form of dye, but dye is electron rich due to presence of lone pairs on two nitrogen atoms which results in repulsion between dye molecule and negatively charged surface of the semiconductor, which in turn results in decrease in the rate of reaction.
Effect of Concentration
The impact of concentration was also studied by taking varying concentrations of the dye. The findings are reported in Table 3.
Table 3: Effect of Concentration of Dye
% of Dopant =2.5 pH = 6.5
Nanoparticle = 0.04 gm Light Intensity = 40.0 mWcm-2
|
Con x 10-5 M |
K x 10-4 Sec-1 |
|
1.0 |
1.38 |
|
1.2 |
2.34 |
|
1.4 |
2.82 |
|
1.6 |
2.25 |
|
1.8 |
2.02 |
|
2.0 |
1.69 |
|
2.2 |
1.48 |
|
2.4 |
1.35 |
It was observed that as the concentration of the dye increased up to 1.40x 10 -5M it led to increase in the rate of dye degradation.However, if concentration of dye is increased beyond this it shows decline in dye degradation. Reason for this pattern may be, availability of more dye molecule for excitation but after further increase in concentration of dye, dye starts acting as a filter for the incident light Once the dye starts acting as a filter it becomes difficult for required light intensity to reach the semiconductor surface in a limited time period; Thus, decreasing the rate of reaction.
Effect of Amount of Semiconductor (N-S Codoped Cecdo3)
Amount of semiconductor also affects the rate of reaction, so varying amounts of semiconductors were used. The findings are shown in Table 4.
Table 4: Effect of Amount of N, S Co-Doped CeCdO3
pH = 6.5 Concentration of Dye = 1.40 x 10⁻⁵ M
% of Dopant = (2.5%) Light Intensity = 40.0 mWcm-2
|
Amount of N, S Co-Doped CeCdO3 |
K x 10-4 sec-1 |
|
0.02 |
2.25 |
|
0.04 |
2.82 |
|
0.06 |
2.63 |
|
0.08 |
2.49 |
|
0.10 |
2.45 |
|
0.12 |
2.4 |
|
0.14 |
2.35 |
|
0.16 |
2.32 |
The key findings are that as the amount of nanoparticle is increased rate of reaction also increased. The rate of bleaching of dye was optimum at 0.04g of the photocatalyst. With further increases in concentration of semiconductor, the rate becomes almost constant. It could be because with increase in the amount of semiconductor, there is no increase in the exposed surface area of the photocatalyst. As it causes only increase in the thickness of the layer of semiconductor. This can also be tested by taking reaction vessel of different dimensions.
Effect of Variation of Dopant
The impact of % of variation of dopant was observed by taking different % of dopant (Thiourea) .The findings are shown in Table 5.
Table 5: Effect of % Variation of Dopant
pH = 6.5 Concentration of Dye = 1.40 x 10⁻⁵ M
Amount = 0.04 g Light Intensity = 40.0 mWcm-2
|
Dopant % |
K x 10-4 Sec-1 |
|
0.5 |
1.60 |
|
1.0 |
1.90 |
|
1.5 |
2.20 |
|
2.0 |
2.54 |
|
2.5 |
2.82 |
A direct relationship between % of dopant and rate of reaction was noted. The optimum value reached at 2.5%.Thus up to 2.5% the value of rate constant increased with increase in % of dopant. after that, rate of reaction got decreased. This could be because of unavailability of free active sites of semiconductor after 2.5 % of doping and therefore, rate of reaction showed decreasing pattern.
Effect of Light Intensity
Impact of light intensity was studied by varying distance between light source and the exposed surface area. The findings are indicated in Table 6
Table 6: Effect of Light Intensity
pH = 6.5 Concentration of Dye = 1.40 x 10⁻⁵ M
Amount = 0.04 g % of Dopant = 2.5%
|
light Intensity |
k |
|
20 |
1.55 |
|
30 |
2.40 |
|
40 |
2.82 |
|
50 |
2.71 |
|
60 |
2.50 |
The results confirmed thatphotocatalysis was increased 20 to 50 mWcm-2. This can be explained as with increased light intensity the number of photons striking per unit surface area of semiconductor also increased. At the same time increase in light intensity also caused decreasedthe rate of reaction; the reason for thiscould be initiation of side thermal reaction.
Mechanism
Based on the above observation, an alternative mechanism for Photocatalytic degradation of Toluidine blue is suggested. (Figure 7)
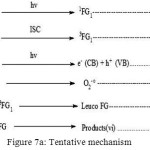 |
Figure 7a: Tentative mechanism Click here to View figure |
Degradation of dye occurs owing to the role of the OH radical as an active oxidizing species. The rate of degradation got negatively impacted in the presence of hydroxyl radical scavengers.
Conclusion
Doping of cerium cadmium oxide with non-metal reduces its band gap. It was observed from results of degradation of fast green by doped and pure cerium cadmium oxide that doping leads to higher rate constant
Acknowledgements
The authors gratefully acknowledge SAIF Chandigarh and CSIR CEERI –Pilani for the XRD and SEM facility respectively.
References
- Barber, E. J .W. ; Prehistoric Textile, Princeton University Press 1991 ISBN-0-0691-00224-X
- Bhattacharya, K.G;Sharma, A.; Dyes pigments,2005,65,51-59.doi.org/10.1016/j.dyepig.2004.06.016
CrossRef - Crini, G.Bioresource Technol.,2006,97,1061-085.doi.org/10.1016/j.biotech.2005.05.001
CrossRef - Forgass, E .; Serhatti, C. ; Oros , G,Environ.Int, 2004, 30,953-971
CrossRef - Kumar, M. M.; Kumar, S. N. Dye Pigments, 2004,62,221-228.doi.org/10.1016/j.dyepig.2003.11.002
- Ong, S. T.; Lee, C. K.; Zainal, Z. Bioresource Techol.2007, 98, 2792-2799.
CrossRef - Aksu, Z.Proc.Biochem, 2005, 40, 997-1026.doi-10.12691/ijebb-2-6-1
- Pal, B.; Sharom, M.;Nogami, N. J.Mater.Chem.Phys.1999, 59, 254-261.
CrossRef - Hoffmann, A. J; Mills, G; YEE, H; Hoffmann, M.R; J.Phy.Chem.1992,96,5546-5552.doi10.1021/j100192a067
CrossRef - Serpone. N; Lawless, D; Pelizzetti, E; Fine Part.Sci.Technol, 1996, 657-673. ISSN-1388-6576
- Nedelijkovic, J. M; Nenodovic, M. T; Micic, O. I; Nozik , A. J; J.Phy.Chem.1986, 12-13
- Anpo, M; Shima, T; Kodama, S; Kudokawa, Y; J.Phy.Chem.1987.91, 4305-4310
- Tahir, H.; Hammed, U.; Zahanzeb, Q.; Sultan, M. African J.Biotechnol.2008, 7(21), 3906-3911.
- Ramalakshmi, S.; Muthuchelian, K.; Swaminathan, K. J. Biosci.Res.2011, 2(4), 239-248.ISSN-0976-2272.
- Sachdeva, D.; Parashar, B.; Bharadwaj, S.; Punjabi, P. B.; Sharma, V. K.Int.J.ChemSci ,2010,8(2),1321-1328
- Chaitanya, L. G.; Ananda. S.; Somashekar. R.; Ranganathaiah .C.Int .J. Advan. Mater. Sci., 2012,3(3),221-231
- Bhati, I.; Ameta, R., Punjabi, P. B.;Ameta, S. C.Int. J. Chem. Sci.,2010,8(4),2784-2794.ISSN-0972-768
- Bhati, I.; Punjabi, P. B.; Ameta, S. C. MacedonianJ. Chem. Chemi. Eng.,201029(2),195-202.ISSN-1857-5532
- Mittal, A.; Kaur, D.; Mittal, J.J. Hazard.Mater., 2009,163,568-577.doi-10.1016/j.jhazmat2008.07.005
CrossRef - Ahmed, S. ;Ollis, D. F.Sol.Ener.1984,32,597-601
CrossRef

This work is licensed under a Creative Commons Attribution 4.0 International License.
![]()
A New Edition of Web of Science
Journal Impact Factor
2022: 0.5
Five Year: 0.8
Journal is Indexed in

Cabells Whitelist
![]()


