The Effect of the Hydraulic Retention Time on Organic Load in Aerated Lagoons under Arid Climatic Conditions at El-Oued (South-East Algeria)
Zobeidi Ammar, Bebba Ahmed Abdelhafid and Douadi Ali
Valuation Laboratory Saharan Resources Technology, University of Kasdi Merbah Ouargla P.O.Box 511, 30000 Ouargla, Algeria.
Corresponding Author E-mail: zobeidi.aa@gmail.com
DOI : http://dx.doi.org/10.13005/ojc/330434
This study detailed the effect hydraulic retention time on characteristics of the El-Oued aerated lagoons wastewater treatment plants (WWTPs), located in Southern East Algeria. The plant performance was evaluated through descriptive and statistical analysis of quantity and quality data of both raw wastewaters and treated effluent over a period of three years (2013 – 2015).Therefore, the downstream values of BOD5, COD and TSS, are enough to achieve a final effluent that would meet the Algerian standards limit.The retention time is a function of the percent removal of organic load. The retention time may vary from 12 to 20 days as the optimum operating conditions the removal efficiencies 86.5% of BOD5, 78% of CODand TSS 85%.Goodness of the model fit to the data was also evaluated through the relationship between the residuals and the model predicted values of BOD5r, CODr and TSSr. The advantage of this model is that it would allow a better process control.
KEYWORDS:Aerated lagoon; El-Oued; Organic load; Retentiontime; Wastewater treatment plant
Download this article as:| Copy the following to cite this article: Ammar Z, Abdelhafid B. A, Ali D. The Effect of the Hydraulic Retention Time on Organic Load in Aerated Lagoons under Arid Climatic Conditions at El-Oued (South-East Algeria). Orient J Chem 2017;33(4). |
| Copy the following to cite this URL: Ammar Z, Abdelhafid B. A, Ali D. The Effect of the Hydraulic Retention Time on Organic Load in Aerated Lagoons under Arid Climatic Conditions at El-Oued (South-East Algeria). Orient J Chem 2017;33(4). Available from: http://www.orientjchem.org/?p=34831 |
Introductıon
The region of El-Oued (south-east Algeria) had various water-related issues, discharging their highly-contaminated wastewater in the receiving environment without any treatment. This is an issue of growing concern because of side effects that pollutants can cause environmental and health problems. The choice of a wastewater treatment system in developing countries is subject to several criteria, the most important is the treatment efficiency of the system.
The wastewater treatment plant in aerated lagoons in the city of El-Oued she meets this criterion?
The purification of domestic wastewater system aerated lagoon remains among the most used in countries with hot climates arid to semi-arid processes. Since the late 2000, Algeria adopted for wastewater treatment in rural and urban centres aerated lagoon as the most suitable technical solution to the economic and climatic context1. Aerobic bacteria found in the aeration lagoon aerated lagoons consume oxygen dissolved in the medium for the oxidation of organic matterin the wastewater2-3. Oxygenation was, in the case of the aerated lagoon, provided mechanically by a surface aerator or air insufflations. This principle differs from activated sludge only by the absence of a recycling system for sludge or sludge extraction continuously. The energy consumption of the two streams is at equivalent capacity, comparable (1.8 to 2 kW / kg BOD5 eliminated)4.
In our work, it isthe characterization and quantification of some physicochemical parameters have provided a preliminary assessment of the degree of water pollution. Moreover, achieving optimal time stays through the Influenceof hydraulic retention time (HRT) onthe organic load of the effluent as a measure of the overall performance of a conventional WWTP under arid climatic conditions.
Materıals and Methods
Treatment System Description
The plant located 7 km to the South- Est of El- Oued city. It is in operation since July 2009 to serve 246.000 populations. The capacity of the plant is to treat 33.000 m3/day wastewater horizons for 2015, but the average current rate is 18.000 – 24.000 m3/day. Each the first two is aerated lagoon; the 3rd is a polishing lagoon (Figure 1). Earthen berms form the wells of lagoons and a synthetic liner prevents sewage from entering groundwater. Details of the plant are shown in Table 1.
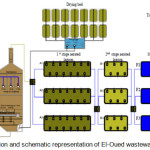 |
Figure 1: Localization and schematic representation of El-Oued wastewater treatment plant. Click here to View figure |
Table 1: Design description of the aerated lagoons in El-Oued
| Lagons | Aerated(A1, A2, A3) | Aerated(B1, B2, B3) | Maturation(F1, F2, F3) | |||
| Volume (m3)of each | 199413 | 133107 | 99810 | |||
| Dimensions (m) of each | 91×232,6×3,5 | 92,1×194,6×2,5 | 91,6×245,3×1,5 | |||
| No. Aerators of each | 39 | 18 | 0 | |||
Water Quality Analysis
Study was carried for a period of three years (2013 – 2015) and samples were collected on weekly basis from raw wastewater and treated effluent. Physico-chemical characterization of wastewater was made according to French standard (AFNOR, 1997)5.Temperature and pH wereanalyzedwith EUTECH Instruments 510 pH/mV/0C. Dissolved oxygen (DO) wasdetermined by an oximeter (model WTW inoLabOxi 730). Turbidity was measured by Turb 550 IR. The chemical oxygendemand (COD) was determined with the reactor digestion using a Spectrophotometer type WTW Photolab spectral analyzer (AFNOR T90-101). The 5-day biological oxygen demand (BOD5) was determined by the manometric method with a respirometer (BSB-controlled Model OxiTop WTW) (AFNOR T90 105). The suspended solids (SS) were determined by filtration and drying at 110°C (AFNOR T90-105)6.
Removal efficiency of studied plant was determined as the percentage of decrease in influent with respect to effluent for each parameter measured.
Statistical Analyses
All statistical analysis was performed using the XLSTAT (version 7.5.2)7. Simple correlations were used to determine if significant relationships existed between parameters concentrations in raw wastewater (dependent variables) and treated effluent (independent variables). Stepwise multiple regressions were used to determine which parameters were significant in forecasting the dependent variables (biological oxygen demand removal (BOD5r), chemical oxygen demand removal (CODr) and suspending solids removal (SSr)). Once the independent variables, significantly associated with dependent variables, the coefficients of determination (R2) for regression models were calculated. The relative contribution of each independent variable to the variation of dependent variables removal efficiencies in selected models was determined.
Results and Discussion
Plant Operation
During the present study the influent raw sewage was an average of 18,700 m3/day, ranged from 18,000 to 24,000 m3/day. The range of the Hydraulic retention time was(12–20) days. During this period, two aerated lagoons (A1, A2) in first stage, in second stage one aerated lagoon (B1- B2) and mostly one polishing lagoon (P1 or P2) were in service.
In-Situ Field Conditions
The major parameters that influence the removal mechanisms for organic matter in constructed wetlands are temperature, turbidity, dissolved oxygen (DO) and pH5. This is because organisms present in biological wastewater treatments are sensitive to these parameters.
During the investigation study, the average values of wastewater temperature are 19.31°C, 13°C and 25°C, respectively, and this were in the range with the meteorological means of 16.89°C, 10°C and 24.5(Figure. 2). they are similar to the airtemperature; the temperatures of the final effluent are still lower than those recorded in the influent these values are based on the sampling time and the weather.
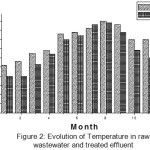 |
Figure 2: Evolution of Temperature in raw wastewater and treated effluent |
The turbidity values stored in the wastewater before treatment average values are 306 NTU, 202 NTU and 375 NTU. Regarding the treated water, there is a net reduction of this parameter whose values are within a range that is 13 NTU to 69 NTU, the average values are 33.73 NTU (Figure 3), these values are still lower than the Algerian standards rejection (50 NTU)8.
Then we see that in general a good return for their variation purified water under the effect of the temperature rise that promotes excessive algae growth, thus increasing the turbidity removal is greater in hot season (87.82%) in the cold season (93.52%).
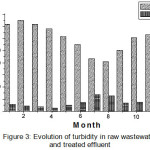 |
Figure 3: Evolution of turbidity in raw wastewater and treated effluent |
The variation of monthly average DO values in raw wastewater varied between 2013 and 2015 are 1.05 mg/L, 0.32 mg/L and 1.91 mg/L (Figure 4), low characterizing a wastewater inlet rich in dissolved organic and inorganic matter and disruption of air exchanges in interface due to the presence of fats, detergents … etc.)9.
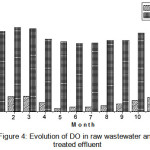 |
Figure 4: Evolution of DO in raw wastewater and treated effluent |
Regarding in treated effluent, DO levels recorded at the outlet are substantially greater than those of the entrance, the average values close to 7.50 mg/L,ranging of 6.65 mg/L to 8.81mg/L, this is due to ventilation of the water level of the basin aeration related surface aerators, necessary to develop the aerobic microorganisms ensuring the oxidation of organic matter, which leads to a good biological wastewater treatment. This value is almost invariable regardless of the period, but changes depending on the incoming organic filler10.
The pH is a fundamental factor for water quality which mainly depends upon a variety of chemical factors, e.g., dissolved gases, organic acids, humic fractions and inorganic salts. The decomposition of organic fractions of wastewater, mainly by microbes in water, produces some acidic species of mineralized organic materials (CO2, ammonia, NO3– and organic acids) which plays an important role in shifting of pH scale of treated water11.
During the study period (2013 – 2015), the treated effluent pH is mostly higher than that for the raw wastewater (Fig. 3). Measured pH values were consistently increased by between 0.53 and 0.98 units giving relatively stable monthly average pH effluent between 7.89 and 8.08.These results are consistent with those reported in the literature. According, SevrinReyssac et al 12, the alkaline pH and moderate temperature environment are ideal conditions for the proliferation of microorganisms which establish a perfect biological stability, allowing the degradation of organic matter resulting in the decontamination of water. This increase can be explained by an intense microbial activity in the activation lagoon where oxygen consumption therefore importance of a significant release of CO210.
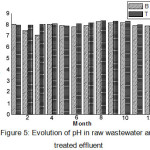 |
Figure 5: Evolution of pH in raw wastewater and treated effluent |
Organic Matter
The organic matter, expressed as BOD, COD and TSS, is decomposed by aerobic and anaerobic microbial processes and also by physical processes, such as sedimentation and filtration.
The variation of monthly average COD values, in treated effluent showed a trend which is not consistent with that of raw wastewaters (Figure 6). As regards to the results of the statistical analysis, lack correlation between raw wastewater and treated effluent (R2 = 0.75) ensures the dependence of downstream conditions on the other factors than upstream conditions. This fact could be assigned to an irregular work of aerators functioning. During the studied period, the monthly COD values was 80.86 mg O2/L exceeding Algerian standards (90 mg O2/L) confirm a chemical disequilibrium of the system8.
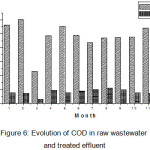 |
Figure 6: Evolution of COD in raw wastewater and treated effluent
|
Average BOD5 values in raw wastewater also varied between 2013 and 2015 (Figure 7). Its general trend is not similar to that of COD. It is characterized by a decreasing rate from 222.90 to 274.31mg O2/L. Moreover, it is important to note that over the period, the representative BOD daily average load was shown to be lower than the recommended value of 4648.82 Kg per day. As regards to the results of the statistical analysis, lack correlation between raw wastewater and treated effluent (R2 = 0.40).
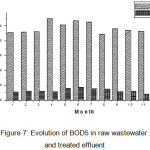 |
Figure 7: Evolution of BOD5 in raw wastewater and treated effluent Click here to View figure |
In treated effluent, the monthly average BOD5 values showed 32 mg O2/L, in general, the same decreasing trend as in raw wastewater. The decreasing rate of values is much more important in treated effluents. According Bliefert and Perraud13, the values of COD and BOD5 treated water are typical municipal water after biological treatment. Over the studied period, despite the conformity of upstream values to the recommendations, the downstream values are relatively low than Algerian standards (40 mg O2/L)8.
According to Metcalf & Eddy14, the ratio between COD and BOD5 can characterize the nature of the effluent entering the WWTPs 01 Kouinine, which may be domestic or industrial. It can be clearly seen that wastewater is readily biodegradable for all incoming wastewater, and is on average between 1.98 <2.5. This result confirms the absence of industrial waste connected to the domestic sewerage network.
Indeed, it averages lead to the conclusion that this is a gross impact readily biodegradable.
Over the period 2013 – 2015, the evolution of monthly TSS concentrations in raw wastewater showed similar trend to that of BOD5. It is characterized by two evolution phases: the monthly average values around 256 mg/L and varied from 202 mg/L to 303 mg/L. TSS concentrations in treated effluent varied from 12.5 to 59.9 and the mean value was 36.5mg/L(Figure 8). Statistical analysis shows also lack linearity (R2 = 0.39)between raw wastewater and treated effluent.
It is interesting to note that there is reduction of all parameters characterizing the organic load (COD, BOD5 and TSS). The overall removal efficiency of organic load in the system by 15 days’ retention time was 86.5% of BOD5, 78% of COD and 85% of TSS.
The statistical analysis showed a very strong (- ve) correlation between retention time and BOD5, TSS and COD (r = 0.92, 0.98, 0.64 and 0.41; p<0.05), respectively.
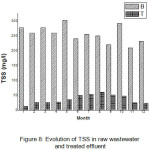 |
Figure 8: Evolution of TSS in raw wastewater and treated effluent Click here to View figure |
Multiple Regression and Predictive Models
A linear multivariate regression model estimates the behavior of a dependent variable based on several independent variables, provided that a linear relation exists between the dependent variable and the rest of parameters. The result of this analysis is a linear equation (y = ax1 + bx2 + cx3 + . . . + d). In the present work, the forward stepwise method was particularly conducted to test the relationship between each of the changes of BOD5, COD and TSS removal efficiencies and other variables. The independent variables included in the model were the retention time, CODw/BOD5w and rain water, as well as the influent and the effluent loading rates of COD, BOD5 and TSS. For each of the variables entered in the model, the forward selection calculates the F statistic reflecting the contribution of the test variable to the model. For the entrance of the variables into the model, a rather liberal significance level (p = 0.5) has been selected to ovoid the elimination of the significant factor. This procedure calculates the coefficient of determination (R2) for all models.
Table 2 depict predictive models constructed for predicting removal efficiencies of BOD5, COD and TSS, and predicted retention time values
Where;r: removal efficiency; w: raw wastewater; t: treated effluent, ts: retention time
Table 2: Predictive models and evaluation of fit
| Dependant variables | Predictor independent variables | Cont | R2 |
| BOD5r | DBO5(T)=0,101DBO5(W)- 4,151 ts | 83,20 | 0.86 |
| CODr | DCO (T)= 0,782 DCO (W) -50,24 ts | 542,31 | 0.78 |
| TSSr | TSS (T)= 0,1074 TSS (W) -3,905 ts | 89,16 | 0.85 |
Conclusins
The results presented show that the aerated lagoon process is effective in the treatment of urban waste water under the climatic conditions of the city of El-Oued located in Southern East Algeria. The plant performance was evaluated through descriptive and statistical analysis of quantity and quality data of both raw wastewaters and treated effluent over a period of three years (2011 – 2014).
Therefore, the downstream values of BOD5, COD and TSS, are enough to achieve a final effluent that would meet the Algerian standards limit. The retention time is a function of the percent removal of organic load. The retention time may vary from 12 to 20 days as the optimum operating conditions the removal efficiencies 86.5% of BOD5, 78% of COD and TSS 85%. Goodness of the model fit to the data was also evaluated through the relationship between the retention time, raw wastewater and the model predicted values of BOD5t, CODt and TSSt. The advantage of this model is that it would allow a better process control.
Nomenclature
BOD5: The 5-day Biochemical Oxygen Demand
COD: Chemical Oxygen Demand
DO: Dissolved oxygen
HRT: Hydraulic Retention Time
ISO: International Organization for Standardization
NTU: Nephelometric Turbidity Unit
TSS: Total Suspended Solids
WWTPs: Wastewater treatment Pants
Acknowledgment
The author is thankful to Dr. BEBBA Ahmed Abdelhafid and Dr. DAOUIDI Ali who helped as to do this research, also we: the author would like to thank MEHIDA Hicham and ABBANE Fathi the head of wastewater treatment plant in aerated lagoons Kouinine, for providing laboratory facilities.
References
- Duncan, M. In sewage treatement in hot climates:John Wiley & Sons. 1980,48,49.
- Francis, E. Le traitement des eaux usées dans les industries agroalimentaires, Rev.Nou. Sci.Tech.1989, 2(7), 83-89.
- Malina, J. F.; Yousef, Y. A. The fate of Coliform organisms in waste stabilization ponds, J. Wat. PollutControl Fed.1964, 36, 1432-1442.
- Agence de l’Eau Seine-Normandie. Guides des procédés épuratoires intensifs proposés aux petitescollectivités. 2001, ISBN 92-894-1690-4, 20.
- Rodier, J. ; Legube, B. ; Meriet N. Analyse de l’eau: eaux naturelles, eaux résiduaires, eau de mer. 2009, 9ème édition, 111-300,
- AFNOR, Association Française de Normalisation. Recueil des normes françaises : qualité de l’eau, Environnement, Paris, 1994.
- STATIT-CFServices des études statistiques de l’Institut Technique des Céréales et Fourrages (I.T.C.F). Boigneville.1987.
- Arrête interministériel. ; Les spécifications des eaux usées épurées utilisées à des fins d’irrigation. Journal officiel N°41 de la république algérienne démocratique et populaire.2012.
- Hazourli, S. ; Boudiba, L. ;ZIATI, M ; Caractérisation de la pollution des eaux résiduaires de la zoneindustrielle d’El-Hadjar, Annaba. Larhyss Journal. 2007, ISSN 1112-3680,2007.,06.,45-55.
- Zobeidi, A.; Bebba, A.A.; seasonal variations of physical, chemical parameters in a wastewater treatment plant by aerated lagoons at southern-east of Algeria,RJPBCS. 2015, 6 (3), 1097.
- Belhaja, D.;Jaabirib, I.; Turkic, N.;Azrid, C.;Kallele, M .;Ayadif, H, Descriptive and multivariable analysis of the water parameters quality of Sfax sewage treatment plant after rehabilitation, IOSR Journal of Computer Engineering. 2014,16,81-91.
CrossRef - Sevrin- Reyssac, J.; De La Noue, J.; Proulx, D. Le recyclagedu lisier de porc par lagunage.1995, Edition Technique et Documentation Lavoisier, 118.
- Briefer, C.; Perraud, R. Chimie de l’environnement: Air, Eau, Sols, Déchets.2001,Edition de Boeck, 317 – 477.
- Franklin Louis Burton, H. David Stensel, Metcalf & Eddy, Inc.Wastewater engineering: Treatment and Reuse..4ème Edition McGraw-Hill New York, 2003.,24-32.

This work is licensed under a Creative Commons Attribution 4.0 International License.
![]()
A New Edition of Web of Science
Journal Impact Factor
2022: 0.5
Five Year: 0.8
Journal is Indexed in

Cabells Whitelist
![]()


