Synthesized Superabsorbent Based on Cellulose from Rice Straw for Controlled-Release of Urea
Yusnaidar1,2, Basuki Wirjosentono1, Thamrin1 and Eddiyanto1,3
1Chemistry Postgraduate Programs, University of Sumatera Utara, Indonesia Jl. Bioteknologi No. 1, Kampus Padang Bulan, Medan, 20155.
2Chemistry Education Department, University of Jambi, Indonesia Jl. Raya Jambi-MuaroBulian, Mendalo Indah, Jambi, 36361.
3Chemistry Department, State University of Medan, Indonesia Jl. WilliemIskandarPasar V, Medan, 20221.
Corresponding Author E-mail: yusnaidar.yusnaidar@unja.ac.id
DOI : http://dx.doi.org/10.13005/ojc/330436
Rice straw was used as α-cellulose sources for synthesizing a novel α-cellulose-g-poly(acrylic acid)superabsorbent by graft polymerization betweenα-cellulose rice straw powder and acrylic acidin aqueous solution. The synthesis and controlled-release of fertilizer from superabsorbent wascarriedout.Thesuperabsorbentcomposite was characterized by FTIR, SEM and TGA. The results of FTIR spectra showed OH ofα-cellulose rice straw participated in graft polymerization with acrylic acid. The equilibrium water absorbency of superabsorbentwas investigated by calculating the swelling ratio. The superabsorbent composite was swollenin aqueous solution of urea to load urea. Furthermore, the release of urea from loaded superabsorbent was analyzedin water. Superabsorbent with the highest waterabsorbencyand the slowest profile of release controlled were obtained when the temperature of polymerization reaction was 70oC.
KEYWORDS:Superabsorbent; rice straw; α-cellulose; controlled-release; urea
Download this article as:| Copy the following to cite this article: Yusnaidar Y, Wirjosentono B, Thamrin T, Eddiyanto E. Synthesized Superabsorbent Based on Cellulose from Rice Straw for Controlled-Release of Urea. Orient J Chem 2017;33(4). |
| Copy the following to cite this URL: Yusnaidar Y, Wirjosentono B, Thamrin T, Eddiyanto E. Synthesized Superabsorbent Based on Cellulose from Rice Straw for Controlled-Release of Urea. Orient J Chem 2017;33(4). Available from: http://www.orientjchem.org/?p=35239 |
Introduction
Superabsorbent is a kind of polymer that able to absorb and hold large amount of water [1]. Superabsorbent polymers have been developed and used in daily life, such as infant diapers [2], feminine hygiene products [1], also have been used in specific area, such as in agriculture to prohibit the large amount of evaporation [3-4]. Usually for synthesis and develop superabsorbent, acrylate and its derivate was used for the main ingredient. Superabsorbent based only on poly(sodium)acrylate has several disadvantages such as, relatively high in production cost, not biodegradable, and not suitable to water and to soil rich with mineral contents [5-6].
Natural polymer, such as cellulose, is possible to develop as superabsorbent polymer through grafting modification to the main backbone of cellulose, whereas the techniques of grafting polymerization process are classified into such as photo-grafting, irradiation, and chemical initiation. The development superabsorbent polymer based on cellulose support by some previous researches, such as Chen Y. et al[7] provided cellulose superabsorbent through copolymerization and crosslinked between cellulose and vinyl’s monomer; Princiet al. [8] developed superabsorbent cellulose through copolymerization between cellulose and derivate of acrylate’s monomer (methyl methacrylate and ethyl acrylate); and Khan et al. [9] used okra fiber as cellulose’s source through grafting technique to acrylonitrile’s monomer with K2S2O8 and FeSo4 as initiator and catalyst, respectively.There have been manyreports on introducing cellulose, inorganic claysand chitosan into pure polymeric superabsorbents in order to improve swelling property, reduce production costs and ensure biodegradability [10-12]. However, the researches that focus on superabsorbent polymer based on crops residuesarerare. Rice straw is one of the source of cellulose with so many advantages, such as abundantly available, biodegradable, renewable, since these are waste biomass. The composition of rice straw consists of cellulose (36,5%), hemicellulose (33,8%), lignin (12,3%), extractive compound (3,8%), ash (13,3%), and silica (70,8%) [13].
The utilization of superabsorbent in agriculture areas can provide several advantages, such as decrease the consumption of water irrigation and the death of plant, increase the water availability in soil, decrease the probability of soil hardens, prohibit the erosion, and increase the fertilizer efficiency [14-16].The combination between superabsorbent and fertilizer in its application can increase the plant nutrition also decrease the negative impact of solvation of fertilizer[17]. The aim of this research focused on two points (i) synthesize of cellulose superabsorbent based on cellulose from rice straw and (ii) absorption and controlled-release of urea in water.
Experimental
Material
Rice straw is obtained from several paddy fields in TanjungMorawasubdistrict, regency of Deli Serdang, North Sumatera.Acrylic acid, K2S2O8, hydrochloric acid, sodium sulfite, sodium nitrite, sodium hypochlorite, hydrogen peroxide, sodium hydroxide, ethanol, and methanol are ordered from Merck Chemical. N, N-methylene-bisacrylamide is ordered from Sigma Aldrich. Those commercial chemicals are used without further treatments.
Isolation of α-Cellulose
The α-cellulose from rice straw was isolated using method Ohwoavworhua, F.O dan T.A. Adelakun [18] with some modifications.Rice straw powder (30 g) was first refluxed with 3,5% of nitric acid solution and 10 mg sodium nitrite at 90oC for 2 hours.The resulting residueswere washed and continued for further treatments with 2% of sodium hydroxide and 2% of sodium sulfite, at 50oC for 1 hour. Residues from digestion process were washed tillneutrality and the residues were hydrolyzed with 17,5% of sodium hydroxide at 80oC for 30 minutes then continued by treating the residues in 10% of hydrogen peroxide at 60oC for 15 minutes. The residues from bleaching process were washed tillneutrality and dried in oven at 60oC. The dried powder was characterized by FTIR, SEM, and TGA.
Preparation Cellulose Hydrogel
The cellulose from rice straw (800-100 mesh) and aquadest were reacted in the four-necks flask equipped with a magnetic stirrer bar, the flask is heated in a water bath at 95oCunder nitrogen atmosphere. After 30 minutes of cellulose treatment, the temperature was adjusted to 60oC and several supported components, such as potassium persulfate, acrylic acid, and NMBA were added to the flask. The temperature then adjusted to 70-80oC until the white color gel was obtained. The white gel was washed with methanol for 30 minutes, continued with ethanol for 5 minutes and dried in oven at 60oC until the constant weight was obtained. The white gel then characterized, including the microstructural morphologyby SEM, functional group by FTIR, and swelling ratio also controlled-release urea.
Swelling Capacity
Certain amountof dry sample, 0.1000 g, was put into a 200-mesh fastened nylon bag.Then, the bag was immersed into distilled water for 24 h to reach the swelling equilibrium at room temperature. Subsequently, the bag was liftedfrom water, while theresidual water was wiped up with filter paper, and weighed thebag.Theswelling ratiowascalculated using Eq. (1) [19]:
![]()
where Ms, M1and Mo refer to the weight of the swollen, dried cellulose hydrogel, and wet nylon bag,respectively.
Measurement of Urea Absorbency
Certain amount of cellulose hydrogel was immersed into a 100 ppm of urea solution (based on N content) and allowed to soak at room temperature for 24 hours.The swollen cellulose hydrogel was filtered to remove non-absorbed water and weighted. The swollen cellulose hydrogel was dried in oven at 60oC until the constant weight was reached. The remaining N content was measured by spectrometry UV/Vis technique.
Controlled-Release of Urea
To study the slow-release behavior of cellulose hydrogel in water, the following experiment was carried out: certain amount of cellulose hydrogel/urea was immersed in 250 mL of water and incubated for different periods atroom temperature. After 15, 30, 45, 60, 90, 120, 150, and 180 minutes, thereleasingurea in thesolutionwasmeasured by spectrometry UV/Vis technique.
Measurement of N Content
N content of urea was measured follow Watt and Crisp method [20]. With the volume of 5 mL of the urea solution was added to vial bottle, then the 2 mL of coloring agent was added to the solution till the equilibrium was reached and the absorbance was measured at 420 nm.
Result and Discussion
Isolation α-Cellulose from Rice Straw
α-cellulose was successfully isolated from rice straw powder by following Ohwoavworhua dan Adelakunmethod [18]. Delignification process was completely done by addition of 3,5% of HNO3 solution and NaNO2, those reagents caused conversion of lignin to become nitro lignin, this process provided 25, 70% of yield. On the second step, hydrolysis process, the reaction was completely done by addition of 2% of NaOH solution and 2% of Na2SO3, the aim of those solution is to remove hemicellulose, mineral, silica, and ash. On this step was followed by bleaching process with 1,75% of NaOCl and provided 15,84% of yield. The yield of each process was shown in Table 1.The color of the rice straw reduced in each step of processes, from brown to be white powder.
Table 1: Yield of α-cellulose
| Sample | % Yield | |||
| Delignification | hydrolysis | |||
| Weight (g) | % | Weight (g) | % | |
| Rice straw | 19,28 | 25,70 | 11,88 | 15,84 |
α-cellulose white powder from those processes was confirmed by FT-IR analysis (Fig. 1) and it was followed by characterizing the reference standard of α-cellulose standard.
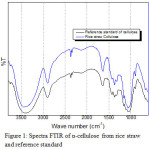 |
Figure 1: Spectra FTIR of α-cellulose from rice straw and reference standard |
In Fig 1. the α-cellulose from rice straw gave absorbency of OH vibration at 3411 cm-1, the stretching of C-H is shown at 2900 and 894 cm-1 while in reference standard α-cellulose the -OH peak is appeared at 3410 cm-1 and the C-H is appeared at 2916 and 894 cm-1. The details of wave number of α-cellulose absorbency were shown in Table 2.
Table 2: FTIR data of α-cellulosefrom rice straw and reference standard
|
Wave number (cm-1) |
Functional group | |
| Reference standard α-cellulose | Rice straw α-cellulose | |
| 3410 | 3411 | O-H stretching |
| 2900898 | 2900894 | C-H stretching |
| 1373617 | 1373609 | C-O stretchingC-O bending |
The microstructural morphology analysis of α-cellulose was shownup in Fig. 2. The morphology of α-cellulose fibers gave the appearance like fiber bundle. This result is close to the α-cellulose’s morphology reported in the literature[21].
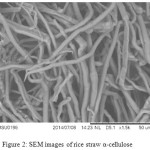 |
Figure 2: SEM images of rice straw α-cellulose |
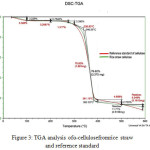 |
Figure 3: TGA analysis ofα-cellulosefromrice straw and reference standard |
Fig. 3 showed the TG curve analysis of α-cellulose standard and from rice straw. The thermal degradation of α-cellulose consists of a series of degradation reaction, such as dehydration and pyrolysis. The dehydration reaction occurred at 100oC, this weight loss was mainly due to the evaporation of water that binding on α-cellulose. While the pyrolysis reaction occurred at 338,93oC for α-cellulose standard and 350,01oC for α-cellulose from rice straw. Therefore, the rice straw α-cellulose is superior to that of α-cellulose standard. Obviously, the presence of other substituent (substituted group) on that cellulose skeleton is expected to influence thermos-stability. Those results were supported by the higher residue content in α-cellulose from rice straw than standard, 10, 77% and 8,25%, respectively.
Preparation and Characterization of Cellulose Hydrogel
The synthesized of cellulose hydrogel was done by polymerization reaction between α-cellulose and poly sodium acrylate in the presence K2S2O8 as initiator and NMBA as crosslinked agent. Fig. 4 displayed the proposed mechanism reaction of crosslinked superabsorbent between α-cellulose and poly sodium acrylate.
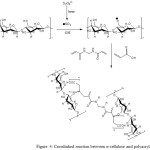 |
Figure 4: Crosslinked reaction between α-cellulose and polyacrylate |
The polymerization of cellulose and poly sodium acrylate followed the rule of polymerization step, such as initiation, propagation, and termination. During the polymerization, NMBA with two pieces of reactive double bonds can enter the chains of polymer simultaneously and form the permanent bonding between each chain (crosslinking). The degree of crosslinking influences the swelling ability of cellulose hydrogel. The swelling ability of hydrogel decrease with the increasing of degree of crosslinking. In the end of the reaction cellulose hydrogel has white color and chewy texture.
Swelling ratio has linear correlation to the absorbency capacity, the highest the swelling ratio the highest the absorbency capacity of hydrogel,in this research the hydrogel was immersed for 24 hours. The swelling ratio data is showed in Table 3 and Fig.5.
Table 3: Swelling ratio of cellulose hydrogel
| No. | Temperature (oC) | Mo (g) | Mt (g) | S |
| 1 | 70 | 0.1662 | 37.5982 | 225,2226 |
|
2 |
80 | 0.1671 | 25.2402 |
150,0484 |
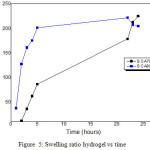 |
Figure 5: Swelling ratio hydrogel vs time |
The rate of swelling of cellulose hydrogel progresses slowly because when the hydrogel contact with water, the outer side of hydrogel is dry. The impact is the hydrogel in water will form two phases, such as the swollen hydrogel and dried polymer. The process of water enters into the hydrogel occurred through diffusion process [22]. Table 3 showed the cellulose hydrogel that prepared at 70oC of temperature has the highest swelling ratio, 225,2226. These differentiate are influenced by the degree of crosslinking of hydrogel. The increasing of degree of crosslinking of hydrogel can decrease the swelling ability but it can increase the mechanic properties of hydrogel [23]. Those results indicated, the cellulose hydrogel that prepared at 70oC has the lower of degree of crosslinking than cellulose hydrogel that prepared at 80oC.Other than degree of crosslinking, the swelling ratio of hydrogel is influenced by some factors, such as (1) interaction of polymer-solvent, (2) elasticity interaction, (3) osmotic pressure, and (4) electrostatic repulsion [24].
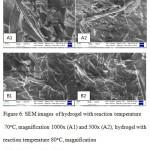 |
Figure 6: SEM images of hydrogel with reaction temperature 70oC, magnification 1000x (A1) and 500x (A2), hydrogel with reaction temperature 80oC, magnification 1000x (A1) and 500x (A2). |
The cellulose hydrogel is characterized by SEM to provide the surface morphology of hydrogel (Fig. 6). The SEM microphotograph of cellulose hydrogel C70 and C80 showed on the surface of hydrogel there some part of α-cellulose fiber. It indicated the α-cellulose content only reacted partially with the poly sodium acrylate and NMBA as crosslinked agent. On the hydrogel surface no pores observed, this result is close to the α-cellulose’s morphology reported in the literature[22], generally the pores on the surface of superabsorbent polymer are random close to semi open cells. Because of the pores system of cellulose hydrogel is random close cells the urea absorbency occurred by diffusion process than capillarity [25].
To identify the cellulose hydrogel has been synthesized, the FT-IR spectra analysis gave the data of functional group of hydrogels (Fig. 7 and Table 4).
Table 4: FTIR data of hydrogel
| Wave number (cm-1) | Functional group | ||
| α-selulosa | HSA 70 | HSA 80 | |
| 3411 | 3444.87 | 3446.79 | O-H |
| 2900-894- | 2924.092854.65854.47- | 2926.012856.58– | C-H |
| — | 1720.501629.85 | 1722.431629.85 | C=O |
| 1373—609 | 1390.68–1043.49584.43 | 1398.39-1168.861047.35582.50 | C-O / C-N |
Fig. 7 showed, there are peak at 3446 and 3600, that indicate the presence of hydroxyl (O-H) and amino (N-H) group from cellulose and NMBA, respectively. The other peak that can prove the synthesis has been occurred are the presence of peak at 1722-1629 and 1398-1016. Those peaks indicated the presence of carbonyl group (C=O) and C-O or C-N, respectively [26]. The presence of C=O group in the hydrogel spectra indicated the synthesized has been occurred before the synthesis process, this peak in-appearance in the cellulose FT-IR data.
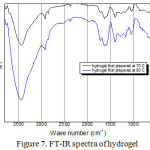 |
Figure 7: FT-IR spectra of hydrogel |
In this research, hydrogel that will be chosen for further application is the hydrogel that provide the slow rate in the releasing urea to the water. In analogy, the releasing of urea to the soil when it applied will provide controllable of hydrogel in the release of urea also it will provide the stable rate of the release urea. To measure controlled-release of urea of hydrogel, the dried one is immersed in water and the water was measured by UV-Vis technique in range of 15-150 minutes at 420 nm. The reaction that occurred in the UV-Vis measurement was shown in Fig. 8.
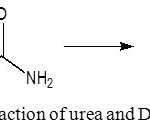 |
Figure 8: Reaction of urea and DMAB |
Fig. 9 showed the calibration curve of urea standard that provided regression formula, y = 0.0019x – 0.0027 with R2 = 0.9953. In Fig. 10 provided data of the absorbance curve of controlled-release of urea in 15-150 minutes. The conversion of absorbance value will provide other data, that is N% content value by substituting the absorbance value to the regression formula. After substituting those value, the N% content of each treatment was displayed in Fig. 11.
The hydrogel that prepared at 70oC of temperature has the slowest controlled-release of urea, which showed the first released of urea held in minutes of 90 with N% content of 0.3684 ppm and at minutes of 180 this hydrogel also gave the low value of N% content of 4.05263 ppm. In other side, the hydrogel that prepared at 80oC the first released of urea held in minutes of 30 with N% content of 1.4210 ppm and at minutes of 180 this hydrogel also gave the low value of N% content of 8.2631 ppm.
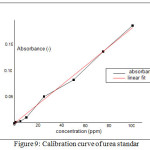 |
Figure 9: Calibration curve of urea standar |
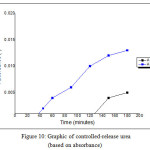 |
Figure 10: Graphic of controlled-release urea (based on absorbance) |
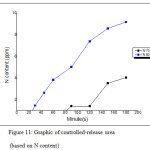 |
Figure 11: Graphic of controlled-release urea (based on N content)
|
The objective of this research is to obtain the model of hydrogel with two properties, where it was related to each other. Both are high absorbency capacity and slow in the release of urea. Therefore,the suited model of hydrogel that has both properties is the hydrogel which prepared at 70oC of reaction temperature. It is altogether reasonable to conclude that the hydrogel which prepared at 70oC is the suited model of hydrogel for applied in slow-release of urea, because of this hydrogel has the slowest number in the release of urea. Besides that, this hydrogel has the highest absorbency capacity, its means it can load much number of urea. The highest absorbency capacity is linear to the ability of hydrogel to expand itself in the urea solution, that calculated as swelling capacity. The highest the swelling ration and absorbency capacity, the lowest the number of crosslinking unit in the hydrogel that prepared in 70oC of reaction temperature.
Conclusion
The α-cellulose-g-poly(acrylic acid) superabsorbentcomposite was synthesized by graft copolymerization reaction ofα-cellulosericestraw and AA in aqueous solution. The highest water absorbency and the slowest profile of release controlled were obtained when the temperature of polymerization reaction was70oC.
Acknowledgements
The authors gratefully acknowledge to the Ministry of Research, Technology and Higher Education of Indonesia for the financial support through BPPDN scholarship.
Reference
- Buchholz, F.L. In Absorbent Polymer Technology; Brannon-Peppas, L.; Harland, R.S. Eds.; Elsevier Science Publishing Company Inc.: New York, N Y, 1990, 23-44
CrossRef - Gross, J.R. In Absorbent Polymer Technology; Brannon-Peppas, L.; Harland, R.S.Eds.;. Elsevier Science Publishing Company Inc.: New York, N Y, 1990, 3-22.
CrossRef - Kazanskii, K.S.; Dubrovskii, S.A. Advances in Polym. Sci.1992, 104, 97
CrossRef - Tomaszewska M, Jarosiewicz A. Journal of agricultural and food chemistry. 2002, 50(16), 4634-9.
CrossRef - Liang, R., Yuan, H., Xi, G. and Zhou, Q. Carbohydrate Polymers. 2009, 77(2),181-187.
CrossRef - Omidian H. And Park K., 2010, “Engeneered high swelling hydrogel”, Biomedical Application of Hydrogels handbook, Ed., Ottenbrite R.M., N.Y: Springer Science.
- Chen Y., Liu, Y.F., Tan, H.M., BioResources. 2008, 3(1), 247-245.
- Princi, E., Vicini, S., Proietti, N., Capitani, D. European Polymer Journal. 2005,41, 1196-1203.
CrossRef - Khan, GMA., Shaheruzzaman, Md., Rahman, MH., Razzaque, SM. Fiber and Polymers, 2009, 10, 65-70.
CrossRef - Farag, S., &Al-Afaleq, E. I. Carbohydrate Polymers. 2002, 48, 1–5.
CrossRef - Shogren, R. L., Willett, J. L., & Biswas, A. Carbohydrate Polymers. 2009,75(1),189–191.
CrossRef - Zhang, J. P., Wang, Q., & Wang, A. Q. Carbohydrate Polymers. 2007,68, 367–374.
CrossRef - Sun RC. Tomkinson J. Ma PL. Liang SF. Carbohydrate Polymers. 2000,42, 111-122.
CrossRef - Zohuriaan-Mehr, J.Z. and Kourosh, K. Iranian Polymer Journal.2008,17 (6), 451-477.
- Huttermann, A.,Lawrence J.B.O., Hillary A. CLEAN – Soil, Air, Water. 2009, 37(7), 517-526.
CrossRef - Puoci, F., Francesca, I., Umile, G.S., Giuseppe, C., Manuela, C., Nevio, P. American Journal of Agricultural and Biological Sciences. 2008,3(1), 299-314.
CrossRef - Chatzoudis, GK. And Valkanas, GN.Communications in Soil Science and Plant Analysis. 1995, 26(17-18), 3099-3111.
CrossRef - Ohwoavworhua, F.O and Adelakun, T.A.Tropical Journal of Pharmaceutical Research.2005,.4(2), 509-516.
- Zhong, K., Lin, Z. T., Zheng, X. L., Jiang, G. B., Fang, Y. S., Mao, X. Y., & Liao, Z. W. Carbohydrate polymers. 2013,92(2), 1367-1376.
CrossRef - Watt, G.U. and J.D. Crisp. Anal. Chem. 1954,26, 452-453.
CrossRef - Shi, J., Shi, S.Q., Barnes, H.M. and Pittman Jr, C.U. BioResources.2011, 6(1), 879-890.
- Omidian, H., Zohuriaan-Mehr, M. J., Kabiri, K., & Shah, K. Journal of Polymer Materials.2004,21(3), 281-291.
- Elliot, M. Superabsorbent Polymers. Product Development Scientist for SAP BASF. Available online at http://chimianet.zefat.ac.il/download/super-absorbant_polymers.pdf
- Kabiri, K. and Zohuriaan‐Mehr, M.J. Macromolecular Materials and Engineering. 2004, 289(7),653-661.
CrossRef - Omidian, Hossein, David Mastropietro, and UmadeviKandalam. Journal of Bioactive and Compatible Polymers. 2014, 29(1), 66-80.
- Sadeghi, M., Nasab, E.M., Shafiei, F., Javad, M., Mansouri, L. and Shasavari, H. Bio J. 2014,4(4), 27-31.

This work is licensed under a Creative Commons Attribution 4.0 International License.
![]()
A New Edition of Web of Science
Journal Impact Factor
2022: 0.5
Five Year: 0.8
Journal is Indexed in

Cabells Whitelist
![]()


