Synthesis and Spectral Properties Studies of Novel Hetrocyclic Mono Azo Dye Derived from Thiazole and Pyridine With Some Transition Complexes
Department of chemistry, college of Education,University of Al-Qadisiyah, Dewanyia, Iraq.
Corresponding Author E-mail: khalidke 1962@yahoo.com
DOI : http://dx.doi.org/10.13005/ojc/330426
Download this article as:
![]()
A novel hetrocyclic mono azo dye ligand 5-[2-(5-nitro thiazolyl)azo]-2-amino-4-methyl pyridine (NTAPy) was prepared by coupling reaction between 5-nitro thiazole diazonium chloride with 2-amino-4-methyl pyridine in alkaline alcoholic solution . Anew series of some transition metal complexes of Cr(III) , Mn(II) , Fe(III) , Co(II) , Ni(II) , Cu(II) and Zn(II) ions were prepared forming seven chelate complexes . The prepared hetrocyclic mono azo dye ligand and its metal complexes were checked by different spectral technique such as 1H-NMR , 13C-NMR ,FT-IR , electronic spectra , mass spectrum , C.H.N analysis , magnetic susceptibility , atomic absorption and molar conductivity.The analytical data show that the metal to ligand ratio [M:L] in all complexes are[1:2] and the mono azo ligand behavior as a bidentate chelating agent. The coordination number of all metal ions is found to be six in coordination through the nitrogen atom of azo group (N3) farthest of thiazole ring and nitrogen atom (N3) of thiazole molecule forming five member metlo –ring. All metal complexes of non- electrolytic and no conductive species exist excepted the Cr(III)and Fe(III)complexes are 1:1 electrolyte.
KEYWORDS:azo dyes; coupling reaction; chelate complexes
Introduction
Azo dyes of thiazole and pyridine compounds are very important class of chemical constituents having enormous applications in multiple fields such as polymer ,paper , paint and coating industries as a dyeing pigments [1-4] . Thiazolyl azo and pyridyl azo compounds are important in intermediates for the preparation of some applications such as biological activity [5,6] , clinical fields [7,8] , analytical reagents [9,10] and some drugs including discouraging the growth of germs[11,12] . Most hetrocyclic azo dyes such as pyridyl azo and thiazolylazo compounds of technical interest for application to textiles are derived from mono and diazo components consisting of five – membered metallo ring consisting of one sulphur or nitrogen hetero atom and to which a diazotisable amino group is directly attached ,the ring may also possess one or two nitrogen hetro atoms such as pyridyl azo ,imidazolylazo and benzimidazolyl azo [13-15] , or one nitrogen and one sulpher hetro atoms such as thiazolylazo and benzothiazolylazo and be fused to another aromatic ring[16,17] . The thiazolylazo and pyridyl azo reagents have an important role in spectral determination field to determine metal ions because of high sensitivity and selectivity [18,19] . Thus azo dyes compounds from this intermediate have achieved significant commercial success for the dyeing of cellulose acetate fibers in which gas fastness is a higher priority than light fastness . In the present study, the synthesis of mono azo dye ligand (NTAPy) which contains two hetrocyclic ring thiazole and pyridine and its metal complexes with Cr(III) , Mn(II) , Fe(III) , Co(II) , Ni(II) , Cu(II), and Zn(II) ions are reported. Moreover spectral and analytical identification studies have been investigated for comparative purposes.
Materials and Methods
2-Amino-4-methyl pyridine , 2-amino-5-nitro thiazole and other chemicals were equipped from Aldrich , BDH and sigma chemical companies and used without further purification .All chemicals and solvents used in the preparation and characterization were of analytical grade. 1H-NMR and 13C-NMR spectra were obtained with a model Bruker AM(400MHz)spectrometer for using DMSO-d6 solution in an appropriate deuterated solvent .The chemical shift are reported in ppm using tetra methyl silane(TMS)as the internal reference.Mass spectrum of azo ligand (NTAPy)were recovrded on a shimadzu Agilent Technologies 5975oC at 70ev and MSD energy using a direct insertion probe (Acqmethod low energy) at 90-110oC temperature .Elemental analysis (C.H.N.S) was carried out using a C.H.N EA-99 mth instrument. The metal contents of metal complexes were measured by using atomic absorption technique by shimadzu AA-6300. IR spectro were recorded as KBr discs in range (4000-400)cm-1 on a shimadzu 8400FT-IR spectrophotometer .The electronic spectra were measured in 1cm quartz cells on a spectraphotometer a UV-Visb. T80-PG by using 10-3 M solution absolute ethanol at room temperature in the rang (200-1100) nm . Magnetic susceptibility measurements of the metal complexes in powder form were carried out on Balance Magnetic (MSB-MKi) apparatus by using farady method at room temperature Diamagnetic correction for the metal complexes was calculated using pascals constant. Molar conductivity measurements were recorded at room temperature in DMF solution (10-3M) by using a 31 A digital conductivity meter . Melting points of azo dye ligand and its metal complexes are un corrected and were determined using open capillary tube method which uses Electro thermal melting point 9300 apparatus . The purity of the azo dya ligand was assessed by thin layer chromatography (TLC) using whatman 250m silicegel plates as the stationary phase and methanol as developing solvent .
Synthesis of Novel Hetrocyclic Mono azo dye Ligand (NTAPy)
The novel heterocyclic mono azo dye ligand (NTAPy) ,(Scheme 1) was synthesized by dissolved 2-amino-5-nitro thiazole(1.45gm,0.01mol) in 50 ml distilled water and 4 ml hydrochloric acid . The solution was diazotized with (0.75 gm, 0.01 mol in 25 ml distilled water) sodium nitrate (NaNO2)was cooled and added drop – wise to solution of 2-amino-5-nitro thiazole .The resulting reaction mixture was stirred of 20 minutes ,formed a clear yellow solution .In the resulting diazonium chloride solution,drop-wise, with cooled condition and stirring continuously at(0-5)oC,was added to solution of 2-amino-4-methyl pyridine (1.08 gm,0.01 mol) dissolved in 100 ml ethanol .The color of the reaction mass was changed from yellow to brown red color.The reaction mixture was stirred for another 2 hours at (0-5)oC in ice-bath. After completion of reaction ,the reaction mixture was added to the ice cold water (200ml) with stirring .The crude product was separated by filtration , washed with distilled water and dried .The solids obtained recrystallized with ethanol to get brown crystals colored .The purity of the azo dye ligand (NTAPy) was determined by thin layer chromatography (TLC). The yield of the reaction was 76% and m.p =122oC . The molecular structure of the azo dye ligand and was characterized by 1H-NMR , 13C-NMR ,mass spectrum ,UV-Vis , FT-IR and C.H.N.S elemental analysis.
![Scheme 1: Synthesis of mono azo dye ligand 5-[2-(5-Nitro thiazolyl)azo]-2-amino-4-methyl pyridine(NTAPy)](https://www.orientjchem.org/wp-content/uploads/2017/07/Vol33No4_Syn_Kha_sch1-150x150.jpg) |
Scheme 1: Synthesis of mono azo dye ligand 5-[2-(5-Nitro thiazolyl)azo]-2-amino-4-methyl pyridine(NTAPy) |
Synthesis of Metal Complexes
The metal complexes of mono azo dye ligand (NTAPy)were synthesized by adding 0.528gm(0.002 mol)of ligand dissolved in 50 ml hot ethanol in the form of drop-wise with stirring stoichiometric amount of 1:2 ,[M:L] mole ratio (0.001mol) for Cr(III), Mn(II) , Fe(III) , Co(II) , Ni(II) , Cu(II) and Zn(II) Chloride salts which dissolved in 30 ml hot buffer solution (ammonium acetate) at pH=6.5-7.5 for each metal ions .The reaction mixture was heated and stirred for another 40 minutes at (60-70) oC until the precipitated product ,than left over night , The crude precipitate was filitered off and washed several time with distilled water , then washed by 10 ml absolute ethanol to remove any trace of unreacted organic material to get crystals product purple ,orange, green and red solids , dried and preserved in desiccators over anhydrous CaCl2 . The yields, melting points, color and analytical data are collected in table(1).
Table 1: physical and analytical data of novel azo dye of ligand (NTAPy) and its metal complexes
|
Compound |
PH |
color |
m.p oC |
Yield% |
Molecular formula |
Found (calc.)% |
||||
|
(Mol.wt) |
C |
H |
N |
S |
M |
|||||
|
Ligand=NTAPy |
6 |
Brown |
122 |
76 |
C9H8N6O2S |
-40.9 |
-3.05 |
-31.8 |
-12.13 |
– |
|
-264.26 |
40.68 |
2.97 |
31.35 |
12.34 |
||||||
|
[Cr(L)2Cl2]Cl.H2O |
7.5 |
Purple |
183 |
74 |
C18H18N12O5S2Cl3Cr |
-29.9 |
-2.5 |
-23.25 |
-8.87 |
-7.19 |
|
-722.897 |
30.09 |
2.39 |
23.6 |
9.11 |
7.48 |
|||||
|
[Mn(L)2Cl2].H2O |
7 |
Dark purple |
168 |
63 |
C18H18N12O5S2Cl2Mn |
-32.16 |
-2.69 |
-24.99 |
-9.536 |
-8.17 |
|
-672.499 |
31.75 |
2.75 |
25.42 |
9.84 |
8.39 |
|||||
|
[Fe(L)2Cl2]Cl.H2O |
6.5 |
Reddish orange |
194 |
58 |
C18H18N12O5S2Cl3Fe |
-30.51 |
-2.55 |
-23.71 |
-9.04 |
-7.87 |
|
-708.8596 |
30.74 |
2.46 |
23.95 |
8.83 |
8.21 |
|||||
|
[Co(L)2Cl2].H2O |
7.5 |
Dark green |
203 |
72 |
C18H18N12O5S2Cl2Co |
-31.19 |
-2.68 |
-24.84 |
-9.48 |
-8.71 |
|
-676.451 |
31.51 |
2.56 |
25.01 |
9.75 |
8.85 |
|||||
|
[Ni(L)2Cl2].H2O |
7 |
Purple |
206 |
77 |
C18H18N12O5S2Cl2Ni |
-31.98 |
-2.68 |
-24.84 |
-9.49 |
-8.67 |
|
-676.311 |
32.44 |
2.75 |
24.99 |
9.67 |
8.78 |
|||||
|
[Cu(L)2Cl2].H2O |
6.5 |
Green |
172 |
81 |
C18H18N12O5S2Cl2Cu |
-31.75 |
-2.66 |
-24.46 |
-9.41 |
-9.32 |
|
-681.104 |
31.93 |
2.74 |
24.79 |
9.7 |
9.75 |
|||||
|
[Zn(L)2Cl2].H2O |
7 |
pink |
188 |
69 |
C18H18N12O5S2Cl2Zn |
-31.67 |
-2.65 |
-24.61 |
-9.38 |
-9.58 |
|
-682.967 |
31.91 |
2.71 |
24.77 |
9.65 |
9.79 |
|||||
NTAPy=L
Result and Discussion
Mass Spectrum of the Novel Azo dye Ligand (NTAPy)
The mass spectrum fragmentation of novel azo dye ligand (NTAPy) shown in schem-2 and figure 1 . The base peak of azo dye ligand at m/Z+ =264.0 is a ttributed to the original molecular weight of ligand [C9H8N6O2S] , 264.29 . The peak at m/Z+= 234.0 is due to loss of methyl and amine groups [C8H4N5O2S]+ ion , while a peak at m/Z+=188.0 is attributed to the loss of nitro group(NO2) to give groups [C8H4N4S]+. The loss of azo group give a peak at m/Z+=160.0 [C8H4N2S]+. The peak at m/Z+=84.0 is analogous to the loss of [C5H4N]+ (pyridine ring) and gives thiazole molecule[C3H2NS]+ , [20,21].
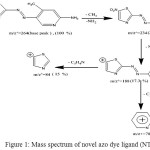 |
Figure 1: Mass spectrum of novel azo dye ligand (NTAPy) |
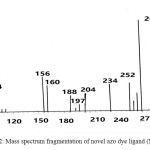 |
Scheme 2: Mass spectrum fragmentation of novel azo dye ligand (NTAPy) |
1H-NMR Spectrum of Novel Azo dye Ligand (NTAPy)
The 1H-NMR spectrum of novel azo dye ligand (NTAPy), figure 2 ,was measured using in CDCl3 solvent with TMS as an internal reference .The 1H-NMR spectrum data of the azo dye ligand showed δ =1.3 ppm ( S,3H,CH3 ) , δ =6.8 ppm (S,2H,NH2) and δ =7.1-8.1 ppm (m,3H,Ar-H) [20,22,23].
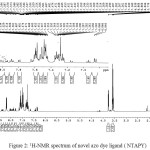 |
Figure 2: 1H-NMR spectrum of novel azo dye ligand ( NTAPY) |
13C-NMR Spectrum of Novel Azo dye Ligand (NTAPy)
The 13C-NMR spectrum of novel azo ligand (NTAPy) , figure 3, was measured by using DMSO as solvent .The 13C-NMR spectrum of azo dye ligand show δ=149.3 ppm (C2), δ =124 ppm (C5), δ=145 ppm (C4), δ=24.4 ppm (C7) , δ=128 ppm (C4–), δ=125 ppm (C5–),δ=131 ppm (C6–),δ=144 ppm (C2–)and δ=114ppm (C3–) [24,25].
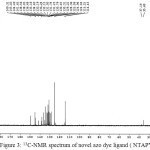 |
Figure 3: 13C-NMR spectrum of novel azo dye ligand ( NTAPY) |
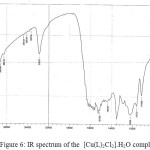
Infrared Spectral Studies
The IR spectral data of the prepared azo dye ligand (NTAPy) and their Cr(III) ,Mn(II) ,Fe(III) ,Co(II), Ni(II) , Cu(II) and Zn(II) complexes (KBr disc) are presented in Table 2. The IR spectrum of the free azo dye ligand exhibited a band at 3402 cm-1 which is assigned to Ʋ(-NH2) group in the ligand (NTAPy) . This band does not change in position in all metal complexes because of non coordination with metal ion [26] . The IR spectrum of azo dye ligand shows characteristic bands at 3263 cm-1 and 3101 cm-1 was attributed to Ʋ(-CH3) and Ʋ(-CH) pyridine ring respectively [27] . This band did not show any frequency shift in IR spectra of all metal complexes [20,27,28] .The spectra of all metal complexes show a broad band around at(3440-3496) cm-1 indicated the presence of water molecule Ʋ(H2O) in these complexes[14,15]. The strong band observed at 1628 cm-1 in the free azo dye ligand was attributed to Ʋ(-C=N) stretching of the thizole ring [30] . This band shifted to a lower wave number side (1605- 1620) cm-1 in all metal complexes suggesting the participation of the Ʋ(-C=N-) of thiazole ring in bonding with metal ions [15,31] . A strong to medium in tensity band at 1512 cm-1 in free ligand and (1512-1519) cm-1 in all metal complexes which is assigned to Ʋ(-NO2) group [16] . A medium intensity band at 1473 cm-1 in the free ligand was attributed to Ʋ(-N=N) stretch of the azo group [32,33] .The band shifts to lower wave number side (1458-1434) cm-1 in all metal complexes indicating the coordination with metal ions[34] . Another bands appeared at 1257 cm-1 in free ligand spectrum . attributed to Ʋ(-C-S) of the thiazole ring [15,20,27,35] .The existence of this band in all metal complexes means that the suphur atom of thiazole ring does not participate in coordination [36] . New absorption the range of (512-493) cm-1 which are not present in the spectrum of the free ligand are due to Ʋ(M-N) band vibrate ion [37] .IR spectra data lead to suggest that the ligand behaves as a bidentate chelating agent coordination through the nitrogen atom of thiazole ring nitrogen of azo group nearest to pyridine ring to give five membred metalo ring .Some representative spectra are given in figures 4,5 and 6.
Table 2: Selected IR data (KBr disc, Ʋ cm-1) for novel azo dye ligand (NTAPy) and their metal complexes
|
Compound |
Ʋ(NH2) |
Ʋ(CH3) |
Ʋ(C=N) |
Ʋ(NO2) |
Ʋ(N=N) |
Ʋ(C=C) |
Ʋ(C-S) |
Ʋ(M-N) |
|
Ligand=(NTAPy) |
3402 |
3263 |
1628 |
1512 |
1473 |
1335 |
1257 |
|
|
S. |
m. |
s. |
m.br |
m. |
w. |
m. |
– |
|
|
1365 |
||||||||
|
S. |
||||||||
|
[Cr(L)2Cl2]Cl.H2O |
3438* |
3271 |
1620 |
1518 |
1458 |
1157 |
1248 |
509 |
|
s.br. |
w. |
m. |
w. |
w. |
w. |
w. |
w. |
|
|
1342 |
||||||||
|
[Mn(L)2Cl2].H2O |
3425* |
3217 |
1620 |
1512 |
1434 |
1303 |
1227 |
486 |
|
w. |
w. |
m.sh |
m.sh |
w. |
w. |
s. |
||
|
1345 |
||||||||
|
[Fe(L)2Cl2]Cl.H2O |
3406* |
3214 |
1620 |
1519 |
1434 |
1203 |
1275 |
508 |
|
w. |
w. |
w. |
m.sh |
m. |
m. |
s. |
w. |
|
|
1335 |
||||||||
|
[Co(L)2Cl2].H2O |
3440* |
3224 |
1620 |
1516 |
1448 |
1203 |
1268 |
493 |
|
s.br. |
w. |
m.sh |
M |
m. |
m. |
m. |
||
|
1334 |
||||||||
|
w. |
||||||||
|
[Ni(L)2Cl2].H2O |
3428* |
3215 |
1604 |
1527 |
1443 |
1296 |
1228 |
502 |
|
m.br. |
w. |
m. |
w. |
m. |
w. |
w. |
w. |
|
|
1357 |
||||||||
|
w. |
||||||||
|
[Cu(L)2Cl2].H2O |
3340* |
3225 |
1618 |
1512 |
1434 |
1287 |
1218 |
485 |
|
m.(NH2) |
w. |
m. |
w. |
w. |
w.br. |
m.br |
w. |
|
|
3441 |
1368 |
|||||||
|
m.br.(H2O) |
m. |
|||||||
|
[Zn(L)2Cl2].H2O |
3741 |
3226 |
1605 |
1520 |
1442 |
1296 |
1203 |
509 |
|
w.br |
w. |
m.sh |
m.br. |
w. |
w. |
m.sh |
w. |
|
|
(H2O) |
1358 |
|||||||
|
3332 |
m.br. |
|||||||
|
m.br |
||||||||
|
(NH2) |
*This band attributed to Ʋ(NH2) and Ʋ(H2O) molecule because of interference between this bands in this reagan ; w=weak , m=medium , s=strong , sh=sholder , b=broad.
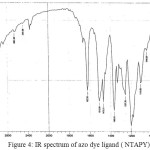 |
Figure 4: IR spectrum of azo dye ligand (NTAPY) |
![Figure 5: IR spectrum of the [Cr(L)2Cl2]Cl.H2O complex](https://www.orientjchem.org/wp-content/uploads/2017/08/Vol33No4_Syn_Kha_fig5-150x150.jpg) |
Figure 5: IR spectrum of the [Cr(L)2Cl2]Cl.H2O complex |
![Figure 6: IR spectrum of the [Cu(L)2Cl2].H2O complex](https://www.orientjchem.org/wp-content/uploads/2017/08/Vol33No4_Syn_Kha_fig6-150x150.jpg) |
Figure 6: IR spectrum of the [Cu(L)2Cl2].H2O complex |
Electronic Spectral Studies
The electronic absorption spectra of the novel azo dye ligand (NTAPy) and its prepared metal complexes with some metal ions such as of Cr(III) , Mn(II) , Fe(III) , Co(II) , Ni(II) ,Cu(II) and Zn(II) ions were recorded in freshly absolute ethanol(10-3M)at room temperature .The spectral data are summarized in table (3) and show the spectra in figures 7,8,9 and 10.
The electronic spectrum of the free ligand (NTAPY) exhibited two absorption bands at 384 nm (26042cm-1) and 239nm (41841cm-1) assignable to π→* π and n→* π transition respectively due to the azo group (-N=N-) and (C=C) groups of thiazole and pyridine rings [20,38]. The absorption band of azo group showed a red shift because of coordination between ligand and metal ion [15,39].The electronic spectrium of the Cr(III) complex displayed three bands at 532nm (18797cm-1), 412nm(24272cm-1)and 349nm(28653cm-1) which may be d-d transitions of Cr(lll)ion, these bands are assignable to 4A2g →4T2g(F), 4A2g→4T1g(F) and 4A2g →4T1g(p) transitions respectively [27]. The electronic absorption spectrum of Mn(II)-complex(d5) exhibited one term apree ion (6s) in addition to several times dubline and quarter there for any transition between the crystal field cases will be prohibited multplicity ,and as a result the spectra of ions(d5) are very weak and the colors are faint [40]. The Mn(II)- complex where showed two absorption bands at 907nm (11025cm-1) and 537nm (18622cm-1) which may be attributed to 6A1g→4T2g and 6A1g→4Eg,4AIg(G) transitions respectively [41] . The absorption band at 238 nm(42017 cm-1) is attributed to center ligand transition. The electronic spectrum of Fe(III)-complex showed three absorption band at 963nm (10384cm-1) , 468nm(21367cm-1) and 317nm(31546cm-1) attributed to 2A2g→4T1g(G) , 2A2g→4Eg, 4A1g(G) and 2A2g→4T1g(p) transitions respectively [27] . The Co(II)-complex exhibited three absorption band at 637nm(15698cm-1) ,500nm (20000cm-1) and 402nm (24876cm-1) assignable to 4T1g(F) →4T2g(F) , 4T1g→4A2g and 4T1g(F) →4T1g(p) transition respectively [40,43] ,while the absorption bands at 296nm (33784cm-1) and 251(39841cm-1) attributed to center ligand transitions. The electronic spectrum of the Ni(II)-complex exhibited three absorption bands at 968 nm(10330cm-1) ,535nm (18691cm-1) and 340nm(29412cm-1) assignable to3A2g(F)→3T2g(F)f , 3A2g(F)→3T1g(F) and 3A2g→3T1g(p) transition respectively while the absorption band at 252nm(39682cm-1) attributed to center ligand transition [32,43] . The green colored of Cu-complex exhibited a single broad asymmetric band around at 618 nm (1618cm-1) ,the broodiness of this band indicates the three transition 2B1g→2A2g(Ʋ1) , 2B1g→2B2g(Ʋ2) and 2B1g→3Eg(Ʋ3) ,which are of similar energy and give rise to only one broad absorption band due to 2B2g→2A2g transition . The broadness of the band may be attributed to dynamic Jahn- Teller distortion [20,23].The electronic spectrum of the Zn(II)- complex did not show any d-d transition because it is saturated with electron (d10) .The absorption band at longer wavelength 416nm (24038cm-1) is due to a charge transfer (M→L,CT) transition.This transition where d π(Zn+2)→ *π(L)is belived to be primarily dominated by the LUMO of the azoimine chromophory [44,45].
Magnetic Moments Studies
The magnetic moments obtained at room temperature for Cr(III),Mn(II),Fe(III), Co(II),Ni(II), Cu(II) and Zn(II) complexes are listed in table 3 . The Cr(III)- Complex exhibited the magnetic moment value of 3.78 B.M, this value is too close to the theoretical of magnetic moment for the Cr(III)ion (3t2g eg0), (Meff=3.87B.M) which indicates an octahedral geometry and d2sp3 hybridization[27].The magnetic moment value of Mn(II)-complex has been found 5.63 B.M. The larger variation in the magnetice moment for a high spin has a d5, (t2g3 eg2) configuration depends on the magnituede of the orbital contribution . The high value of magnetic moment is because of five electrons unpaired which may suggest a regular octahedral geometry and sp3d2 hybridization [27,46] .The Fe(III)-complex showed the magnetic moment value of 1.84 B.M due presence of one electron unpaired for alow spin has a d5(t2g5 eg0) configuration which indicates a distorted octahedral geometry (Z-out) and d2sp3 hybridization [47] . The Co(II)-complex exhibited three absorption bands at 637nm (15698 cm-1), 500nm (20000 cm-1) and 402nm(24876 cm-1) assignable to 4T1g(F) →4T2g(F) , 4T1g→4A2g and 4T1g(F) →4T2g(p) transitions respectively [40,42],while the absorption bands at 296nm (33784 cm-1) and 251 nm (39841 cm-1) is attributed to center ligand transition . The Ni(II)-complex showed the magnetic moment value of 3.04 B.M with the range of 2.8-3.5B.M for high spin (t2g6 eg2) configuration suggesting a regular octahedral geometry and sp3d2 hybridization [50,51]. The Cu(II)-complex has a d(t2g6 eg3) configuration show magnetic moment of 1.83 B.M is slightly higher than the spin –only value of 1.73B.M which offers possibility of an octahedral geometry because of the presence of one electron unpaired and sp3d2 hybridization [52] .The magnetic moment value of Zn(II)-complex is diamagnetic consistent d10,(t2g6 eg4) configuration which indicates an octahedral geometry with sp3d2 hybridization [53].
Table 3: Electronic absorption spectra (nm,cm-1),magnetic moments ,geometry and hydridization
|
Compound |
λmax nm |
Absorption bands(cm-1) |
Trensitons |
Meff |
Geometry |
Hybridization |
|
(B.M) |
||||||
|
Ligand=(NTAPy) |
384 |
26042 |
n→π* |
– |
– |
– |
|
(L) |
239 |
41841 |
π →π* |
|||
|
[Cr(L)2Cl2]Cl.H2O |
532 |
18797 |
4A2g→4T2g(F) (Ʋ1) |
3.78 |
Octahedral |
d2sp3 |
|
412 |
24272 |
4A2g→4T1g(F)( Ʋ2) |
(Regular) |
|||
|
349 |
28653 |
4A2g→4T1g(p)(Ʋ3) |
||||
|
[Mn(L)2Cl2].H2O |
907 |
11025 |
6A1g→4T2g(F) (Ʋ1) |
Octahedral |
Sp3d2 |
|
|
537 |
18622 |
6A1g→4Eg,4A1g(G)(Ʋ2) |
5.63 |
(Regular) |
(High spin) |
|
|
[Fe(L)2Cl2]Cl.H2O |
963 |
10384 |
2A2g→4T1g(G) (Ʋ1) |
Octahedral |
d2sp3 |
|
|
468 |
21367 |
2A2g→4Eg,4A1g(G) (Ʋ2) |
1.84 |
distorted |
(low spin) |
|
|
317 |
31546 |
2A2g→4T1g(p) (Ʋ3) |
(Z-out) |
|||
|
[Co(L)2Cl2].H2O |
637 |
15698 |
4T1g→4T2g(F) (Ʋ1) |
Octahedral |
Sp3d2 |
|
|
500 |
20000 |
4T1g→4A2g(F) (Ʋ2) |
4.23 |
(regular) |
(High spin) |
|
|
402 |
24876 |
4T1g→4T1g(P) (Ʋ3) |
z-out or z in |
|||
|
[Ni(L)2Cl2].H2O |
968 |
10330 |
2A2g→2T2g(F) (Ʋ1) |
3.04 |
Octahedral |
Sp3d2 |
|
535 |
18691 |
2A2g→2T1g(F) (Ʋ2) |
(Regular) |
(High spin) |
||
|
340 |
29412 |
2A2g→2T1g(P) (Ʋ3) |
||||
|
[Cu(L)2Cl2].H2O |
618 |
16181 |
2B2g→2A2g |
1.83 |
Octahedral |
Sp3d2 |
|
distorted (Z in-z out) |
||||||
|
[Zn(L)2Cl2].H2O |
416 |
24088 |
dπ(Zn)+2→π*(L) |
Dia |
Octahedral |
Sp3d2 |
|
(Regular) |
 |
(Figure 7: UV-Visible spectrum of azo dye ligand (NTAPy
|
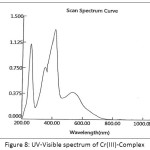 |
Figure 8: UV-Visible spectrum of Cr(III)-Complex |
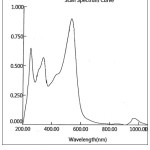 |
Figure 9: UV-Visible spectrum of Ni(II)-Complex |
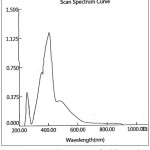 |
Figure 10: UV-Visible spectrum of Zn(II)-Complex |
Molar Conductivity Studies
The molar conductance( Ʌm) studies of the metal complexes were measured in DMF solvent in 10-3M concentration at room temperature.The high values of molar conductivity of the Cr(III)- complex and Fe (III)-complex give 73.85 S.mol-1 .cm2 and 79.37 S.mol-1.cm2 respectively which indicates that the complexes are 1:1 electrolyte with ionic nature because of the presence of the chloride ion (Cl–)which is located outside the coordination sphere [20,27], but showed the values of molar conductivity of the Mn(II) , Co(II) , Ni(II) , Cu(II) and Zn(II) complexes ranged between (16.08-24.17)S.mol-1 .cm2 ,this indicates that non –electrolyte and no conductive species exist because of the chloride ions (2Cl–)which are located in side the coordination sphere [14,32,42,54]. The values of molar conductivity of this metal complexes are listed in table 4.
Metal: Ligand Ratio
The metal : ligand ratio [M:L]of metal complexes were determined by molar ratio method at fixed concentration at wavelength maximum absorption (λmax). The solution of prepared metal complexes increase the intensity of the colors as approach point of intersection ratio and color continus constant at passing the point which indicates that the metal complexes formed [15,20,32,39]. The azo dye ligand (NTAPY)which was found to form 1:2 [M:L] mole ratio with all metal ions suggested the formation of metal complexes to give two five- membered chelate rings.
Calculation of Metal Complexes Stability Constant
The stability constant(β and logβ) of metal complexes are determined spectrophotometrically by measure the absorbance of mixture of solution of azo dye ligand (NTAPY) and metal ions at fixed wavelength (λmax)and optimum concentration values . The degree of formation of metal complexes are calculated depending on the relation- ship β=1-α/4α3c2and α= Am-As/Am , where As and Am are the absorbance of the partially and fully formed complexes respectively .The calculated β and log β values for prepared metal complexes are listed in table 4 . The listed stability constant follows the arrangement Cu(II) ˃Ni(II) ˃Co(II)˃Zn(II) ˃ Mn(II) ˃Cr(III)˃Fe(III) the sequence of metal ions of the first row transition metals agree with Irving-Williams of stability constant[55,56] .
Table 4: stability constant values ( β and log β ) , molar conductivity optimal concentration , maximum wavelength (λmax) and molar absorptivity (ϵ) of metal complexes
|
Ligand |
Metal ion |
Maximum Wavelength (λmax)nm |
Optimal Molar Conc.x10-4 |
Moler Absorpitivity (ϵ)x10-3 L.mol.cm-1 |
Stability Constant β,L2.mol-2 |
Log β |
Molar conductivity S.cm2.mol-1 |
|
λ max=384nm |
Cr(III) |
532 |
1.75 |
2.25 |
3.77×10⁹ |
9.58 |
73.85 |
|
ϵ=4.09×10³ |
Mn(II) |
537 |
1.5 |
0.39 |
4.18 x10⁹ |
9.62 |
16.08 |
|
L.mol-1.cm-1 |
Fe(III) |
468 |
2 |
8.64 |
2.49 x10⁹ |
9.4 |
79.37 |
|
Conc.=1.50×10⁻⁴M |
Co(II) |
637 |
1.75 |
1.41 |
4.57 x10¹⁰ |
10.41 |
18.58 |
|
Ni(II) |
535 |
2 |
4.49 |
5.64 x10¹⁰ |
10.75 |
24.17 |
|
|
Cu(II) |
618 |
1.5 |
1.38 |
6.73 x10¹⁰ |
10.83 |
21.88 |
|
|
Zn(II) |
416 |
2.25 |
5.32 |
5.69 x10⁹ |
9.76 |
17.89 |
The Proposed Structures of Metal Complexes
Acoording to the results and discussion through different techniques , the proposed structures of the prepared metal complexes are suggested and shown in figure 11 . Depending on the analytical and spectral data, the novel azo dye ligand (NTAPy) behaves as a bidentate chelating agent coordination through the nitrogen atom (N3)of azo group nearest to pyridine ring and nitrogen atom (N3) of thiazole ring to give one-five membered chelate ring.
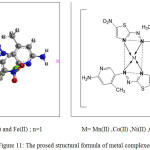 |
Figure 11: The prosed structural formula of metal complexes |
Conclusion
In this paper we report the synthesis and spectral properties studies of a bidentate azo dye ligand derived from thiazole and pyridine ring (NTAPy) and its metal complexes with Cr(III) , Mn(II) , Fe(III) , Co(II) , Ni(II) , Cu(II) and Zn(II) ions. The azo dye ligand and its metal complexes were characterized by using several physical techniques such as elemental analysis , 1H-NMR .13C-NMR ,Mass spectroscopy ,IR ,UV-Visb and molar conductivity .The geometry proposed for all metal complexes were octahedral stereo chemistry . All metal complexes are not effected by air ,light and a moisture ,suggesting high stability plus degrees of melting point that give another evidence of the stability of the prepared metal complexes.
Refernces
- savanor prasanna M.,Jathi K.,Bath K.and Tantry Rajesh N., Res. J.Chem .Sci.2012 ,3 ,38-43.
- Ahmed K.A.,Elhennawy H.M.and Elkashouti M.A., Res. J.Chem .Sci. 2012,2,14-19.
- Khalid J.Al-Adilee and Haithm K.Dakhil ,Al-Qadisiya J for science, 2011, 4,(2011),94-115.
- Hamid H.Eissa ,J.Current Res .Sci.,2013,1,96-103.
- Tumer M. and Ekinci D.,Spectro chemical Acta part (A) , Mol.Biomol.spect. ,2007,67, 916-923.
- Jian ,L.V.,J-Inorg.Bio chem.,2006 ,100,888-895.
- Taguchi T., J.Am.soc.Nephrol ,2002,13, ,2478-2485.
- Pathak P., Jolly V.S.,and Sharma K.P. ,Orient J.Chem., 2000,16 ,161-167 .
- Deblina S.,Ajoy K.P and Tapan K.M., Spectro chimica Acta part(A) ,2013, 115,421-425 .
CrossRef - Khalid J. AL- Adilee,A – Ghali and A-Hussein , J-Chem.Eng.,2012 ,6, 651-657.
- Jin Z ,Z. Li and R. Huang ,Nat.Prad. Rep., 2002,19, 454-459.
CrossRef - T.Maicr, R. Schmierer, K.Bauer ,H.Biering and B.Saches, US Patent 4820335,Chem. Abstr., 1989,89, 19494.
- Hassan A.Habeeb, Khalid J. AL- Adilee and sudd J. Jaber, J. Chem. And Mater Res.,2013,5,1141-1151.
- Khalid J. AL-Adilee and Ban A. Hatem ,J . Pdvances in Chemistry, 2015,11, 3412-3425.
- Khalid J. AL- Adilee, Khamis A.A. and Zainab M., Asian J. Chem , 2013,25, 10475 – 10481.
- Otutu J.O. , E. Osabohien and E.M.Efurhievwe , Orient . J .Chem., 2011, 27, 1389 – 1396.
- Gordon , P.F. In: waring D.R., Hallas G ., editors., (( The chemistry and application of dyes)) New York ; plnum press, 1990.
- G.Ramazn , Turk J. Chem., 2012,36, 1-7.
- N.Rajesh and M.S.Hari, Spectro chem. Acta , A , 2008 ,70, 1104-1109.
- Khalid J. AL- Adilee,Ahmed K.Abass and Ali M.Taher , J.Molecular structure ,2016,1108 ,378-397 .
- Hassan A.Habeeb ,Khaild J.Al-Adilee and sudd A.Jaber ,J.Chem,and Mater.Rese. 2014, 6 , 69-80 .
- Debline Sarkar ,Ajoy Kumar Pramanik and Tapan L.Mondal , J.Spectro chimica Acta part A:Molecular and Biomolecular spectroscopy ,2013, 115,421-425.
CrossRef - M.B.Halli ,K.Mallikarjun and sadu suryakant S., J. Chem. and pharma.Rese.,2015, 7,1797-1804.
- Savanor Prasanna M.,Jathi K,Bhat S.Kand Tantry R.N., Res. J. Chem. Sci., 2013,3 ,38-43 .
- Hawraa M.Farhan,world J.Med.and Med .Sci.Res., 2014, 2, 26-34 .
- Narenda Kummer and Parashuram Mishra ,Arch-Apple.Sci.Res. 2013, 5 , 191-197 .
- Khalid J.AL-Adilee and Dunya Yo.Fanfon,J.Chem.Chem.Eng.,2012, 6 ,1919-.
- L.Mangsup S.Siripalsarnpipat and N.Chaichit , Anal.Sci.2003, 19 ,1345-1353.
CrossRef - H.Bervera,J.Sola and J.MVinas , Trans.Met.Chem,1985,10, 233-239 .
CrossRef - V.V.Raju, K.P.Balsubrhamanian ,C.Balkrishanan and V.Chinnusamy, Inter.J.applied biology,2012, 2,76-87 .
- M.S.Nair,M.A.Neelakantan and S.S.Sunu , Theor.Anal,Chem., 1999, 38, ,1307-1316.
- Khalid J.AL-Adilee ,J.Res.of pharm.Biological and Chem.Sci., 2015, 5 ,1297-1308 .
- Krishnankutty K.P.Syudeci and M.B.Ummatur,J.Serbian chem.,2007, 72 ,1075-1081.
- Yilidiz M.Kele,A.Kaya and S.Dincer ,J.Chem.Sci.Trans., 2, 547-556 .
- Khalid J.AL-Adilee , J.Chem .Chem.Eng .,2012, 6 ,1016-1028 .
- K.C.Satpfy and H.P.Mishra ,Indina J.Chem.,24A, 1981 ,612-619.
- S.M.Ben-Saber ,A.A.Maihub ,S.S.Hudere and M.M.El-Ajaily ,Microchem .j .,2005, 81 ,191-202.
CrossRef - Kalia S.B.,Lumbak K.G.and Sharma M;Ind.J.Chem. 2007, 46 ,1233-1239.
- Khalid J.AL-Adilee ,Asian J.Chem.,2012, 24 ,5597-5601 .
- Lever ,A.E.B.”Inorganic Electronic Spectroscopy” Elsevier ,NewYork.1968.
- S.Sharam, V.Chowdhary , M.Parihar, Indian J.Chem., 1989, 28 ,809-811.
- Khalid J.AL-Adilee and Haider M.Hesson ,J.Chem. andpharma.Res, 2015, 7 , 89-103.
- Joon R.Gispert, “Coordination chemistry” Wiley-VCH, New York, 2007.
- P.K Ghosh, S.Saha and A-Mahapatra , Chemistry centeral J., 2007, 1,1-8.
- S.Pal.D.Das ,P.Chattopadhyay and T.H.Lu ,Polyhydron , 2000, 19,1263-1271.
CrossRef - Chandra S.,Kumar A.,J.Indian chem. Soc ., 2007,84 ,25-338 .
- Mahapatra B .,Pujar S.K;Transition metal chem. ; 1983,8 ,202-213.
- Abbs Ali Salih Al-Hamdeni ,J-dirasat pure Sci,,2013,39,61-72.
- Parameswari ,S.Chirte ,A.Kiruthika and A.Nagajothi ,Res.Pharma-Ceutical Bio. and Chem.Sci .,2013,41 ,188-197.
- B.N.Figgis ,J.Lewis , Progress ininorganic chemistry ,cotton F.A.(Ed) ,Interscience newyork , 1984.
- Roo and K.Hussain Reddy ,Indian J.Chem., 1996,35,168-689 .
- G.VALAMARY and R.Subbala ksmi ,Indian J.APPL.Res .,2013,3 ,43-56.
- R.A.Oatto,S.Yamal “Anelements of Magnetic Chemistry” 2nd Ed.East west press ,New Delhi , 1993,101
- E.Yidiz and Boz tpe ; Truk.J.Chem., 2006,26,897-903 .
- H.Irving and R.J.PWilliams , J.Chem.Soc., 1953 .3192 .
- A.Z.El-Sonbati , Transition metal Chem., 1991,16 ,45-52.


![]()


