Sol-Gel Synthesis of Fe2o3-Doped Tio2 Photocatalyst for Optimized Photocatalytic Degradation of 2,4- Dichlorophenoxyacetic Acid
1Department of Chemistry, Faculty of Science, Universiti Putra Malaysia, 43400 UPM Serdang, Selangor, Malaysia.
2Institute of Advanced Technology, Universiti Putra Malaysia, 43400 UPM Serdang, Selangor, Malaysia.
3Department of Mathematics, Faculty of Science, Universiti Putra Malaysia, 43400 UPM Serdang, Selangor, Malaysia.
4Department of Pure and Industrial Chemistry, Faculty of Science, Bayero University Kano, 700241 Kano State, Nigeria.
Corresponding Author E-mail: halim@upm.edu.my
DOI : http://dx.doi.org/10.13005/ojc/330442
Download this article as:
![]()
Fe2O3_doped and undoped TiO2 catalysts were synthesized by sol-gel method and used to optimize the photocatalytic degradation of 2,4-Dichlorophenoxyacetic acid (2,4-D). The catalysts produced were dominated by the tetragonal, crystalline anatase TiO2 cell structure. The 0.05wt% Fe2O3_doped TiO2 catalyst exhibited higher photocatalytic activity than that of undoped TiO2 but its performance decline with increase Fe2O3 content due to possible increase of recombination centers. Photocatalytic degradation of 2,4-D was optimized by response surface methodology. The highest 2,4-D degradation (48%) was obtained when 1.0 g of 0.05wt% Fe2O3_doped TiO2 is used to degrade 10 ppm of 2,4-D at pH 4.
KEYWORDS:Fe2O3-TiO2; Sol-gel; Photocatalysis; Response Surface; 2,4-Dichlorophenoxyacetic Acid
Introduction
Herbicides represent a priority group of pollutants that pose health risk in the environment. The 2,4-dichlorophenoxyacetic acid is hazardous to both flora and fauna [1] due to its widespread presence in surface and underground water [2]. Nonetheless, the use of this herbicide is rekindled by its low cost, good selectivity, and applicability, such as in the selective control of broadleaf weeds [3]. The removal of this pollutant from aqueous environment has been demonstrated by traditional methods such as adsorption [3], biodegradation [4] as well as advanced oxidation process [5]. Photocatalysis is one of the advanced oxidation processes used for the decontamination of organic pollutants. In photocatalysis, absorption of light, with energy equal or higher than the band gap energy, by the photocatalyst results in the generation of electron-hole pairs. The hole is strongly oxidizing, thus allowing the generation of secondary oxidizing species (such as hydroxyl radical), which together can cause the degradative oxidation of organic pollutant.
Titanium dioxide is an environmentally friendly, chemically stable, highly reactive and cost effective photocatalyst [6,7]. However, its efficiency is partly limited by its incapacity to span the visible range of electromagnetic spectrum and its rapid electron-hole recombination [8]. Among the many attempts made to reduce electron-hole recombination, metal doping plays a central role [9]. Doping with iron (III) is thought to have considerable potential because of the closeness of the ionic radius of Fe3+ (0.64 Å) to that of Ti4+ (0.68 Å), as this would reduce the band gap energy required for excitation and enhance photoactivity [10]. Previous workers showed inappreciable enhancement in the photocatalytic degradation of methyl orange [11] and 4-nitrophenol [10] when doping commercial or pyrolysis derived TiO2 with Fe3+. The potential of these photocatalyst powders is still open for research. In this study, Fe2O3_doped TiO2 was synthesized by sol gel method and used in the degradation of 2,4-dichlorophenoxy acetic. This study was focused on determining the optimum parameters that would yield the highest degradation efficiency.
Materials and Method
Chemicals
Titanium (IV) butoxide (Sigma-Aldrich), Fe(NO3)3.9H2O (SYSTERM), oxalic acid (Bendosen) and ethanol were used in the synthesis of the catalyst. Deionized distilled water was used in the preparation of 2,4-dichlorophenoxyacetic acid solution. All chemicals were used as received.
Synthesis of Fe2O3-TiO2
The 0.025-0.10wt% Fe2O3-TiO2 composites were prepared by sol-gel method. The sol was prepared by mixing stoichiometric amounts of ethanolic iron (III) nitrate nonahydrate with 0.1 mol/dm3 ethanolic titanium tert-butoxide solution. The sol was stirred at a constant rate for 1 hour to ensure its homogeneity. Oxalic acid (0.1 mol/dm3) was added slowly into the mixture to precipitate a thick yellowish white gel. The gel was purified by centrifugation 3 times at 4000 rpm in ethanol and dried at 70oC. The resulting yellowish white powder was ground and calcined at 550oC in Carbolite tube furnace for 4 h. Titanium dioxide was synthesized by the hydrolysis of the alkoxide using the same procedure but devoid of iron (III) nitrate.
Characterization of Catalysts
The percentage composition of Fe3+ in the synthesized catalysts was determined using Shimadzu EDX-720 energy dispersive x-ray fluorescence spectrometer. The crystallinity and phase purity of the synthesized catalysts were analyzed using a Shimadzu XRD-6000 diffractometer having Ni-filtered Cu Ka radiation (λ = 0.0154 nm, 30 kV, 30 mA). The XRD patterns of the powders were recorded in the 2q range of 2-60° with scanning rate of 2°min-1. The Braunuer-Emmett-Teller (SBET) surface area of the catalysts was determined from the nitrogen adsorption-desorption data at -196°C using Quantachrome AS1 Win-automated gas sorption instrument. The surface morphology and particle size of the catalysts were recorded on Hitachi 7100 transmission electron microscope. The particle size data was analyzed using Image J based free software and plots were constructed using the Statistical Package for the Social Science (SPSS) software. In order to determine the band gap energy of the catalysts, diffuse reflectance data were recorded on Perkin-Elmer Lambda 35 UV-Vis-NIR spectrophotometer. The reflectance data was related to the energy absorbed using the Schuster-Kubelka-Munk remission function.
Photocatalytic Experiment
Photocatalytic experiments were carried out in a batch photoreactor equipped with 6W Hitachi F6T5 UVA lamp having maximum intensity at 365 nm. The dimensions of the photoreactor are as previously described [12]. A liter solution of 2,4-dichlorophenoxyacetic acid (2,4-D) containing predetermined amounts of catalyst was charged into a batch photocatalytic reactor. The pH of the 2,4-D solution was adjusted using 0.1 M solution of NaOH or HCl. The mixture was continuously aerated and stirred to ensure even distribution of photocatalyst. Aliquot (10 ml) of the solution was drawn at 0 min and at 240 min. The concentrations of the 2,4-D (λmax 284 nm) in the test samples was determined using UV-Vis Perkin Elmer Lambda 35 spectrophotometer.
The efficiency of 2,4-D degradation Ŷexp was calculated as follows (Equation 1):

where Co and Ct represent the initial concentration of pollutant and concentration of pollutant at time 240 minutes respectively. The total organic carbon (TOC) in the degraded samples was evaluated by a TOC analyser (Shimadzu TOC-5000).
Experimental Design
To optimize the photocatalytic degradation of 2,4-D using Fe2O3-doped TiO2 photocatalyst, a three-level, three-variable face-centred central composite design (FCCD) was employed. The independent variables considered are the initial 2,4-D concentration (x1), mass of catalyst (x2) and pH (x3). As the FCCD is non-rotatable, there are three levels (low, central, high) of these variables and three codes (-1, 0, +1). These coded levels are displayed in Table 1. Other variables such as agitation speed, light intensity, oxygen pressure and delivery volume were kept constant. In this FCCD, a total of 17 experiments were performed as informed by formula N (experiments) = 2n + 2n + 3, where n is the number of variables. The degradation efficiency calculated using equation (1) is designated as the experimental response. Correspondingly, the experimental data can be processed using Design-Expert version 7.1.5 software (Stat-Ease Inc., USA) to obtain predicted responses, response surfaces and regression models.
Table 1: Levels and codes of experimental variable.
| Coded levels | ||||
| Experimental variables | Notation |
Low (-1) |
Central (0) |
High (+1) |
| Initial 2,4-D concentration (ppm) | x1 |
10 |
30 |
50 |
| Catalyst mass (g) | x2 |
0.2 |
0.6 |
1.0 |
| Initial pH | x3 |
4.0 |
7.5 |
11.0 |
Results and Discussion
Catalysts Characterization
The XRD patterns of the synthesized titania catalysts as a function of Fe2O3 content is displayed in Fig.1. Diffraction peaks observed at 2θ = 25.3o, 37.0o, 37.8o, 38.6o, 48.3o, 55.1o are characteristic of anatase TiO2 crystals which correspond to 101, 103, 004, 112, 200, 211 crystal planes (JCPDS 01-073-1764) [14]. The intensity of the peaks decreased with increasing iron content indicates that the presence of Fe3+ ion hinders the crystallization of TiO2 [15]. However the Fe2O3 was not obvious on the XRD, probably due to its small size on the anatase crystals [16]. To complement XRD, Fe3+ was assayed by x-ray fluorescence spectrometry (Table 2). The amounts detected did not vary significantly from the theoretical values. The assay further reveals that Fe3+ does not undergo any transformations under the calcination conditions of the study.
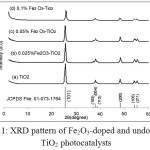 |
Figure 1: XRD pattern of Fe2O3_doped and undoped TiO2 photocatalysts |
The particle size distributions of the Fe2O3_doped and undoped TiO2 are displayed in Fig.2. The particle size distributions are unimodal which is indicative of uniform nucleation and crystal growth. The mean particle size and surface area of the bare TiO2 and the Fe2O3-TiO2 are presented in Table 2. The undoped TiO2 has higher particle size (21nm) than the Fe2O3/TiO2 catalysts. The decrease in the particle size of the doped catalysts suggest that the presence of Fe3+ inhibits the grain growth in the gel which resulted in smaller particle size of the catalyst [17].
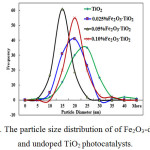 |
Figure 2: The particle size distribution of of Fe2O3-doped and undoped TiO2 photocatalysts. |
Table 2: Particle size, surface area, band gap energy and Fe3+ assay of the nanocatalysts.
|
Catalysts |
Average Particle size (nm) |
Surface Area (m2g-1) |
Band gap energy (eV) |
Fe2O3 (wt%) |
|
TiO2 |
21 |
34 |
3.20 |
0 |
|
0.025% Fe2O3_TiO2 |
17 |
12 |
3.10 |
0.020 |
|
0.05% Fe2O3_TiO2 |
13 |
15 |
3.07 |
0.046 |
|
0.10% Fe2O3_TiO2 |
18 |
18 |
3.05 |
0.112 |
It is commonly observed that the surface area of a catalyst increased as the particle size decreased. However, the surface area of the doped catalysts is lower than that of undoped TiO2 (34 m2/g). This observation can be attributed to agglomeration of the small size particles forming a larger agglomerated particle and the blockage of pores by the dopant [18]. The adsorption-desorption isotherms of Fe2O3 doped and undoped TiO2 photocatalysts are depicted in Fig. 3. The undoped TiO2 is characterized by a type V adsorption desorption isotherm according to IUPAC classification indicative of a mesoporous material while the Fe2O3_TiO2 is characterized by type III indicative of non-porous material. This observation confirms the blockage of the pores by the Fe2O3 hence resulting in the low surface area of the Fe2O3-TiO2 catalysts.
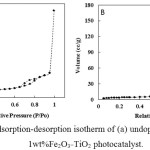 |
Figure 3: The adsorption-desorption isotherm of (a) undoped TiO2 and (b) 0.1wt%Fe2O3_TiO2 photocatalyst. Click here to View figure |
The TEM images of the Fe2O3_doped and undoped TiO2 photocatalysts are shown in Fig.4. Generally, the micrographs showed agglomerates consisting quasi spherical nanosized crystals. The TEM image of the as-synthesized undoped TiO2 (Fig.4(A)) is typical of anatase TiO2 nanocrystals in the same size ranges [19].
The band gap energies of the nanopowders (Table 2) were obtained from the extrapolation of the tangent of the linear part of Tauc’s curve (Fig. 5). The ordinates of the plot are basically the Schuster-Kubelka-Munk remission function (F(R)hυ)0.5 while the abscissae are the photon energies (hυ). The power 0.5 is the optical transition constant for anatase TiO2, being an indirect band gap semiconductor. From both the spectral plot and the table, red shift can be readily noticed as the percentage of Fe2O3_doping is increased. This may be attributed to the introduction of new energy levels into the TiO2 band gap as a result of the introduction of Fe3+ into the titania lattice [17,20].
Preliminary Analysis
The performance of Fe2O3_doped and undoped TiO2 photocatalysts was evaluated using 10 ppm 2,4-D, 0.2 g/L catalyst and the results are displayed in Fig. 6. The 0.05 wt% Fe2O3_doped TiO2 was found to outperform the rest of the doped TiO2, hence it was used in the optimization studies. The progressive degradation of 2,4-D by the 0.05wt% Fe2O3_doped TiO2 as a function of irradiation time is illustrated in Fig. 7. The decrease in intensity of the absorption band and the decrease in total organic carbon with increasing irradiation time indicate the degradation of 2,4-D by the photocatalytic process.
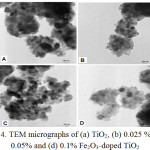 |
Figure 4: TEM micrographs of (a) TiO2, (b) 0.025 % (c) 0.05% and (d) 0.1% Fe2O3_doped TiO2 |
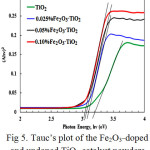 |
Figure 5: Tauc’s plot of the Fe2O3_doped and undoped TiO2 catalyst powders.
|
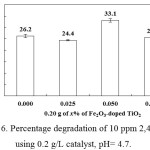 |
Figure 6: Percentage degradation of 10 ppm 2,4-D using 0.2 g/L catalyst, pH= 4.7. |
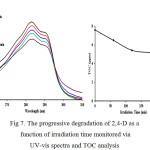 |
Figure 7: The progressive degradation of 2,4-D as a function of irradiation time monitored via UV-vis spectra and TOC analysis |
The enhanced photocatalytic activity observed for the 0.05wt% Fe2O3_doped TiO2 may be attributed to the Fe3+ ion that serves as shallow trapping sites for the charge carriers, thus separating the arrival time of e– and h+ pairs at the surface of the catalyst [21] (Li et al., 2009). Simultaneously, the Fe3+ ion inhibits the recombination of photogenerated e– and h+ pairs. By doping TiO2 with suitable Fe3+ ion concentration, the photogenerated electron being trapped consequently enhance the utilization efficiency of the photogenerated e– and h+ pairs [22] (Nguyen et al., 2011). Higher concentration of Fe3+ dopant may serve as recombination centers for the photogenerated e– and h+ pairs, thus decrease the photocatalytic activity [23] (Asiltürk et al., 2009).
Multivariate Optimization
The experimental designed was conducted within the domain shown in Table 3. The input parameters were the initial 2,4-D concentration (x1), mass of catalyst (x2) and pH (x3). The table presents both the actual values and the coded levels (in bracket) of these parameters as used for response surface design. In sum, 17 experiments were performed: 8 factorial (run 1-8), 6 axial (run 9-14) and 3 center experiments (run 15-17). The table also shows the experimental responses as well as the predicted responses of the input matrices. The experimental responsed were calculated using equation (1). The predicted responses were obtained using DX 7 software.
Table 3: The FCCD experimental matrix with response
| Run | Variables and codes |
Degradation |
|||
|
x1 |
x2 |
x3 |
Experimental (Ŷexp, %) | Predicted (Ŷcalc, %) | |
|
1 |
10 (-1) |
0.2 (-1) |
11.0 (+1) |
0.00 |
-0.43 |
|
2 |
50 (+1) |
1.0 (+1) |
11.0 (+1) |
0.00 |
1.03 |
|
3 |
50 (+1) |
0.2 (-1) |
4.0 (-1) |
4.99 |
2.60 |
|
4 |
10 (-1) |
0.2 (-1) |
4.0 (-1) |
37.07 |
36.65 |
|
5 |
50 (+1) |
0.2 (-1) |
11.0 (+1) |
0.00 |
2.04 |
|
6 |
50 (+1) |
1.0 (+1) |
4.0 (-1) |
7.69 |
8.73 |
|
7 |
10 (-1) |
1.0 (+1) |
4.0 (-1) |
48.64 |
47.22 |
|
8 |
10 (-1) |
1.0 (+1) |
11.0 (+1) |
0.00 |
3.00 |
|
9 |
30 (0) |
0.6 (0) |
4.0 (-1) |
13.57 |
16.75 |
|
10 |
10 (-1) |
0.6 (0) |
7.5 (0) |
26.93 |
26.19 |
|
11 |
30 (0) |
0.6 (0) |
11.0 (+1) |
0.00 |
-5.64 |
|
12 |
50 (+1) |
0.6 (0) |
7.5 (0) |
9.90 |
8.18 |
|
13 |
30 (0) |
0.2 (-1) |
7.5 (0) |
5.37 |
7.75 |
|
14 |
30 (0) |
1.0 (+1) |
7.5 (0) |
14.99 |
12.53 |
|
15 |
30 (0) |
0.6 (0) |
7.5 (0) |
10.30 |
10.14 |
|
16 |
30 (0) |
0.6 (0) |
7.5 (0) |
9.40 |
10.14 |
|
17 |
30 (0) |
0.6 (0) |
7.5 (0) |
8.19 |
10.14 |
The closeness of the predicted values to the experimental values is a primary indication of a true model. The optimum degradation efficiency of the photocatalytic reaction (48%) was achieved at x1 = 10 ppm, x2 = 1.0 g of 0.05wt% Fe2O3_doped TiO2 and x3 = 4. For prediction of degradation efficiencies, the generic, second order, polynomial regression model is developed:
Ŷcalc = 60.21830 – 2.44749x1 + 26.33524x2 – 1.10400x3 – 0.13859x1x2 + 0.13041x1x3-1.27411x2x3+0.018371x12-5.54093x22-0.34951x32 (2)
For the statistical validation of the regression model, analysis of variance (ANOVA) and coefficient of determination (R2) are presented in Table 4. Equation (2) has considerably high R2 (0.973). Traditionally, the ANOVA is utilized to test the significance of each term in regression equation and to fit the resulting regression model [24]. The F-value (28.0) and p-value (0.0001) both agree that the model is significant. The regression model demonstrates a better relationship between independent variables and the response when the R2 and adjusted R2 are close to 1 [25]. In this study, the p-values of the major parameters (x1 and x3)influencing the percentage removal of 2,4-D are significant (p < 0.05). Similarly, the interaction terms (x1x3) as well as the quadratic terms (x12) have probabilities less than 0.05, which indicates they significantly contribute to the degradation of 2,4-D.
Table 4: Analysis of variance for the response surface model
|
Source of variations |
Sum of Squares |
DF |
Mean Square |
F-Value |
p-value |
|||
|
Model |
2979.92 |
9 |
331.10 |
28.00 |
0.0001 |
|||
|
811.08 |
1 |
811.08 |
68.58 |
< 0.0001 |
||||
|
x2 |
57.07 |
1 |
57.07 |
4.83 |
0.0640 |
|||
|
x3 |
1253.50 |
1 |
1253.50 |
105.99 |
< 0.0001 |
|||
|
x1x2 |
9.83 |
1 |
9.83 |
0.83 |
0.3921 |
|||
|
x1x3 |
666.67 |
1 |
666.67 |
56.37 |
< 0.0001 |
|||
|
x2x3 |
25.45 |
1 |
25.45 |
2.15 |
0.1858 |
|||
|
x12 |
144.68 |
1 |
144.68 |
12.23 |
0.0100 |
|||
|
x22 |
2.11 |
1 |
2.11 |
0.18 |
0.6857 |
|||
|
x32 |
49.12 |
1 |
49.12 |
4.15 |
0.0810 |
|||
|
Residual |
82.78 |
7 |
11.83 |
|||||
|
Lack of Fit |
80.54 |
5 |
16.11 |
14.37 |
0.0663 |
|||
|
Pure Error |
2.24 |
2 |
1.12 |
|||||
|
Total (corr) |
3062.70 |
16 |
||||||
The effects of the independent variables and combined effects on the response variable were illustrated by 3D response surface plots (Fig. 8). Figure 8(a) shows the interaction between the initial concentration of 2,4-D and a mass loading of 0.05wt% Fe2O3_doped TiO2 at constant initial pH of 7.5. From the plot, the highest percentage removal of the pollutant was
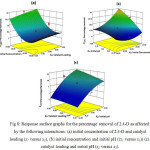 |
Figure 8: Response surface graphs for the percentage removal of 2,4-D as affected by the following interactions: (a) initial concentration of 2,4-D and catalyst loading (x1 versus x2), (b) initial concentration and initial pH ((x1 versus x3)) (c) catalyst loading and initial pH (x2 versus x3). |
obtained at a low initial concentration of 2,4-D (10 ppm) and a high mass catalyst (1.0). Regardless of the mass of the catalyst, the percentage removal decreased with increasing concentration. However, only a slight change in percentage removal was observed at low initial concentration as the mass of the catalyst is increased. This indicates that the initial concentration is the major factor in affecting the percentage removal. The high pollutant degradation obtained at lower pollutant concentration could be attributed to the more UV light penetration, leading to the activation of catalytic sites, which helps to degrade more of the pollutant [26].
The effect of initial concentration and initial pH of 2,4-D at constant catalyst mass (0.6 g) is displayed in Fig. 8(b). At low 2,4-D concentration, the percentage removal increase with decrease in initial pH solution. Similar trend was observed when the initial concentration of 2,4-D is decreased at low initial pH. However, there is no significant changes in percentage removal at pH 11 regardless of the initial concentration of 2,4-D. This indicates that the degradation of 2,4-D favours acidic condition.
Fig. 8(c) showed the interaction between the mass of Fe2O3_doped TiO2 and the initial pH of 2,4-D solution. The 2,4-D removal was not significant pH 11 but increase slightly at pH 4 as the mass of the Fe2O3_doped TiO2 is increased. However, regardless of the mass of the catalyst, the percentage removal of 2,4-D increased with decreasing initial pH of the 2,4-D solution.
Percentage removal of 2,4-D was higher under acidic conditions (pH 4) when compared to alkaline conditions (pH 11). In acidic condition, reduction of oxygen (O2) can produce hydroxyl radicals (•OH) through a series of reactions as equations 3- 7 demonstrates [27]:
O2 + e- → O2 (3)
O2– + H+ → HO2• (4)
2 HO2• → O2 + H2O2 (5)
H2O2 + O2– → •OH + O2 + OH– (6)
H2O2 + hυ → 2 •OH (7)
As the acidity increases, the number of •OH produced also increases. Since •OH is the predominant oxidation species, therefore the photocatalytic removal activity also increased.
Finally, experiments were performed to validate the statistical model of the study by comparing the experimental and predicted values of 2,4-D removal efficiencies. The experimental data was collected in triplicate under three predictor variables and the degradation efficiency was calculated using equation (2). The experimental and predicted data are shown in Table 5, are in good agreement indicating the validity of the analysis
Table 5: Validation of the decay model using new test sets
| Run |
Initial 2,4-D cocnetration (ppm) |
Catalyst mass (g) |
Initial pH |
Experimental efficiency (%) | Predicted efficiency (%) |
|
1 |
10 |
1.0 |
4.0 |
48.64 ± 1.43 |
47.10 |
|
2 |
13.7 |
0.91 |
4.6 |
36.43 ± 1.45 |
38.20 |
|
3 |
16.4 |
0.79 |
4.0 |
34.57 ± 0.89 |
34.43 |
Catalyst Reusability
To establish the reusability of the 0.05wt% Fe2O3_doped TiO2 photocatalyst, tests were conducted based at the optimum conditions of the study. Residual catalyst from degradation experiment was filtered, washed and dried then recycled in fresh experiment. As illustrated in Fig. 9, the degradation of 2,4-D decreased slightly after the 1st cycle but remained the same up to the 5th cycle. This clearly indicates the stability and the effectiveness of the 0.05wt% Fe2O3_doped TiO2 photocatalyst in degradation of 2,4-D.
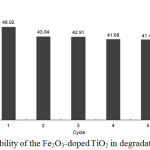 |
Figure 9: Reusability of the Fe2O3_doped TiO2 in degradation of 2,4-D. |
Conclusion
Uniformly crystalline Fe2O3_doped TiO2 and undoped TiO2 photocatalysts were successfully synthesized by sol-gel method. The doping of TiO2 led to diminishing particle size and surface area and band gap energy of the catalysts. 0.05 wt% is the optimum amount of Fe2O3that can be doped into TiO2 photocatalyst to produce the highest 2,4-D removal. The optimum removal of 48.64%, predicted using response surface methods, was achieved with 10 ppm 2,4-D solution, 1.0 g of 0.05wt% Fe2O3_doped TiO2 and at pH 4. The catalyst remained substantially active through the fifth cycle 2,4-D photodegradation.
Acknowledgments
Financial support from Universiti Putra Malaysia (RUGS vot 91817) and Graduate Research Fellowship (AR) is gratefully acknowledged.
References
- Howard, P.H.; Handbook of environmental degradation rates, CRC Press, Michigan, 1991.
- Alvarez, M.; López, T.; Odriozola, J. A.; Centeno, M. A.; Domínguez, M. I.; Montes, M.; Quintana, P.; Aguilar, D. H.; González, R. D. Appl. Catal. B _ Environ., 2007, 73, 34-41.
CrossRef - Hameed, B.H.; Salman, J. M.; Ahmad, A.L. J. Hazard. Mater., 2009, 163, 121-126.
CrossRef - Cycoń , M.; Żmijowska, A.; Piotrowska-Seget, Z. Cent. Eur. J. Biol., 2011, 6, 188-198.
- Rivera-Utrilla, J.; Sánchez-Polo, M.; Abdel daiem, M. M.; Ocampo-Pérez, R. Appl. Catal. B _ Environ., 2012, 126, 100-107.
CrossRef - Fujishima, A.; Rao, T. N.; Tryk, D. A. J. Photochem. Photobiol. C Photochem. Rev., 2000, 1, 1–21.
CrossRef - Carp, O.; Huisman, C.L.; Reller, A. Prog. Solid State Chem., 2004, 32, 33-177.
CrossRef - Rayalu, S.S.; Jose, D.; Joshi, M.V.; Mangrulkar, P.A.; Shrestha, K.; Klabunde, K. Appl. Catal. B _ Environ. 2013, 142– 143, 684– 693.
- Yang, X.; Ma, F.; Li, K.; Guo, Y.; Hu, J.; Li, W.; Huo, M.; Guo, Y. J. Hazard. Mater., 2010, 175, 429-438.
CrossRef - Yalçın, Y.; Kılıç, M.; Çınar, Z. Appl. Catal. B _ Environ., 2010, 99, 469-477.
CrossRef - Wang, X.H.; Li, J.-G.; Kamiyama, H.; Moriyoshi, Y.; Ishigaki, T. J. Phys. Chem. B. 2006, 100, 6804-6809.
CrossRef - Gaya,U.I.; Abdullah, A.H.; Zainal, Z.; Hussein, M.Z. J. Hazard. Mater. 2009, 168, 57–63.
CrossRef - Kao, L.-H.; Hsu, T.-C.; Lu, H.-Y. J Colloid Interface Sci., 2007, 316, 160–167.
CrossRef - Zhan, S.; Yang, J.; Liu,Y.; Wang, N.; Dai, J.; Yu, H.; Gao, X.; Yi, L. J. Colloid Interface Sci., 2011, 355, 328-333.
CrossRef - Egerton, T.A.; Mattinson, J.A. J. Photochem. Photobiol. A: Chem., 2008, 194, 283–289.
CrossRef - Cong, Y.; Zhang, J.; Chen, F.; Anpo, M.; He, D. J. Phys. Chem. C, 2007, 111, 10618-10623.
CrossRef - Hoffmann, M.R.; Martin, S.T.; Choi, W.; Bahnemann, D.W. Chem. Rev., 1995, 95, 69-96.
CrossRef - Onsuratoom, S.; Chavadej, S.; Sreethawong, T. Int. J. Hydrogen Energy, 2011, 36, 5246-5261.
CrossRef - Zhou, M.; Yu, J.; Cheng, B. J. Hazard. Mater., 2006, 137, 1838-1847.
CrossRef - Li, H.; Zhang, Y.; Wang, S.; Wu, Q.; Liu, C. J.Hazard.Mater., 2009, 169, 1045–1053.
CrossRef - Nguyen, V. N., Khoa, N., Nguyen, T., & Nguyen, P. H. Adv. Nat. Sci.: Nanosci. Nanotechnol., 2011, 2, 1–4.
- Asiltürk, M.; Sayılkan, F.; Arpaç, E. J.Photochem. Photobiol. A: Chem., 2009, 203, 64–71.
CrossRef - Hou, D.; Goei, R.; Wang, X.; Wang, P.; Lim, T.T. Appl. Catal. B _ Environ., 2012, 126, 121-133.
CrossRef - Chen, L.-C.; Huang, C.-M.; Hsiao, M.-C.; Tsai, F.-R. Chem. Eng. J., 2010, 165, 482–489.
CrossRef - Friedmann, D.; Mendive, C.; Bahnemann, D. Appl. Catal. B _ Environ., 2010, 99, 398–406.
CrossRef - He, J.; Cai, Q. Z.; Luo,Q.; Zhang, D. Q.; Tang, T. T.; Jiang, Y. F. Korean J. Chem. Eng., 2010, 27, 435-438.
CrossRef


ISSN Online: 2231-5039

![]()


