pH-Metric Studies of Mixed Ligand Complexes of Zn(II) With Famotidine and Peptides
Salhah D. Al-Qahtani
Department of Chemistry, College of Science, Princess Nourah bint Abdul Rahman University, Riyadh, Saudi Arabia.
Corresponding Author E-mail: Sunandmon00@yahoo.com
DOI : http://dx.doi.org/10.13005/ojc/330447
Solution equilibria of the ternary complexes of Zn(II) with famotidine (FAM) as primary ligand and peptides (L) as secondary ligands have been studied pH-metrically under the experimental conditions (25°C and ionic strength I = 0.10 mol/L NaNO3). Ternary complexes are formed by a simultaneous mechanism. The concentration distribution of the complexes in solution was evaluated as a function of pH. The values of Δ log K values for the ternary complexes have been evaluated and discussed
KEYWORDS:Famotidine; Peptides; Stability constants; Potentiometric titration
Download this article as:| Copy the following to cite this article: Al-Qahtani S. D. pH-Metric Studies of Mixed Ligand Complexes of Zn(II) With Famotidine and Peptides. Orient J Chem 2017;33(4). |
| Copy the following to cite this URL: Al-Qahtani S. D. pH-Metric Studies of Mixed Ligand Complexes of Zn(II) With Famotidine and Peptides. Orient J Chem 2017;33(4). Available from: http://www.orientjchem.org/?p=35112 |
Introduction
Famotidine (FAM), 3-[({2-[(diaminomethylidene) amino]-1 ,3-thiazol-4-yl}methyl)sulfanyl]-N’- sulfamoylpropanimidamide, is a histamine H2 receptor antagonist that inhibits stomach acid production1, 2. It is commonly used in the treatment of peptic ulcer disease and gastroesophageal reflux disease. The chemical formula of FAM together with the atomic numbering is shown in Fig.1. Due to the presence of amino, amido and thioether groups in its structure, this drug possesses chelating properties and may interact very effectively with the essential metal ions present in blood plasma and different tissues. In the crystalline state, famotidine has two polymorphic forms that differ by arrangement of intermolecular hydrogen bonds3-5. Several binary FAM complexes containing divalent transition metal ions have been synthesized in solution as well as in the solid state6-8. Determination of stability constant of complexes with drugs are useful to know the proper dose of drug and their effect with all other components of blood stream as well as to measure the strength of metal ligand bonds9. The complexes of drugs has higher efficacy than parent drugs10. In the present investigation, the stability constants of zinc (II) complexes with famotidine(FAM) and peptides (L) were studied in detail by potentiometric titration method in aqueous solutions at 25°C and I = 0.10 mol/L NaNO3. Species distribution over a range of pH of the complexes in solution was evaluated.
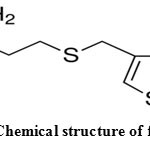 |
Figure 1: Chemical structure of famotidine. |
Experimental
Materials and Reagents
Famotidine drug (FAM), glycylglycine, glycinamide, glutamine and glycylleucine were provided by Sigma Chem. Co. All these chemical are used as received without any further purification, their purities ranged from 99-100%. Zinc (II) nitrate was provided by Aldrich. The zinc content of the solution was determined accurately by titration with standard EDTA11. The NaOH solution used for the titrations was determined with potassium hydrogen phthalate (Merck Chem. Co.). All solutions were prepared in deionized water.
Apparatus
The potentiometric measurements were made using a Griffin pH J-300-010 G Digital pH meter. The electrode was calibrated with standard buffer solutions (pH4.0 and 10.0) before the pH measurements at 25°C±0.1°C.
Potentiometric Procedure and Measurements
For equilibrium studies, the following solutions were prepared and titrated potentiometrically against standard carbonate- free NaOH 0.05 mol/L solution:
(A) 40 cm3 of a solution mixture containing (1.25×10⁻³ mol/L) ligands and 0.1 mol/L NaNO3
(B) 40 cm3 of a solution mixture containing Zn(II) (1.25×10⁻³ mol/L), the ligands (3.75× 10⁻³ mol/L) in the molar ratio of 1:3 and NaNO3 (0.1 mol/L)
(C) 40 cm3 of 40 ml of a solution mixture containing Zn(II), FMA and other ligands, all of concentration (1.25×10⁻³ mol/L) and 0.1 mol/L NaNO3. HNO3 solution was added, so that they were fully protonated at the beginning of the titrations.
The protonation constants of FAM (or L) were determined by titration of mixture (A). The formation constants of Zn(II)- FAM and Zn(II)-L complexes were determined by titration of mixture (C). The respective stability constants of Zn(II)- FAM-L for the ternary complexes were determined by titration of mixture (C). The ionic strength was kept constant (0.10 mol/L) using a NaNO3 solution, and a total volume of 40 cm-3 was used for each titration. [OH] values were calculated using a pKw value of 13.87±0.05 at 25°C. There was no precipitation within the pH range at which the titrations performed. For all the titrations, HNO3 solution was added, so that they were fully protonated at the beginning of the titrations.
Computer Analysis of Titration Data
The stoichiometries and stability constants of the complex species formed in solution were determined by examining various possible composition models for the systems studied. About 110 to 150 experimental data points were available for evaluation in each run. All the dissociation and the complex formation constants were determined using the HYPERQUAD program 12 and the speciation as a function of pH using the HYSS program 13.
Equilibrium constants evaluated from the titration data (table 1) are defined by equations (1) and (2).
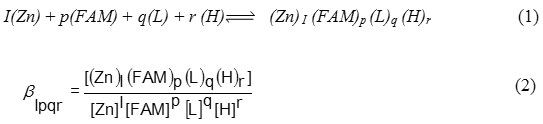
(charges are omitted for simplicity)
Where I, p, q and r are the stoichiometric coefficients corresponding to the zinc(II) ion, famotidine (FAM), peptides (L) and proton, respectively .
Table 1: Formation constants of the binary and ternary complexes in the Zn(II)-FAM- peptides systems at 25 ◦C and 0.1 mol/L ionic strength.
| System |
I |
p |
q |
ra |
logβb |
logK |
Δ logK |
% R.S. |
| FAM |
0 |
1 |
0 |
1 |
11.08(0.03) |
|||
|
0 |
1 |
0 |
2 |
17.83(0.02) |
||||
|
1 |
1 |
0 |
0 |
5.32(0.01) |
||||
|
1 |
1 |
0 |
1 |
12.66(0.02) |
||||
|
1 |
1 |
0 |
-2 |
-11.14(0.04) |
||||
| Glycylglycine |
0 |
0 |
1 |
1 |
7.97(0.01) |
4.66 |
0.64 |
15.92 |
|
0 |
0 |
1 |
2 |
10.55(0.01) |
||||
|
1 |
0 |
1 |
0 |
4.02(0.01) |
||||
|
1 |
0 |
2 |
0 |
7.12(0.02) |
||||
|
1 |
0 |
1 |
-1 |
1.53(0.01) |
||||
|
1 |
1 |
1 |
0 |
9.98(0.03) |
||||
| Glycinamide |
0 |
0 |
1 |
1 |
7.69(0.01) |
3.59 |
0.14 |
4.06 |
|
1 |
0 |
1 |
0 |
3.45(0.01) |
||||
|
1 |
0 |
2 |
0 |
6.52(0.01) |
||||
|
1 |
0 |
1 |
-1 |
-1.03(0.01) |
||||
|
1 |
1 |
1 |
0 |
8.91(0.03) |
Table 1: (Continued)
| System |
I |
p |
q |
ra |
logβb |
logK |
Δ logK |
% R.S. |
| Glutamine |
0 |
0 |
1 |
1 |
8.95(0.01) |
5.13 |
0.44 |
9.38 |
|
0 |
0 |
1 |
2 |
11.12(0.01) |
||||
|
1 |
0 |
1 |
0 |
4.69(0.04) |
||||
|
1 |
0 |
2 |
0 |
7.45(0.01) |
||||
|
1 |
0 |
1 |
-1 |
-0.89(0.01) |
||||
|
1 |
1 |
1 |
0 |
10.45(0.02) |
||||
| Glycylleucine |
0 |
0 |
1 |
1 |
8.13(0.00) |
4.46 |
0.27 |
6.44 |
|
0 |
0 |
1 |
2 |
11.04(0.02) |
||||
|
1 |
0 |
1 |
0 |
4.19(0.01) |
||||
|
1 |
0 |
2 |
0 |
7.18(0.01) |
||||
|
1 |
0 |
1 |
-1 |
1.40(0.01) |
||||
|
1 |
1 |
1 |
0 |
9.78(0.01) |
al, p and q are the stoichiometric coefficient corresponding to Zn(II), FAM or peptides and H+, respectively. b standard deviations are given in parentheses.
Results and Discussion
Proton- FAM Ligand System
The proton dissociation constants of the FAM ligand were calculated by fitting the volume-pH data, to the HYPERQUAD program and these constants are tabulated in Table 1. Three protonation sites are possible in FAM as shown in Figure 1. Only two deprotonation steps, can be determined for FAM in the fully protonated form in the titrable pH range at the guanidine and thiazole nitrogens with pKa values of 11.08 and 6.75, respectively.
Binary Complexes
In all titration curves the Zn(II)- ligand complex is lowered from that of the free ligand curve, indicating formation of Zn(II) complex by displacement of protons. The calculated stability constants of binary complexes of FAM drug and peptides with Zn(II) are presented (Table 1). The formation constants were determined by fitting potentiometric data on the basis of possible composition models. The selected model with the best statistical fit was found to consist of Zn (L)(1010), Zn (L)2(1020), Zn(H-1L) (101-1), Zn (FAM) (1100), Zn (H-2 FAM) (110-2) and Zn(HFAM) (1101) complexes. The concentration distribution diagram of Zn (II)-FAM system is shown in Fig. 2. The concentration of the 1100 species increases with increasing pH, attaining a maximum of 41.0% at pH 8.5. Further increase in pH is accompanied by a decrease in the concentration of the 1100 species and an increase in the concentration of the Zn (H-2 FAM) (110-2) species. Zn(HFAM) (1101) complex species has been found to be most favoured at lower pH values.
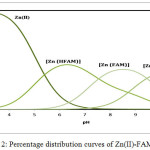 |
Figure 2: Percentage distribution curves of Zn(II)-FAM systems. |
Ternary Complexes Involving Zn2+, FAM and Peptides
The ternary complex formation involving Zn(II), FAM and peptides were characterized by fitting their potentiometric data to various models. The most acceptable model was found to be consistent with the formation of the complexes with stoichiometric coefficients 1110 and 111-1. On increasing the pH, the coordination sites should switch from the carbonyl oxygen to the amide nitrogen. Such a change in coordination centers is now well documented 14, 15. The amide groups undergo deprotonation and the [Zn(FAM) (LH−1)] complexes are formed. The glutamine complex is more stable than the glycinamide complex. The most likely explanation lies in the fact that glutaminate carries a negative charge, whereas glycinamide is neutral. The electrostatic interaction between the glutaminate and the positively charged Zn(II) complex would result in a lowering of the free energy of formation. Estimation of the concentration distribution of the various species in solution is a useful mean for elucidating the extent of Zn(II) binding capacity toward the primary and secondary ligands. The concentration distribution of the ternary complex formed with peptides attained values ranging from about 88% to 99.9% along the pH range 7.6-10.2. The equilibrium concentration distribution diagrams of the various complex species provide a useful picture of Zn(II) binding in the physiological pH range.
The parameter ∆ log K values are generally used to indicate the relative stability of the ternary complexes as compared to the binary ones as in equations:
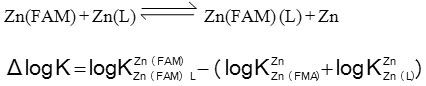
The Δ log K values (Table 1) are positive, showing that the ternary complexes are more stable than the corresponding binary complexes, and this may be attributed to inter ligand interactions occur in the ternary complexes.
The percent relative stabilization (% R.S.), to quantify stability of a ternary complex, may be defined as 16:
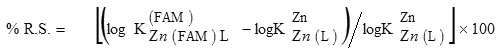
The values of % R.S. have been calculated (Table 1). For all systems, the parameter % R.S. is positive. This may be considered as evidence for the occurrence of enhanced stabilities. Positive values of % R.S. agree with the ∆ log K values.
Conclusions
The formation constants of the various complexes of Zn(II), FAM and peptides were determined potentiometrically at 25°C and ionic strength 0.1 M NaNO3. Ternary complexes are formed in a simultaneous mechanism. The formation constant values of the ternary complexes show that the Zn(II)-FAM–peptides ternary complexes are more stable than the 1:1 Zn(II)-FAM or Zn(II)- peptides binary complexes. Thus the 1:1 Zn(II)-FAM complex has a greater tendency toward combination with peptide molecule. The positive value of Δ log K is attributed to the extra stability of the ternary complexes.
References
- Malgorzata, B.; Wiesław, Ł.; Henryk, K.; Leonard, M. P. Journal of Inorganic. Biochemistry 2004, 98, 995–1001
CrossRef - Ganellin, C. R; Parsons, M.E. Pharmacology of Histamine Receptors, J. Wright and Sons, Bristol. 1982
- Van der Goot, H. ; Bast, A.; Timmerman, H. Handbook of Experimental Pharmacology, Springer, Berlin vol. 97 (chap.18). 1991
- Ishida, T.; In, Y.; Doi, M.; Inoue, M.; Yanagisawa, I. Acta Crystallographica B 1989, 45, 505-512.
CrossRef - Barańska M .,PhD thesis, Jagiellonian University, Krakōw. 1998
- Onoa, G. B.; Moreno, V. Journal of Inorganic Biochemistry 1998, 72,141–153.
CrossRef - Malgorzata, B.; Elzbieta, G. K; Henryk, K.; Leonard, M. P. Journal of Inorganic Biochemistry 2002, 92: 112–120
CrossRef - Maria, K.; Anna, M. D.; Maria, L. G. J. Chem. Soc., Dalton Trans. 1996, 1905-1908
- Thomas, G. Medicinal Chemistry, John Wiley and Son Co. Ltd. London. 2002
- Sapse, A. M.; Jain, D. C. Quantum Chemistry 1988, 33: 69-76.
CrossRef - Vogel, Quantitative chemical analysis,” 5th Edition, Longman, UK. 1989
- Gans, P.; Sabatini, A.; Vacca, A. Talanta 1996, 43: 1739–1753.
CrossRef - Gans, P.; Ienco, A.; Peters, D.; Sabatini, A.; Vacca, A. Coordination Chemistry Reviews, 1999, 184, 311–318.
CrossRef - Sovago, I. in K. Burger, (Ed.), Biocoordination Chemistry, Ellis Horwood, Chichester. 1990
- Pettit, L. D; Gregor, J. E.; Kozlowski, H. Prespectives in Bioinorganic Chemistry, Jai Press. Ltd. 1991
- Khalil, M. M.; Radalla, A. M. Talanta 1998, 46: 53-61.
CrossRef

This work is licensed under a Creative Commons Attribution 4.0 International License.
![]()
A New Edition of Web of Science
Journal Impact Factor
2022: 0.5
Five Year: 0.8
Journal is Indexed in

Cabells Whitelist
![]()


