Optimization for the Simultaneous Determination of Zinc in Environmental Samples With Calcon by Adsorptive Stripping Voltammetry: Response Surface Methodology
Deswati1, Hamzar Suyani1, Izzati Rahmi2, and Hilfi Pardi1
1Department of Chemistry, Faculty of mathematics and Natural Science, Andalas University, Kampus Limau Manis, Padang, Indonesia 25163.
2Department of Mathematics, Faculty of mathematics and Natural Science, Andalas University, Padang, Indonesia 25163.
Corresponding Author E-mail: deswati_ua@yahoo.co.id
DOI : http://dx.doi.org/10.13005/ojc/330455
A procedure for the optimization simultaneous determination zinc by adsorptive stripping voltammetry has been done. The purpose of this study was to obtain the optimum condition of zinc simultaneously. To achieve these objectives, required an optimization technique by using response surface methodology (RSM), with central composite design (CCD). The research design was used CCD with 4 variables, 3 level and 31 a combination of treatments. The first step of 2k factorial design optimization is: to give the highest level of code values (+1), the lowest level (-1) and code (0) as the center point. Programs have been used for statistical data processing, namely Minitab using RSM. Based on data analysis, the obtained optimum conditions for the simultaneous determination of zinc is the calcon concentration of 0.7018 mmol/L; pH = 7.1845; accumulation potential -0.5628 V, and the accumulation time 62.16 s. The optimum conditions obtained relative standard deviation (RSD) 2.5%, recovery of 98.01%,linier range (0.2-105) µg/L, and limit of detection (LOD) 1.21 (µg/L). This RSM has been successfully applied to the simultaneous determination of zinc in environmental samples.
KEYWORDS:Simultaneous determination; adsorptive stripping voltammetry; trace zinc; response surface methodology; environmental samples
Download this article as:| Copy the following to cite this article: Deswati D, Suyani H, Rahmi I, Pardi H. Optimization for the Simultaneous Determination of Zinc in Environmental Samples With Calcon by Adsorptive Stripping Voltammetry: Response Surface Methodology. Orient J Chem 2017;33(4). |
| Copy the following to cite this URL: Deswati D, Suyani H, Rahmi I, Pardi H. Optimization for the Simultaneous Determination of Zinc in Environmental Samples With Calcon by Adsorptive Stripping Voltammetry: Response Surface Methodology. Orient J Chem 2017;33(4). Available from: http://www.orientjchem.org/?p=35337 |
Introduction
Heavy metal contamination in the environment is a major concern worldwide because of toxicity of these metals and their potential threat to human health. Currently, quantification of heavy metals relies upon the collection of liquid discrete for subsequent laboratory analysis using techniques such as ICP-MS, AAS, GC, HPLC, FT-IR, and GS/MS1, but these instruments too expensive and are not practically applied especially in Indonesia. Therefore, the analysis is often limited to laboratory level. Since such requirements are greatly met with electrochemical methods.
Electrochemical methods are widely used in the field of analytical chemistry is sensitive, selective, simple, less costly and less time consuming2, simplicity, fast response, and suitability for the preparation of inexpensive and portable instrumentations3. Therefore we need a sensitive and selective method for determining the levels of trace amounts of metal ions, namely the adsorptive stripping voltammetry (AdSV). Adsorptive stripping voltammetry is chosen as an alternative method because it has many advantages including: high salt content from seawater not disturbing in analysis, high sensitivity, low detection limit on µg/L scale (ppb), easy use and easy sample preparation, rapid analysis, inexpensive infrastructure4-12. In addition, by this method, it is possible to study the chemical specimens of heavy metals13, which can not be done by other methods. The toxicity of heavy metals is determined from its chemical species14-15. Almost all methods of determining metals in very small quantities require considerable time at the pre-concentration stage before measurement. In voltammetric stripping adsorptive pre-concentration phase time is shorter, generally less than 1 minute7-8, 12, 16.
The previous research, to find the optimum condition, determination of metal ions Cd, Cu, Pb and Zn17 and Fe, Co, Ni and Cr18 in either singular or simultaneous form of AdSV, is done by observing the effect of one of the variables being changed while the other variable is kept at a constant level. This optimization technique is called the optimization of one variable or one factor at that time.
The weakness of the optimization of one factor is that optimization does not take into account the interaction effects between the variables studied. Therefore, this technique does not describe the full effect of parameters on the response19-22. Another disadvantage of one-factor optimization is an increase in the number of experiments required to conduct research, leading to increased time and increased consumption of reagents and materials. To overcome this problem, an analytic procedure optimization technique is needed by using RSM.
AdSV is a highly sensitive and selective technique7-8, 21-22, the response obtained in the form of peak current (Ip) is strongly influenced by the following variables, namely, the calcon concentration, pH, potential accumulation and time accumulation. Therefore, it is important to determine the optimization of these parameters, which will affect the measurement of peak currents in order to improve the quality of the analysis results23. However, in order to reach such a high sensitivity, the experiment must be carefully designed and important experimental factors, which can affect both response and accuracy, need to be optimized. A well-designed experiment can provide signals with superior quality compared to those measured without optimization24-25.
The purpose of this research is to get the optimum condition of Zn metal ion, so it can be applied to the analysis of the metal in environmental samples (seawater, fresh water, tap water, vegetables, and fruits) simultaneously. To achieve that goal, an analytical procedure optimization technique is required using RSM with CCD19-29. The analytic parameters of the Zn metal ions are determined as follows: detection limits, linear range, correlation coefficient, recovery and relative standard deviation (RSD).
Experimental Details
Material and Instruments
To the vessel voltammeter, 10 mL of mixed standard solutions of Cd(II), Cu(II), Pb(II) and Zn(II) 10 µg/L were added 0.2 mL KCl 0.1M and 0.2 mL 20 mL of solution.
The Instrument used in this research is Metrohm 797 Computrace with HMDE working electrode, reference electrode of Ag/AgCl/ KCl, and Pt electrode as supporting electrode; pH meters Griffin model 80, Griffin & George Loughborough, England; and analytical balance of Mettler AE 200, Toledo OH-USA; As well as glass equipment commonly used in laboratories.
General Procedure
The research design used in this study, as a tool for optimization are CCD with 4 variables, 3 levels/level, and 31 treatment combinations. The first step of 2k factorial design optimization is code, where the highest level (+1), the lowest level (-1) and code (0) as a center point. The program for statistical data processing is Minitab by using RSM (Table 1).
Table 1: CCD variable level for independent parameters of the metal ion mixture (Cd, Cu, Pb and Zn).
| Factors | Levels (Cd, Cu, Pb, Zn) | |||
|
-1 |
0 |
+1 |
||
| Calcon concentration (mM) | C |
0.6 |
0.7 |
0.8 |
| pH | pH |
5 |
6 |
7 |
| Potential accumulation (V) | E |
-0.7 |
-0.6 |
-0.5 |
| Time accumulation (s) | T |
40 |
60 |
80 |
Sumber : level 0 diambil dari penelitian sebelumnya4
Calcon concentration, pH, potential accumulation and time accumulation adjusted according to experimental design of CCD in Table 2, below. From Table 2, we get the response of the peak currents of metal ions Cd, Cu, Pb and Zn simultaneously.
Table 2: Experimental design of RSM for optimization simultaneous determination of Cd, Cu, Pb and Zn with Calcon
|
Run |
Factor |
Peak current (nA) |
||||||
|
Calcon (mM) |
pH |
Potential (V) |
Time (s) |
Cd |
Cu |
Pb |
Zn |
|
|
1 |
0.6 |
5 |
-0.7 |
40 |
21.75 |
129.74 |
52.22 |
57.58 |
|
2 |
0.6 |
5 |
-0.5 |
40 |
12.17 |
174.41 |
54.45 |
57.16 |
|
3 |
0.6 |
5 |
-0.7 |
80 |
37.35 |
178.61 |
105.90 |
43.44 |
|
4 |
0.6 |
5 |
-0.5 |
80 |
11.61 |
176.06 |
104.21 |
49.35 |
|
5 |
0.6 |
7 |
-0.7 |
40 |
16.36 |
266.66 |
40.21 |
87.60 |
|
6 |
0.6 |
7 |
-0.5 |
40 |
9.56 |
284.95 |
44.71 |
92.37 |
|
7 |
0.6 |
7 |
-0.7 |
80 |
23.61 |
269.02 |
38.17 |
77.73 |
|
8 |
0.6 |
7 |
-0.5 |
80 |
9.45 |
251.44 |
75.64 |
84.67 |
|
9 |
0.8 |
5 |
-0.7 |
40 |
25.11 |
180.35 |
41.40 |
61.13 |
|
10 |
0.8 |
5 |
-0.5 |
40 |
13.12 |
182.27 |
38.77 |
54.13 |
|
11 |
0.8 |
5 |
-0.7 |
80 |
48.71 |
191.26 |
79.17 |
54.13 |
|
12 |
0.8 |
5 |
-0.5 |
80 |
10.05 |
176.11 |
57.54 |
46.14 |
|
13 |
0.8 |
7 |
-0.7 |
40 |
92.35 |
295.00 |
39.16 |
83.35 |
|
14 |
0.8 |
7 |
-0.5 |
40 |
62.63 |
293.86 |
37.28 |
92.71 |
|
15 |
0.8 |
7 |
-0.7 |
80 |
101.69 |
313.50 |
40.20 |
90.03 |
|
16 |
0.8 |
7 |
-0.5 |
80 |
70.97 |
276.99 |
39.19 |
105.80 |
|
17 |
0.7 |
6 |
-0.6 |
60 |
104.33 |
221.07 |
80.86 |
101.49 |
|
18 |
0.7 |
6 |
-0.6 |
60 |
100.35 |
231.13 |
81.85 |
104.32 |
|
19 |
0.7 |
6 |
-0.6 |
60 |
105.21 |
232.14 |
80.86 |
105.29 |
|
20 |
0.7 |
6 |
-0.6 |
60 |
104.12 |
223.12 |
79.36 |
103.41 |
|
21 |
0.7 |
6 |
-0.6 |
60 |
103.13 |
222.07 |
83.14 |
103.43 |
|
22 |
0.7 |
6 |
-0.6 |
60 |
102.23 |
221.32 |
81.26 |
102.21 |
|
23 |
0.7 |
6 |
-0.6 |
60 |
104.12 |
222.04 |
81.26 |
101.21 |
|
24 |
0.532 |
6 |
-0.6 |
60 |
15.61 |
204.06 |
86.38 |
98.24 |
|
25 |
0.7 |
4.32 |
-0.6 |
60 |
19,67 |
201.89 |
74.87 |
92.89 |
|
26 |
0.7 |
6 |
-0.768 |
60 |
28.48 |
169.23 |
69.04 |
84.43 |
|
27 |
0.7 |
6 |
-0.6 |
26,4 |
12.25 |
123.32 |
33.70 |
88.11 |
|
28 |
0.868 |
6 |
-0.6 |
60 |
39.90 |
118.98 |
45.76 |
84.98 |
|
29 |
0.7 |
7.68 |
-0.6 |
60 |
78.77 |
117.77 |
69.87 |
97.65 |
|
30 |
0.7 |
6 |
-0.432 |
60 |
7.35 |
226.99 |
46.84 |
99.76 |
|
31 |
0.7 |
6 |
-0.6 |
93,6 |
12.72 |
186.71 |
87.97 |
83.61 |
Determination of Sampling Site and Sample Preparation
The sampling method is done by purposive sampling, which is done by taking into account the condition of the research area also the current and the depth of the research area. This is intended to see to what extent the concentration of pollutants spread. To know the content of heavy metals in sea water is done sampling in sea water taken around Bungus, water tap from research laboratory of Chemistry Department, lake water from Maninjau Lake and river water taken from Lubuk Minturun. Samples of water prior to analysis were preserved with 65% HNO3 with a ratio of 2: 1000 and filtered using Whatman 42 filter paper30.
Vegetable samples used in this study are, cauliflower, mustard greens, eggplant, and broccoli, while the fruits used include apples, banana kepok, melon and dragon fruit. Samples of vegetables and fruits before the determination of Zn metal content is determined first the water content, then do wet destruction with the addition of nitric acid pa and perchloric acid pa.
Each sample of 0.5000 g was carefully weighed and mashed, put into a Kestergum digestion flask. Further, the wet was destructed by the addition of 5 ml of concentrated nitric acid and 0.5 ml of concentrated perchloric acid, shaken and left overnight. Next, heated to the digestor block starting at 100°C, after the yellow vapor is exhausted the temperature is increased to 200oC. The destruction is terminated when the white vapor and liquid in the flask remain about 0.5 mL, cooled and diluted with doubly destilled water and the volume is adjusted to 50 mL, shaken until homogeneous and left overnight and disarrayed32.
Clear solution is ready to be determined by Zn metal content with Voltammeter and Atomic Absorption Spectrophotometer as a comparison. The determination of the optimum conditions used in this study is the procedure developed by the previous research team4, 7-9, 11-12, 17-18.
Detection Method
The procedure of determining RSD (relative standard deviation), LOD (limit of detection), LR (linear range) and recovery has been done by previous researchers The procedure of determining RSD (relative standard deviation), LOD (limit of detection), LR (linear range) and recovery has been done by previous researchers4, 7-9, 11-12, 17-18.
Result and Discussions
Optimization of Zinc Using one Variable
The optimization by observing the effect of one variable in the determination of trace metal Zn in the presence of calcon has been done [1]. The optimum condition as follow: calcon concentration 0.7 mM, pH 7, potential accumulation -0.6 V, time accumulation 70 s. At the optimum conditions, the relative standard deviation was obtained with 8 replicates (n = 8) measurements standard solution Zn(II) 10u g/L was 0.86 %, respectively. This technique does not describe the full effect on the response parameters and optimization of these factors is the increase in the number of trials required to do research, which leads to increased time and increased consumption of reagents and materials. Therefore to overcome this problem, an optimization technique of analytical procedures is by using RSM.
Optimization of Zinc using RSM
The polynomial equations, the effects of calcon concentration (x1), pH (x2), potential accumulation (x3), and time accumulation (x4) on peak current (ŷ), were obtained using the statistical software package, Minitap release 16. For an experimental design with four factors, the model includes linier, quadratic, cross terms and can expressed by equation (1):
ŷ = βo+ β1 x1+ β2 x2+ β3 x3+ β4 x4+ β11x12+ β22x22+ β33x32+ β44x42+ β12x1x2+ β13x1x3+ β14x1x4+ β23x2x3 + β24x2x4+ β34x3x4
Where ŷ in the AdSV predicted response, x1, x2, x3, and x4 are the independent variables, βo is intercept (constant), βi is the linier coefficient, βii is the squared coefficient and βij is the cross coefficient. The explained variation percentage was expressed by the the determination coefficient R2 at 5% statistical significance level.
The data was processed, which resulting the regression coefficient in the second orde model Table 3.
Table 3: Regression coefficients in the second order model
| Term | Coefficient |
| Constanta |
105.833 |
| x1 |
0.244 |
| x2 |
14.274 |
| x3 |
2.912 |
| x4 |
-2.412 |
| x1*x1 |
-7.966 |
| x2*x2 |
-6.672 |
| x3*x3 |
-7.795 |
| x4*x4 |
-9.998 |
| x1*x2 |
1.966 |
| x1*x3 |
0.180 |
| x1*x4 |
2.148 |
| x2*x3 |
2.275 |
| x2*x4 |
3.068 |
| x3*x4 |
1.491 |
Based on Table 3, the second order model obtained :
ŷ = 105.833+ 0.244 x1+14.2744 x2+2.912×3-2.412×4-7.966×12-6.672×22-7.795×32 9.998×42+1.966x1x2+0.180x1x3+2.148x1x4+2.275x2x3 +3.068x2x4+1.491x3x4
Table 4: ANOVA second orde model
| Sumber | DF | Seq SS | Adj SS | Adj MS | F | P |
| Regressi | 14 | 10343.5 | 10343.5 | 738.82 | 5.07 | 0.001 |
| Liniar | 4 | 4723.7 | 4723.7 | 1180.92 | 8.10 | 0.001 |
| x1 | 1 | 1.3 | 1.3 | 1.29 | 0.01 | 0.926 |
| x2 | 1 | 4412.7 | 4412.7 | 4412.70 | 30.27 | 0.000 |
| x3 | 1 | 183.6 | 183.6 | 183.63 | 1.26 | 0.278 |
| x4 | 1 | 126.0 | 126.0 | 126.05 | 0.86 | 0.366 |
| Square | 4 | 5214.7 | 5214.7 | 1303.68 | 8.94 | 0.001 |
| x1*x1 | 1 | 1436.2 | 1063.2 | 1063.21 | 7.29 | 0.016 |
| x2*x2 | 1 | 957.7 | 745.9 | 745.92 | 5.12 | 0.038 |
| x3*x3 | 1 | 1145.9 | 1017.9 | 1017.94 | 6.98 | 0.01 |
| x4*x4 | 1 | 1675.0 | 1675.0 | 1674.95 | 11.49 | 0.004 |
| Interaction | 6 | 405.1 | 405.1 | 67.52 | 0.46 | 0.825 |
| x1*x2 | 1 | 61.9 | 61.9 | 61.86 | 0.42 | 0.524 |
| x1*x3 | 1 | 0.5 | 0.5 | 0.52 | 0.00 | 0.953 |
| x1*x4 | 1 | 73.8 | 73.8 | 73.79 | 0.51 | 0.487 |
| x2*x3 | 1 | 82.8 | 82.8 | 82.81 | 0.57 | 0.462 |
| x2*x4 | 1 | 150.6 | 150.6 | 150.55 | 1.03 | 0.325 |
| x3*x4 | 1 | 35.6 | 35.6 | 35.58 | 0.24 | 0.628 |
| Residu Error | 16 | 2332.5 | 2332.5 | 145.78 | ||
| Lack-of-Fit | 10 | 2319.1 | 2319.1 | 231.91 | 103.61 | 0.000 |
| Pure Error | 6 | 13.4 | 13.4 | 2.24 | ||
| Total | 30 | 12676.0 |
Based on Table 4, test procedures are performed on the second order model. This hypothesis test is used to test the significance of the regression model, ie to test whether there are free variables (including quadratic and interaction effects) have a significant effect on the response variable.
The hypotheses tested were:
H0: βi = 0,
H1: there is βi ≠ 0; I = 1,2,3, …, k
Based on Table 2, the regression parameter test simultaneously yields p-value of 0.001, meaning that the p-value obtained is smaller than the significance level used by α = 0.05. Thus it is decided to reject Ho and it is concluded that there are independent variables that have a significant effect on the response variable, so that the second order model can be accepted.
It can be seen (Table 4) the test results for each type of influence independent variable to the response variables include linear, quadratic and interaction effects. The p-value for linear and quadratic effects are 0.001 (smaller than the α level used at 0.05). The effects of these effects (linear and quadratic) have a significant influence on the response variables. In other words, there is at least one linear influential variable and at least one quadratic variable influences the response variable. While for interaction effect test obtained p-value value of 0.825, which means statistically, none of the interaction effects that have a significant effect on the response.
Furthermore, the indicator of the accuracy of the model, based on the coefficient of determination (R2) obtained a value of 81.60%., Meaning the percentage of the diversity of responses capable of being explained by the second order model is 81.60%. Thus the second order model already has a fairly high level of accuracy. It can also be seen from the plot between the response value (experimental results) with the expected value of response (from the second order model) as can be seen in Figure 1.
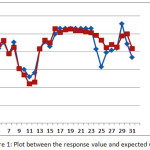 |
Figure 1: Plot between the response value and expected value |
From Figure 1, it can be seen that most of the alleged values obtained from the second order model are very close to the true response value. Thus the second order model gives a high accuracy of estimation.
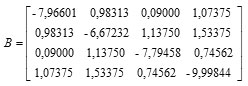
Determination of Stasioner Point
Based on the value of regression coefficient in Table 3 we can compile matrices b and B as follows:

dan
Sehingga diperoleh titik stasioner sebagai berikut:
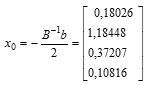
Thus, the response solution at the stationary point is obtained as follows:
![]()
Furthermore the stationary point can be returned to the real value, the conditions obtained that provide the optimal solution are as follows:
Table 5: Result of optimum condition of Zn with RSM
| Variable |
Optimal value (with encoding) |
Optimal value (without encoding) |
| x1 |
0,18026 |
0,7018 |
| x2 |
1,18448 |
7,1845 |
| x3 |
0,37207 |
-0,5628 |
| x4 |
0,10816 |
62,1632 |
Where : calcon concentration (x1), pH (x2), potential accumulation (x3), and time accumulation (x4)
Analysis of Response Surface Characteristics
To get an idea of the surface characteristics of the response, we first calculate the eigen value (λ) of the matrix B and obtain
λ = [ – 10, 8112 – 8,8183 – 7,9457 – 4,8561 ]
Since the four eigen values are negative, the response surface shape is maximum. It can also be viewed from contour plots and surface response plots. By constructing two constants between the 4 factors observed at the stationary point, a contour plot and response surface can be constructed as shown in the figure below.
Based on data analysis with surface response method, it is concluded that peak current will reach maximum value at the time of calcon concentration = 0.7018 mM, pH = 7.1845, potential accumulation -0.5628 V and time accumulatin 62.1632 s. The maximum value of the peak current is 1143.720 nA.
Plot Contour and Surface Response at Stationary Point (Figure 2)
By making a constant of two of the four factors used, it can be shown that the contour and the response surface are the maximum. In Figure 2, the contour plot will be presented and the surface of each possible pair of factors used by taking the condition of another factor is at a stationary point.
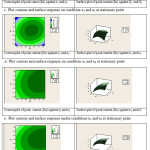 |
Figure 2: it can be seen the range of values of each pair of variables that allegedly will give the maximum value. |
As described previously, that at the stationary point obtained an optimum response value of 114.720. As an alternative to achieving the optimum response value, a combination of other values can be used as shown by the innermost circle of the contour plot. All pairs of points that are in this deepest circle are expected to produce a maximum response value with the following details:
Each pair of points in the innermost circle of the plot between x1 and x2 will result in a predicted value of > 100 response
Each pair of points in the innermost circle of the plot between x1 and x3 will produce an estimated value of > 110 response
Each pair of points in the innermost circle of the plot between x2 and x3 will produce an estimated value of > 110 response
Each pair of points in the innermost circle of the plot between x1 and x4 will result in a predicted value of > 100 response
Each pair of points in the innermost circle of the plot between x2 and x4 will result in a predicted value of > 100 response
Each pairs of points in the innermost circle of the plot between x3 and x4 will produce an estimated value of > 110 response
It can be given the choice of alternatives to generate maximum response values, there is flexibility in determining the level of each factor that is thought to be capable of generating maximum response value.
Application Method
To evaluate the validation of the proposed method for the analysis of real samples, the proposed procedure is applied to various samples such as water samples (sea water, tap water, river and lake water), vegetables (cabbage, broccoli, mustard greens, eggplant) (Apple, dragon fruit, melon and banana kepok). The Zinc concentration in the sample can be seen in Table 6. determined by the standard addition method using the recommended procedure under optimum conditions in the sample of vegetables and fruits
Table 6: Comparison of methods of determination of Zn in vegetable and fruit samples
| Sample |
Metode AdSV (mg/L) |
Metode AAS (mg/L) |
| Broccoli |
2.712 |
1.238 |
| Cauliflower |
2.198 |
1.218 |
| Eggplant |
2.153 |
1.471 |
| Mustard |
4.598 |
1.216 |
| Apples |
2.176 |
1.270 |
| Banana kepok |
5.786 |
1.417 |
| Dragon fruit |
7.453 |
1.241 |
| Melon |
4.091 |
1.232 |
The results from Table 6 show that the AdSV method gives satisfactory results when compared to the atomic absorption spectrophotometer (AAS) method. Furthermore, determination of Zn metal in environmental samples in AdSV by using calcon, can be seen in Table 7.
Table 7: Determination of Zn in environmental samples by AdSV using calcon
|
Sample |
Zn (mg/L) |
| Broccoli |
2.785 |
| Cauliflower |
1.88 |
| Eggplant |
2.005 |
| Mustard |
4.876 |
| Apples |
2.105 |
| Banana kepok |
7.412 |
| Dragon fruit |
7.612 |
| Melon |
3.871 |
| Sea water |
0.062 |
| Tap water |
0.034 |
| Water from Maninjau |
0.193 |
| Water from river |
0.010 |
Acknowledment
The authors are grateful to Ministry of Research and Higher Education for supporting this work No : 01/UN.16.17/PP.Proter/LPPM/2017, April 7, 2017.
Conclution
Based on data analysis with RSM, obtained optimum condition of the simultaneous determination zinc, calcon concentration: 0.70 mM, at pH 7.18, potential accumulation -0,56 V and time accumulation 62.16 sec. From the optimum condition obtained by value of RSD 2.5% with recovery 98.01%, linear range (0.2 -105) μg/L, and LOD 1.21 μg/L. This RSM can be applied to the simultaneous determination of zinc in environmental samples (water: lakes, taps, sea, rivers, fruits: apples, dragon fruit, cantaloupe and banana kepok and vegetables: broccoli, cauliflower, mustard and eggplant) effective.
References
- Wang, S; Xu, H; Li, J. Environmental electroanalytical chemistry. Chinese J. Anal. Chem. 2002, 30(8), 1005-1011.
- Gupta, VK; Sethi, B; Sharma, RA; Agarwal, S; Bharti, A. Mercury selective potentiometric sensor based on low rim functionalized thiacalix [4]-arene as a cationic receptor. J. Mol. Liq. 2013, 177, 114-118.
CrossRef - Krausa, M; Schorb, K. Trace detection of 2,4,6-trinitrotoluene in the gaseous phase by cyclic voltammetry. J. Electroanal. Chem. 1999, 1-2, 10-14.
CrossRef - Deswati; Suyani, H; Safni. The Method of the development of analysis Cd, Cu, Pb and Zn in sea water by adsorptive stripping voltammetry (AdSV) in the presence of calcon as complexing agent. Indones. J. Chem. 2012, 12(1), 20 -27.
CrossRef - Ensafi, A.A., Abbasi, S; Mansour, HR. Differential pulse adsorptive stripping voltammetric determination of copper(II) with 2-mercaptobenzimidazol at Hanging Mercury-Drop Electrode. Anal. Sci. 2001, 17, 609-612.
CrossRef - Zang, S; Huang, W. Simultaneous determination of Cd(II) and Pb(II) using a chemically modified electrode. Anal. Sci. 2001, 17, 983-985.
CrossRef - Deswati; Buhatika,C; Suyani, H; Emriadi; Loekman, U. Simultaneous determination of copper, lead, cadmium and zinc by adsorptive stripping voltammetry in the presence of murexide. Int. J. Res. Chem. Environ. 2014, 4(2), 143 -152.
- Deswati; Munaf, E; Suyani, H; Loekman, U; Pardi, H. The sensitive and simple determination of trace metals Fe, Co, Ni and Cr in water samples by adsorptive stripping voltammetry (AdSV) in the presence of calcon. Res. J. Pharm, Biol and Chem. Sci. 2014, 5(4), 990-999.
- Deswati; Amelia, L; Suyani, H; Zein, R; Jin, J. Applicability of kalsein in the simultaneous determination of trace metals copper, lead and cadmium by cathodic adsorptive stripping voltammetry. Rasayan. J. Chem. 2015, 8(3), 362-372.
- Deswati; Suyani, H; Zein, R; Refilda; Sutopo, J. Application of adsorptive stripping voltammetry for the determination of heavy metals Cd, Cu, Pb and Zn in the culture of fish floating net cages in Maninjau Lake, Agam, West Sumatra, Indonesia. J. Chem, Pharm Res. 2015, 7(8), 942-947.
- Deswati; Suyani, H; Zein, R; Alif, A; Pardi, H. Applicability of calcein as a chelating agent for simultaneous determination of Cd(II), Cu(II), Pb(II) and Zn(II) in water samples by adsorptive stripping voltammetry. J. Chem, Pharm Res. 2015, 7(10), 833 -840.
- Deswati; Suyani, H; Zein, R; Alif, A; Pardi, H. Adsorptive stripping voltammetric method for the individual determination of Cd(II), Cu(II), Pb(II), and Zn(II) in vegetable samples using calcein. Rasayan J. Chem., 2017, 10(2), 549-557.
- Jugade, R.M; Joshi, AP. Highly sensitive adsorptive stripping Voltammetric method for the ultra trace determination of chromium(VI). Anal. Sci. 2006, 22, 571-574.
CrossRef - Proti, P. Introduction to modern Voltammetric and polarographic analysis techniques. Amel Electrochemistry Ed. IV, 2001.
- Richard, JC; Martin, J; Milton, T. Analytical technique for trace element analysis : An overview. Trend in Anal. Chem. 2005, 24(3), 266 – 274.
- Amini, MK; Kabiri, M. Determination of trace amounts of nickel by differential pulse adsorptive cathodic stripping voltammetry using calcon carboxylic acid as a chelating agent. J. Iran. Chem. Soc. 2005, 2, 32-39.
CrossRef - Deswati; Suyani, H; Safni; Loekman, U; Pardi, H. Simultaneous determination cadmium, copper and lead in sea water by adsorptive stripping voltammetry in the presence of calcon as complexing agent. Indones. J. Chem., 2013, 13(3), 236 -241.
CrossRef - Deswati; Munaf, E; Suyani, H; Zein, R; Pardi, P.. Simultaneous determination of trace amounts of iron, cobalt, nickel and chromium in water samples with calcon as a complexing agent by adsorptive stripping voltammetry. Asian J. of Chem. 2015, 27(11), 3978-3982.
CrossRef - Deswati; Suyani, H; Zein, R; Izzati Rahmi, HG. Application of respon surface methodology for the determination of cadmium in sea water by adsorptive stripping voltammetry in the presence of calcon. J. Chem. Pharm. Res. 2015, 7(8), 750 -757.
- Deswati; Izzati Rahmi, HG; Suyani, H; Zein, R. Respon surface methodology optimization for the determination of zinc in water samples by adsorptive stripping voltammetry. J. Chem. Pharm. Res. 2015, 7(10), 862-870.
- Deswati; Izzati Rahmi, HG; Suyani, H; Zein, R;. Alif, A. Application of central composite design for optimization the determination of lead adsorptive cathodic stripping voltammetry. Rasayan. J. Chem. 2016, 9(1), 8-17.
- Deswati; Izati Rahmi, HG; Suyani, H; Zein, R; .Alif, A. Optimization central composite design for the simultaneous determination of Cd(II) ion in fruit and vegetable samples by adsorptive stripping voltammetry. Oriental J. Chem. 2016, 32(3), 1493-1502.
CrossRef - Paolicchi, I; Renedo, OD; Lomillo, MAL; Martinez, MAA. Application of an a optimazation procedure in adsorptive stripping voltammetry for the determination of trace contaminant metals in aqueos medium. Anal. Chim. Acta. 2004, 511, 223 -229.
CrossRef - Morgan, E. Chemometrics: Experimental design , ACOL, Newyork, Wiley, 1991.
- Jurado-Gonzales, JA; Galindo-Riano, MD; Garcia-Vargas, M. Experimental design in the development of a new method for the sensitive determination of cadmium in sea water by adsorptive cathodic strippping voltammetry. Anal Chim Acta. 2003, 487, 229-41
CrossRef - Izzati Rahmi, HG; Deswati; Suyani, H; Zein, R. Design experiment optimization for the determination of copper in water samples by adsorptive stripping voltammetry. Res. J. Pharm, Biol and Chem. Sci. 2016, 7(3), 673-682.
- Dewi, AK; Sumarjaya, IW; Srinadi, IGAM. Penerapan metode permukaan respons dalam masalah optimasi. E-Jurnal Matematika. 2013, 2(2), 32-36.
CrossRef - Bezerra, MA; Santelli, RE; Oliveira, EP Villar, LS; Escaleira, LA. Respon surface methology (RSM) as a tool for optimization in analytical chemistry. Talanta. 2008, 76, 965 – 977.
CrossRef - Yilmaz, S; Ozturk, B; Ozdemir,D; Eroglu, AE; Ertas, FN. Application of experimental design on determination of aluminum content in saline samples by adsorptive cathodic stripping Voltammetry. Turk. J. Chem. 2013, 37, 316 -324.
- Ensafi, A.A; Khayamian, T; Benvidi, A; Mirmomtaz, E. Simultaneous determination of copper, lead and cadmium by cathodic adsorptive stripping voltammetry using artificial neural network. Anal. Chimica Acta. 2006, 561, 225-232.
CrossRef - Miller, J.C; Miller, J.N. Statistics for Analytical Chemistry. Ellis Horwood, New York, 1994.
- Sulaeman, Suparto and Eviati. Technical guidelines for chemical analysis of soil, plants, water and fertilizers. Agency for Agricultural Research and Development, Ministry of Agriculture. 2005.

This work is licensed under a Creative Commons Attribution 4.0 International License.
![]()
A New Edition of Web of Science
Journal Impact Factor
2022: 0.5
Five Year: 0.8
Journal is Indexed in

Cabells Whitelist
![]()


