Inhibition Effect of Some Organic Compounds Toward the Corrosion of Steel Electrode in Citric Acid Solution Infected by Way of Chloride Ions
A. Diab1,2 and S. M. Abd El-Haleem1
1Chemistry Department, Faculty of Science, Zagazig University, Zagazig, Egypt.
2Chemistry Department, Faculty of Science, Jazan University, Jazan Kingdom of Saudi Arabia.
Corresponding Author E-mail: ahmeddeiab@yahoo.com
DOI : http://dx.doi.org/10.13005/ojc/330438
The chemistry behavior of steel electrode in acid solutions has been studied by galvanostatic polarization technique. The consequences of concentrations of acid and temperature of solutionare examined. It was found that greater the citric acidconcentration or reducing of temperature of the solution assist the passivation process. The values oficorrdecreased with greater concentrations of citric acid solutions and lowering of the temperature of solution. The free activation energy of passive film formed is determined and found to be 7.45 kJ/mole. Addition of increasing concentrations of some aggressive anions such as Cl- and SO4-- was also investigated. With increasing concentrations of those anions result in the destruction of the passive film due to the increasing of corrosion current density, icorr, and therefore the shift of corrosion potential, Ecorr, to more negative potentials. Trials had been made to inhibit the corrosion process via including a few organic compounds as, urea, phenylhydrazin and 1,2-phenylenediamine.
KEYWORDS:Steel; Citric acid; Passivation; Galvanostatic; Kinetic; Parameters
Download this article as:| Copy the following to cite this article: Diab A, El-Haleem S. M. A. Inhibition Effect of Some Organic Compounds Toward the Corrosion of Steel Electrode in Citric Acid Solution Infected by Way of Chloride Ions. Orient J Chem 2017;33(4). |
| Copy the following to cite this URL: Diab A, El-Haleem S. M. A. Inhibition Effect of Some Organic Compounds Toward the Corrosion of Steel Electrode in Citric Acid Solution Infected by Way of Chloride Ions. Orient J Chem 2017;33(4). Available from: http://www.orientjchem.org/?p=34642 |
Introduction
Corrosion process can be defined as gradual physiochemical destruction of metals and alloys by the action of environment. This is process usually begins at a surface of materials, nonetheless it may be prevented and controlled using the suitable blocking measures such as anodic protection, cathodic protection, metallic coating and using inhibitors, etc. Inhibitors are playing very good part in the controlling of corrosion process . The organic inhibitors containing hetero atoms like oxygen, nitrogen, sulphur and phosphorus, etc shows better corrosion inhibition by forming protective layer over the metal surface. Also the corrosion inhibition efficiency follows the order O < N < S < P [1-4].
Organic compounds used as inhibitors, occasionally, they act as cathodic, anodic or together, as cathodic and anodic inhibitors, nonetheless, as a preferred rule, act via a method of surface adsorption, designated as a film- forming. Obviously the prevalence of molecules showing a sturdy affinity for steel surfaces compounds showing top inhibition efficiency and occasional environmental hazard [5]. Those inhibitors building up a defensive hydrophobic film adsorbed particles on the electrode surface, which presents a barrier to the destruction of the metal in the tested solution. They have to be soluble or dispersible in the medium surrounding the metal [6].
The performance of an organic inhibitor depends of the: i- chemical structure, just like the size of the organic molecule; ii- conjugation system and/or aromaticity, because thearrangement of carbon chain; corrosion inhibitors – ideas, mechanisms and applications iii- type and wide variety of bonding atoms or businesses in the molecule (both π or σ); iv- nature and the fees of the metal surface of adsorption mode like bonding energy to steel substrate; v- capacity for a layer to emerge as compact or pass-linked, vi- functionality to form a complicated with the atom as a solid in the steel lattice; vii- form of the electrolyte solution like good enough solubility within the environment [7]. the efficiency of those organic corrosion inhibitors is associated with the presence of polar purposeful businesses with S, O or N atoms inside the molecule, heterocyclic compounds and pi electrons, normally have hydrophilic or hydrophobic components ionizable. The polar function is commonly seemed as the reaction center for the establishment of the adsorption procedure [5, 6]. the organic acid inhibitor that incorporates oxygen, nitrogen and/or sulfur is adsorbed on the steel floor blocking the energetic corrosion web sites. Despite the fact that the best and efficient natural inhibitors are compounds that have π-bonds, it gift organic toxicity and environmental harmful traits [8]. Compounds containing nitrogen atom can be used as a good inhibitors in wide range. These compounds can attached to metal surfaces within a transfer of electrons and forming a coordinated bond and therefore inhibition process taken place [9]. Polarization experiments using organic compounds show that those compounds are cathodic inhibitors [10]. Comparison of the inhibition efficiencies of organic molecules are various and indlude, among others, weight loss determination, open circuit potential measurements, potentiodynamic polarization curves depression of polarography highest, calculation of kinetic parameters and determination of elements dissolved by using of spectroscopy techniques [11]. The inhibition process of carbon steel have been noticed potentiostatically by several workers [12], however, most of workers interested by studing the role of the type of functional groups of the organic inhibitors and the good inhibition of some inorganic molecules to complete protection.
In the present work has therefore been planned to analyze the galvanostatic technique is used to spotlight the behavior of steel in citric acid solutions free from and containing the aggressive ions SO42- and Cl– as pitting formers. The research additionally concerned the usage of urea, phenylhydrazine and 1,2-phenylene diamine as an inhibitor for the corrosion of steel infected via 0.1M NaCl.
Experimental
The working electrodes were prepared from steel samples produced by the Egyptian Mill steel Company (Helwan- Cairo) with the following chemical composition:
| C Si Mn P S Fe |
| 0.32 0.24 0.89 0.024 0.019 98.507 mass % |
The steel electrodes were mounted to salt glass tubes with epoxy glue so the overall exposed region was 1.33 cm2. Electrical contacts were completed through thick copper wires linked to the ends of the steel rods not exposed to the electrolyte. Before being employed, the steel electrodes were scraped into uniform surfaces by a grinding machine (model Jean Wirtz TG 200, Germany) exploitation serial 0-, 00- and 000-grades emery papers, rinsed with acetone and at last washed with triply distilled water before immersing in the examined solution.
Measurements of polarization were carried out using galvanostatic technique. Before beginning the polarization, Immersion of steel electrode in the electrolyte taken place until the steady-state corrosion potential was reached. At first, low current density was used for polarization of the electrode cathodically or anodically, followed by higher ones. The potential was determined on a digital multimeter. For each current density used, the steady-state potential of the metal was obtained when its value did not alteration by over than 1mV in 10 minutes. Each run was approved in a renewed naturally aerated citric acid solution and with a fresh polished electrode. The cell has a double wall jacket through which water, at the agreed temperature, was circulated. Measurements were accepted at a constant temperature 25± 0.1°C, except those related to the influence of temperature. The cell temperature was measured using an ultra thermostat type polyscience (USA). The main joint of the cell contains openings for, the working electrode, the reference electrode (SCE) and one opening for. This latter was fitted into a compartment separated from the main bulk of the electrolyte by means of G4 sintered glass disc to complete separation between the anodic and the cathodic products.
Electrolytic solutions were ready from analytical grade reagents and triply-distilled water. Solutions of acid with totally different concentrations were ready by dissolving the corresponding quantitative weights of solid acid within the applicable volumes of water. Temperature affect was accepted as mentioned above. The effect of adding increasing concentrations of NaCl and Na2SO4 ranged from 1×10⁻⁴M to 1M was tested within the presence of definite concentration of acid as 0.5M. The addition of variable concentrations of some organic compounds such as urea, phenylhydrazine and 1,2-phenylenediamine were ready with a tested concentration of citric acid 0.5M and 0.1M NaCl.
Results and Discussion
Effect of Citric Acid Concentration
Fig. 1 indicates the potentiodynamicpolarization curves for the steel electrode in naturally aerated solutions of citric acid of variable concentrations at 25oC. The data show that, with increasing citric acid concentrations, the anodic polarization curves shift to more positive direction and the cathodic polarization curves shift to more negative direction. The corresponding values of the anodic and cathodicTafel slopes, βa and βc, also, the corrosion potential, Ecorr, corrosion current, icorr, and polarization resistance, Rp, are presented in Table 1. The corrosion current, icorr, was achieved by extrapolation of the Tafel lines to the steady state potential. The polarization resistance ,Rp, can be obtained from the Stern-Geary relationship [13] as:
icorr = (βa βc / 2.303(βa + βc ) Rp ) = B/Rp (1)
Inspection of Fig. 1 and the results ofTable 1, reveals that both the Tafel slopes, βa and βc are influenced by increasing the citric acid concentration. Simultaneously, the corrosion current density, icorr, reduces markedly while the corrosion potential becomes more noble.
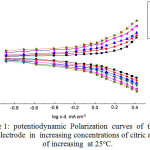 |
Figure 1: potentiodynamic Polarization curves of the steel electrode in increasingconcentrations of citric acid of increasing at 25oC. Click here to View figure |
This performance could easily be elucidated on the basis of the passivating oxide film formation on the steel electrode surface [14].
Table 1: Variation of kinetic parameters, Ecorr.,Icorr., βa , βc , and Rp for steel electrode with the concentration of citric acid as calculated from Fig. 1.
|
Concentration, M |
-E corr., mV (SCE) |
I corr., mA.cm2 |
βa , mV decade-1 |
βc , mV decade-1 |
Rp KΩ |
|
5×10⁻⁴ M |
569 |
0.339 |
56.878 |
– 86.427 |
0.04394 |
|
1×10⁻³ M |
546 |
0.309 |
127.78 |
– 92.28026 |
0.0753 |
|
5×10⁻³ M |
535 |
0.275 |
141.257 |
– 80.557 |
0.081 |
|
1×10⁻² M |
502 |
0.257 |
143.232 |
– 100.993 |
0.10007 |
|
5×10⁻² M |
476 |
0.24 |
197.862 |
– 188.917 |
0.17485 |
|
0.5 M |
421 |
0.229 |
245.579 |
– 228.65 |
0.22451 |
Citric acid is a multidentate chelating agent, which forms stable complexes with metal ions such as Fe2+, Ca2+, Mg2+ and Fe3+ in aqueous solutions [15]. In spite of the perceived importance and various research of metal-citrate equilibrium, the citrate complexes of both Fe2+ and Fe3+ have remained poorly characterized. Such uncertainties arise from considerable experimental difficulties, such as: (i) number and strength of the complexes formed, (ii) tendency to form numerous ternary complexes, FexCity(OH)z, (iii) extensive hydrolysis of both Fe2+ and Fe3+, (iv) facile oxidation of Fe2+ by atmospheric oxygen and (v) relatively weak interaction between Fe2+ and citrate [16]. Field et al. [17] studied the stability constants for different Fe2+ and citrate complexes. According to their study, the [FeHCit]– and [FeCit]2- complexes can be formed with dissociation constants of 2.4×10⁻⁹ and 1.58×10⁻⁵ respectively. These lower values enhanced the formation of citrate complexes with Fe2+.
According to the above descriptions, we can now consider the processes in the studied system [18]:
Anodic reaction: Fe → Fe+2surface + 2e–(2)
Cathodic reaction: O2 surface+ 2H2O + 4e → 4OH–surface (3)
The resulted Fe2+ ions diffuse from surface of metal into the bulk of solution,
Fe+2surface¾ → Fe+2bulk (4)
Furthermore the citrate ions migrate from bulk of solution into the electrode surface:
Cit4–bulk¾ → Cit4–surface (5)
A part of the surface citrate ions are adsorbed on steel surface:
Cit4– surface¾ → Cit4–adsorbed (6)
In addition, some of them form complexes with Fe2+ ions:
Cit4– surface+ Fe+2surface → [FeCit] -2 surface (7a)
Cit4– surface+ Fe+2surface+ H2O → [FeHCit] –surface (7b)
The produced complexes should be kept out of the surface; however, their mobility is less than smaller Fe2+ ions. This fact as well as the adsorption of citrate ions on metal surface may decrease the corrosion rate of the steel sample in the presence of citric acid. It is also obvious that the increase in concentration enhances the inhibiting action; that can be attributed to the enhancement of citrate surface concentration and subsequently increase of its adsorption on metal surface (eqs. 5 and 6) [18].
Effect of Temperature
The effect of increasing the temperature from (25°C – 65°C), on the potentiodynamic polarization curves of the steel electrode in naturally aerated 0.5M citric acid solution is shown in Fig. 2.
Obviously, in figure 2 the raising of the temperature imposes the anodic polarization curves’ shift into the cathodic direction in addition to the cathodic polarization curves into the anodic direction. In Table 2, the kinetic parameters values βa, βc, icorr, Ecorr and Rp are shown. From the values of icorrand Ecorr, increasing of temperature facilitates the dissolution of the passive film on the steel surface. This could be attributed to the lowering of solution viscosity and the consequent increase in the mobility of ions with elevation the solution temperature [19].Arrhenius plot of logicorr versus 1/T is shown in Fig 3. , from which the free activation energy of passive film formation, E*a, is calculated:
logicorr = -E*a / 2.303 RT + constant (8)
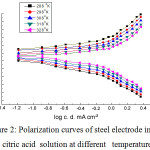 |
Figure 2: Polarization curves of steel electrode in 0.5 M citric acid solution at different temperatures. |
Table 2:Variation of kinetic parameters, Ecorr.,Icorr., βa , βc , and Rp for steel electrode in 0.5 M citric acid with Temperatureas calculated from Fig. 2.
|
Temperature, 0K |
-E corr., mV (SCE) |
I corr., mA.cm2 |
βa , mV decade-1 |
βc , mV decade-1 |
Rp KΩ |
|
288 |
395 |
0.19 |
255.016 |
– 239.18 |
0.28206 |
|
298 |
421 |
0.229 |
245.579 |
– 228.65 |
0.22451 |
|
308 |
472 |
0.245 |
218.543 |
– 199.057 |
0.18463 |
|
318 |
493 |
0.263 |
191.413 |
– 191.639 |
0.15811 |
|
328 |
537 |
0.282 |
162.477 |
– 185.402 |
0.13333 |
The value of E*a for the steel electrode in 0.5M solution of citric acid is found to be 7.45 kJmol-1 . The lower value of activation energy (<40 kJ/mole) shows that the process of formation a passive film on the steel electrode is under diffusion control [20- 22].
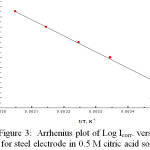 |
Figure 3: Arrhenius plot of Log Icorr. versus 1/T for steel electrode in 0.5 M citric acid solution. |
Effect of Addition of the Aggressive Cl– and SO42- Anions
The influence of increasing concentrations of NaCl and Na2SO4 on the potentiodynamicpolarization curves of the steel electrode in 0.5M naturally aerated solution of citric acid at room temperature is examined .
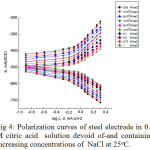 |
Figure 4: Polarization curves of steel electrode in 0.5 M citric acid solution devoid of-and containing increasing concentrations of NaCl at 25°C. |
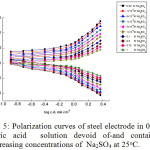 |
Figure 5: Polarization curves of steel electrode in 0.5 M citric acid solution devoid of-and containing increasing concentrations of Na2SO4 at 25oC. |
The curves of Figs. 4, 5 reveal that, adding higher concentrations of NaCl and Na2SO4 shifts the cathodic polarization curves into the noble direction and the anodic polarization curves into the more active direction. The kinetic parameters, icorr, Ecorr ,Rp, as well as, the corresponding anodic and cathodicTafel slopes are given in Table 3.
Table 3: The kinetic parameters, Ecorr.,Icorr., βc, βa and Rp for steel electrode in 0.5M citric acid solution at different concentrations of Na2SO4 and NaCl as calculated from Figs. 4. and 5.
| Concn., M |
-Ecorr., mV(SCE) |
Icorr., |
βa, |
-βc, |
Rp, |
|||||
|
mAcm-2 |
mV decade-1 |
mV decae-1 |
KΩ |
|||||||
|
SO4— |
Cl– |
SO4— |
Cl– |
SO4— | Cl– | SO4— | Cl– | SO4— | Cl– | |
| 0.00 M |
421 |
421 | 0.229 | 0.229 |
245.5 |
245.5 |
228.6 |
228.6 | 0.224 | 0.224 |
| 1×10⁻⁴ M |
449 |
441 | 0.245 | 0.234 |
234.2 |
226.4 |
208.1 |
208.9 | 0.195 | 0.201 |
| 5×10⁻⁴ M |
497 |
481 | 0.269 | 0.257 |
207.1 |
205.9 |
197.6 |
184 | 0.163 | 0.164 |
| 1×10⁻³ M |
538 |
509 | 0.288 | 0.263 |
193.8 |
191.5 |
184.6 |
151 | 0.142 | 0.139 |
| 5×10⁻³ M |
568 |
532 | 0.309 | 0.282 |
155.3 |
174.6 |
169.8 |
131.7 | 0.114 | 0.115 |
| 1×10⁻² M |
579 |
553 | 0.331 | 0.302 |
132.9 |
161.5 |
143.4 |
119.4 | 0.09 | 0.098 |
| 0.1 M |
611 656 |
571 | 0.355 | 0.324 |
119.1 |
146.7 |
125.1 |
96.4 | 0.074 | 0.078 |
| 0.5 M |
671 |
612 | 0.363 | 0.331 |
102.8 |
124.9 |
117.2 |
87.2 | 0.065 | 0.067 |
| 0.75 M |
711 |
639 | 0.38 | 0.347 |
91.9 |
109.1 |
98.3 |
82.7 | 0.054 | 0.058 |
| 1 M | 658 | 0.407 | 0.355 |
84.2 |
92.3 |
86.2 |
74.5 | 0.045 | 0.05 | |
Inspection of the data of Table 3 reveals that the presence of SO42- and Cl–ions has a marked effect on the anodic Tafel slope, βa, while the cathodicTafel slope, βc, keeps on more/or less unchanged, showing the increasing effect of the SO42- and Cl–ions on the anodic reaction. Thus , the presence of, SO42- and Cl–ions increases the ease of anodic reaction[23].
The effect of Cl– and SO4— ions on the destruction of passive film on steel can be deduced on the basis of a balance between two processes competing on the metal surface; stability of the passive film by complex formation and dissolution of the film by adsorption of Cl– and/or SO4— ions on the electrode surface [24, 25].
More inspection of the data of Table 3 reveals that the aggressiveness of NaCl and Na2SO4 depends on the concentration of citric acid. Thus, in one and the same citric acid concentration, the corrosion current density reported in the case of SO42- is much higher than that reported in presence of the same concentration of Cl– ions, while Rp values are lower for SO42- than those reported for Cl– ions. At the same time, the anodic slope, βa, determined in presence of SO42- ions is markedly lower than that determined in the case of Cl– ions. These observations reveal that SO42- ions are more aggressive than Cl– ions in the process of breakdown of the passive film on the steel surface [26]. The dependence of the corrosion current densities, icorr, on the concentration of the aggressive SO42- and Cl– anions, is shown in Fig. 6. It is clear that with increasing the concentration of the aggressive anions, icorr increases and varies with log Cagg according to:
logicorr = X + Y log Cagg (9)
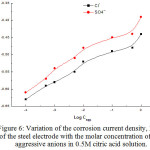 |
Figure 6: Variation of the corrosion current density, Icorr., of the steel electrode with the molar concentration of the aggressive anions in 0.5M citric acid solution. Click here to View figure |
where X and Y are constants. From the curves of Fig. 6, one can concluded that with increasing the concentration of the aggressive anions, the corrosion current densities, icorr, increase. Approximately, a like S shaped curves are obtained; this established that the mechanism of passive film dissolution caused by these anions is the same.
Effect of Organic Compounds as Corrosion Inhibitors
The effect of addition of increasing concentrations of some organic compounds, such as urea, phenylhydrazin and 1,2-phenylenediamine on the galvanostatic anodic and cathodic polarization curves of steel electrode immersed in naturally aerated 0.5M citric acid + 0.1 M NaCl solution, at room temperature, is shown in Figs.7 – 9, successively. From these curves, it is clear that the behavior of all organic compounds used is similar. The kinetic parameters βa , βc, icorr, Rp , Ecorrand IE are shown in Table 4.
The percentage inhibition efficiency (I.E.) of the inhibitors was determined as following:
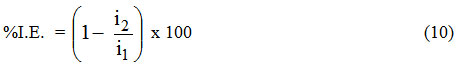
where i1 and i2 are the current density, in mA cm-2, measured in absence and in presence of inhibitors, respectively. The dependence of the corrosion current densities, icorr, of steel electrode in 0.5M citric acid solution + 0.1M NaCl on the concentration of the organic
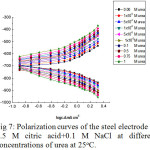 |
Figure 7: Polarization curves of the steel electrode in 0.5 M citric acid+0.1 M NaCl at different concentrations of urea at 25oC. Click here to View figure |
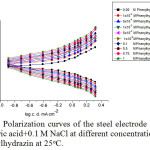 |
Figure 8: Polarization curves of the steel electrode in 0.5 M citric acid+0.1 M NaCl at different concentrations of phenylhydrazin at 25oC. Click here to View figure |
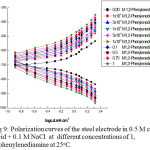 |
Figure 9: Polarization curves of the steel electrode in 0.5 M citric acid + 0.1 M NaCl at different concentrations of 1,2-phenylenediamine at 25°C. |
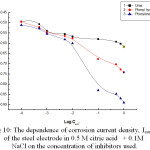 |
Figure 10: The dependence of corrosion current density, Icorr., |
inhibitors used, is shown in Fig. 10. It is clear that with increasing the concentration of the organic compounds, icorr decreases and varies with log Cinh according to:
logicorr = A – B log Cinh (11)
Where A and B are constants. Inspection of the curves of Figs. 7 – 11 and data in Table 4, reveals the following conclusions:
On increasing the concentrations of all the inhibitors used, the anodic polarization curves are shifted into the positive direction with a marked increase in the value of βa, and the cathodic polarization curves into the negative direction while βc remains more/or less unchanged. A behavior which indicates that the effect of these organic compounds is restricted to the anodic partial reaction.
In presence of one and the same organic compound concentration, βa increases; Ecorr is shifted into the noble direction; icorr is markedly decreased while Rp and the percentage inhibition efficiency, IE, are markedly increased. This behavior reveals increased inhibition of corrosion on increasing each inhibitor concentration.
In presence of constant inhibiting concentration, the inhibition efficiency, IE, increased in the order: urea <phenylhydrazin< 1,2-phenylenediamine, which is the same order previously found using other techniques [14].
Table 4:Variation of kinetic parameters, Ecorr.,Icorr., βa , βc , and Rp for steel electrode in 0.5 M citric acid + 0.1 M NaCl solution at different concentrations of inhibitors as calculated from figs. 7-9.
|
Inhibitor |
Concen., M |
-E corr., mV (SCE) |
Icorr., mA.cm-2 |
I.E |
βa , mV decade-1 |
βc , mV decade-1 |
Rp KΩ |
|
Urea |
0.00 |
571 |
0.324 |
– |
146.7 |
– 96.4 |
0.078 |
|
1×10⁻⁴ |
563 |
0.320 |
1.23 |
152.458 |
-103.524 |
0.08366 |
|
|
5×10⁻⁴ |
554 |
0.311 |
4.01 |
165.232 |
-110.354 |
0.09238 |
|
|
1×10⁻³ |
548 |
0.289 |
10.8 |
166.258 |
-125.325 |
0.10737 |
|
|
5×10⁻³ |
543 |
0.278 |
14.19 |
178.455 |
-132.859 |
0.11895 |
|
|
1×10⁻² |
537 |
0.271 |
16.35 |
182.258 |
-139.421 |
0.12657 |
|
|
0.1 |
533 |
0.263 |
18.82 |
199.322 |
-144.563 |
0.13834 |
|
|
0.5 |
523 |
0.255 |
21.29 |
204.329 |
-157.201 |
0.15129 |
|
|
0.75 |
517 |
0.250 |
22.84 |
209.985 |
-166.110 |
0.16108 |
|
|
1 |
510 |
0.241 |
25.61 |
211.346 |
-170.021 |
0.16976 |
|
|
Phenyl hydrazine |
0.00 |
571 |
0.324 |
– |
146.7 |
– 96.4 |
0.078 |
|
1×10⁻⁴ |
554 |
0.319 |
1.54 |
149.528 |
– 109.522 |
0.08605 |
|
|
5×10⁻⁴ |
548 |
0.301 |
7.1 |
158.663 |
– 114.695 |
0.09603 |
|
|
1×10⁻³ |
544 |
0.283 |
12.65 |
178.855 |
– 121.565 |
0.10726 |
|
|
5×10⁻³ |
535 |
0.272 |
16.05 |
181.687 |
– 133.601 |
0.11648 |
|
|
1×10⁻² |
522 |
0.265 |
18.21 |
197.101 |
– 145.220 |
0.13107 |
|
|
0.1 |
511 |
0.210 |
35.18 |
201.233 |
– 150.012 |
0.17771 |
|
|
0.5 |
508 |
0.198 |
38.88 |
214.667 |
-167.302 |
0.2062 |
|
|
0.75 |
498 |
0.187 |
42.28 |
220.122 |
-179.990 |
0.22993 |
|
|
1 |
495 |
0.181 |
44.13 |
229.710 |
– 181.123 |
0.24295 |
|
|
1,2-Phenylen diamine |
0.00 |
571 |
0.324 |
– |
146.7 |
– 96.4 |
0.078 |
|
1×10⁻⁴ |
517 |
0.308 |
4.94 |
157.248 |
– 110.232 |
0.09136 |
|
|
5×10⁻⁴ |
541 |
0.297 |
8.33 |
163.012 |
– 131.985 |
0.10663 |
|
|
1×10⁻³ |
535 |
0.279 |
13.88 |
174.365 |
– 149.211 |
0.12123 |
|
|
5×10⁻³ |
528 |
0.262 |
19.13 |
189.584 |
– 152.326 |
0.13998 |
|
|
1×10⁻² |
517 |
0.251 |
22.53 |
209.101 |
-171.895 |
0.1632 |
|
|
0.1 |
507 |
0.149 |
54.01 |
218.421 |
– 189.142 |
0.2954 |
|
|
0.5 |
498 |
0.142 |
56.17 |
228.214 |
– 197.597 |
0.32383 |
|
|
0.75 |
495 |
0.135 |
58.33 |
249.652 |
– 203.145 |
0.36025 |
|
|
1 |
491 |
0.129 |
60.18 |
261.550 |
– 212.753 |
0.3949 |
One of the ways an anodic inhibitor can reduce the corrosion rate is by aiding the passivation reaction by acting as a catalyst, or by increasing the activation energy barrier for the reduction reaction. In other words, it can reduce the corrosion rate by either increasing the anodic Tafel slope or by increasing the rest potential, or both[23] and/or the inhibitive compound may be incorporated into the passive layer on the metal surface, forming an improved stability against the aggressive ions [27].
Urea and its derivatives consider as a significant corrosion inhibition of metals and alloys because of the present of the nitrogen and oxygen atoms in their structures [28]. M. Manivannan studied the effect of urea as inhibitor on carbon steel in seawater and reported that the efficiency of urea increases by the addition of Zn2+ ion [28]. Urea fertilizer of certain concentration was reported to be a good corrosion inhibitor for concrete reinforced steel immersed in 3% NaCl (86.5% IF at 0.5 % concentration ) [29]. The reduction in the dissolution of metal in the presence of urea may be attributed to nitrogen and oxygen atoms present in the functional group. These groups are electroactive and interact with the metals surface to a greater extent. Adsorption can be electrostatic or chemisorptive or the inhibitor can act simply by physically blocking the active sites [30] or the inhibition due to the formation of a compact protective film of Fe2+ – Urea complex [31].
Phenylhydrazin, is assumed to inhibit the corrosion by the formation of phenylhydrazine-complex which is precipitated on the metal surface. However, its lower inhibition efficiency could be attributed to its lower tendency to form its corresponding salt or to the presence of the benzene ring which lying parallel to the electrode surface affecting thus the p electrons interaction with the metal surface[32]. The corrosion inhibition by phenylhydrazine can also be explained in terms of the anchoring atom in the function group. This compound is anchored on to the metal surface by the nitrogen atom of the –NH– group. The higher inhibition efficiency of this compound is attributed to reduce the electron density at anchoring nitrogen atom [33].
It is apparent that the adsorption of 1,2-phenylenediamine on the steel surface could occur directly on the basis of donor acceptor between the lone pairs of the heteroatoms, the extensively delocalized electrons over the C6 ring of benzene, the 1,2-phenylenediamine molecule and the vacant d-orbitals of iron surface atoms [34]. The functional group responsible for 1,2-phenylenediamine adsorption on metal surface is the lone pair of the nitrogen atom: iron ions on metal surface which act as a Lewis acid because they accept electrons from a donor group [35].1,2-phenylenediamine has ability to form a thin layer of adsorbed aminoquinone on steel surface which is responsible for the greater reduction of corrosion rate [36].
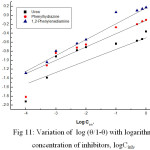 |
Figure 11: Variation of log (q/1-q) with logarithm concentration of inhibitors, logCinh. |
In order to understand the mechanism of corrosion inhibition the adsorption behavior of the organic adsorbate on the metal surface must be known. At any instant a fraction θ of the metal surface is covered by the inhibitor molecules and the uncovered fraction (1- θ) reacts with acid. The surface coverage θ values are very useful in explaining the adsorption characteristics. The surface coverage increases thereby increasing the percentage inhibition (Table 4). To examine the adsorption behavior of the inhibitor, the data were fitted to the Langmuir’s adsorption isotherm. A plot of log (θ/1- θ) versus log C (conc. of inhibitor) was a straight line supporting the monolayer adsorption of the inhibitor on the metal surface (Fig. 11):
log [ θ/(1- θ)] = -ΔG°/2.303 RT + log Cinh (12)
whereDG° is the standard free energy for pit repassivation by the inhibiting organic molecule, and K is the adsorbability constant of the inhibiting organic molecule on the steel surface:
K=exp (-ΔG°/2.303 RT) (13)
Table 5: The values of the adsorbability constant, K, and the standard free energy of repassivation, ΔG°, for the usedinhibitingorganicmolecules.
|
|
Urea |
Phenylhydrazine |
1,2-Phenylenediamine |
|
-ΔG°, KJmol-1 |
2.31 |
2.62 |
2.73 |
|
K |
0.41 |
0.33 |
0.29 |
Inspection of Table 5, shows that the values of both the adsorbability constant and the standard free energyof repassivation, ΔG°, by the used inhibitingorganicmoleculesdecrease in the order: urea >phenylhydrazin> 1,2-phenylenediamine, which is the same order reported before for their inhibition efficiencies. The presence of ΔG° with moderate negative values indicates that these compounds act as pitting corrosion inhibitor by adsorption in competition with Cl– ions for the active sites on the passive film covering the steel electrode [37].
Conclusions
The different factors affecting the electrochemical behavior of steel electrode in citric acid solutions by using polarization measurements were studied. Such factors were citric acidconcentrations, temperature, addition of NaCl, and Na2SO4 and addition of some organic compounds. The following conclusions could be drawn:
The higher citric acidconcentrations and decreasing of temperatures assist thepassivation of steel electrode by shifting Ecorr.towards more noble direction and reducing the corrosion current density, icorr..
The free activation energy of passive film formation is calculated and found to be 7.45 kJmol-1, indicating that the process of passive film formation is under diffusion control.
Addition of increasing concentrations of NaCl and Na2SO4 to the adjusted concentrationof citric acid increase the passive film dissolution, which investigated from shifting of corrosion potentials, Ecorr, to more active direction and increasing the values of corrosion current densities, icorr.
The addition of increasing concentrations of some organic compounds such as 1,2-phenylenediamine, phenyl hydrazine and urea inhibit the destruction of the passive film on steel electrode and the inhibition effect of these compounds decreases in the order: (the highest) 1,2-phenylenediamine ˃ phenylhydrazine ˃ urea (the lowest), which is the same sequence of increasing the inhibitive actions of these anions towards pitting corrosion of the steel.
The inhibition efficiency of each inhibitor increases with increasing its concentration.
Acknowledgement
The authors appreciate the financial support and facilities provided by the University of Zagazig to finish this work.
References
- Thomas, J.G.N. 5th European Symposium on Corrosion Inhibitors, Ferrara, Italy ,1981, 453.
- Doneelly, B.D.; Downie, T.C.; Grzeskowaik, C. R.; Hamburg H.R.; Short, D. J. Corrosion Science,1997,38, 109.
- Tadros, A.B.; Abdel-Naby, Y. J, Electroanalytical Chemistry, 1988, 224, 433.
CrossRef - Subramanyam, N.C.; Sheshadri, B.S.; Mayanna, S.M. J. Corrosion Science, 1993, 34, 563.
CrossRef - Aprael, S.; YaroAnees A.; KhadomRafal, K.; Wael. J. Alexandria Engineering,2013, 52(1), 129-135.
- Gentil, V. Corrosão, 4ª ed., Rio de Janeiro: LTC, 2003.
- SANYAL, B. Progress in Organic Coatings, 1981, 9, 165-236.
- Mahmoud El-Haddad, N. J. International Journal of Biological Macromolecules,2013, 55, 142-149.
CrossRef - Thomas, J.G.M., Proc. Symp. On Teddington, Februray, National Physical Laboratory.1979
- Zor, S. J. Turk Chem.,2002, 26, 403- 408.
- Khalafalla, S.E.; Shams El-Din, A.M.; Marci, S. A. Rec. Trav. Chim. (from chemical abstract),1959, 78, 513-518.
CrossRef - Saleh, Jalal M.; Al-Saadie, Kh. A. S.; Hikmat, N. A. Iraqi.J. Sci.,1995, 36(3), 803-824.
- Stern, M.; Geary, A. L.J. Electrochem. Soc., 1957, 104, 56.
CrossRef - Abd El-Haleem, S.M.; Diab, A.; AzaaAbd El-Megeed; Elgharabawy, M.IJMTER, 2015,2 (8), 188.
- A. J. C.J. Dodge, Influence of Complex Structure on the Biodegradation of Iron-Citrate Complexes, Applied and environmental microbiology,1993.,59, 109-113,. in English
- Francis, L.; Königsberger, E.; Königsberger, P.M.; May, G.T. Hefter, J. Inorg. Biochem.,2000, 78, 175-184.
- Hastings, A.B.; McLean, F.C.; Eichelberger, L.; Lowell Hall J.; Da Costa, E. J. Biol. Chem.,1934,107, 351- 370.
- Ashassi-Sorkhabi, H.; Asghari ,E.; Mohammadi,M.,J. Materials Engineering and Performance, 2014,23(8), August.
CrossRef - Pavlov, D.; Bojinov, M.; Laitinena, T; Sundholm, G.J. Electrochim.Acta, 1991, 36, 2081.
CrossRef - Metikos’-Hukovic, M.; Babic, R.; Omanovic, S. J. Electroanal. Chem.,1994,374, 199.
CrossRef - Zumdahl, S.S. Chemistry, third ed, D.C. Heath & Co.,1993.,645.
- Wieckowski, A.; Ghali, E. J. Electrochim.Acta, 1985, 30, 1423–1431.
CrossRef - Ramasubramanian, M.; Haran, B. S.; Popova, S.; Popov, B. N. ; Petrou, B. N. J. Material in Civil Engineering, 2001, 13 (1), 10-17.
CrossRef - Saremi, M.; Mahallai, E. J. Cement and Concrete Research, 2002, 32, 1915.
CrossRef - Foulkes, F.; McGrath, P. J. Cement and Concrete Research, 1999, 29, 873.
CrossRef - Abd El Kader, J.M.; El Warraky, A.A.; Abd El Aziz, A.M. J.Br. Corros.., 1998,33, 139- 144.
CrossRef - Refaey, S. A. M. J. Applied Surface Science, 2005, 240, 396-404.
CrossRef - Manivannan, M.; S. Rajendran. Int. J. Engr. Sci. Technol,2011, 3, 8048-8060.
- AbdulrasoulSalih Mahdi, International Journal of Advanced Research in Engineering & TechnologyIJARE,2014, 5(5), 30 – 39.
- DunyaEdan Al-Mammar. Iraqi J of Science, 2008, 49(2), 21-30.
- MANIVANNAN, M.; RAJENDRAN, S. International Journal of Engineering Science and Technology (IJEST), 2011, 3(11), 8048-8060.
- Chakrabarty, C.; Singh, M.M.; Agarwal, C.V., J. Br. Corros.,1983, 18, 107–110.
CrossRef - Suresh, G. S.; Aravinda, C. L.; Ahmed, M. F.; Mayanna, S M. Indian Journal of Chemical Technology, 1999, 6, 301-404.
- Mthar, M.; Ali, H.; Quraishi, M.A. J.Br. Corros., 2002, 37, 155.
CrossRef - Paskossy, T. J. Electroanal Chem, 1994, 364, 111.
CrossRef - Muthirulan, P.; Kannan, N.; Meenakshisundaram, M. J. of Advanced Research, 2013, 4, 385–392.
CrossRef - Ormellese, M.; Bolzoni, F.; Lazzari, L.; Pedeferri, P. J. Material and Corrosion, 2008, 59, 98-106.
CrossRef

This work is licensed under a Creative Commons Attribution 4.0 International License.
![]()
A New Edition of Web of Science
Journal Impact Factor
2022: 0.5
Five Year: 0.8
Journal is Indexed in

Cabells Whitelist
![]()


