Incorporation Onium System With Cloud Point Extraction Method for Extraction and Determination Iron(III) and Mercury(II) in Different Samples
Shawket Kadhim Jawad1, Mosa Omran Kadhim1 and Ebaa Adnan Azooz2
1Chemistry Department, Education Faculty for Women, Kufa University, Al-Najaf-31001, Iraq.
2The general directorate of education Al-Najaf Al- Ashraf, Al- Thakawat School.
Corresponding Author E-mail: Shawkat.alshakarchi@uokufa.edu.iq
DOI : http://dx.doi.org/10.13005/ojc/330433
By joined two sensitive methods which in onium method and Cloud point extraction method CPE for separation preconcentration and extraction Fe3+ andHg2+ by using (BAEE) from acidic hydrochloric aqueous solution in the presence TritonX-100. Spectrophotometric studies shows wave length for maximum absorbance to onium species of Fe(III) was λmax=362nm and for Hg(II) λmax=293nm. Optimum condition studies was 1M HCl for both ions ,100µg of each metal ions ,using 1×10⁻⁴ M of (BAEE) ,as well as the method need heating for 850C to Fe3+ and 950C for Hg2+ ion and heating time 15min. for Fe3+ and 20min. for Hg2+ ion.so that need existance 0.5mL of TritonX-100 for both metal ion ,the research involved many other studies. Thermodynamic data of Fe3+ andHg2+ was ΔHex=0.195, 0.0592 kJ mol-1, ΔGex=-66.480, -77.981 kJmol-1, ΔSex=186.245, 212.065 Jmol-1K-1, respectively ,application and spectrophotometric determination of Fe3+ ion andHg2+ ion in different samples.
KEYWORDS:Cloud point extraction; onium system; Nα-Benzoyl-L-arginine ethyl ester hydrochloride (BAEE); mercury; iron
Download this article as:| Copy the following to cite this article: Jawad S. K, Kadhim M. O, Azooz E. A. Incorporation Onium System With Cloud Point Extraction Method for Extraction and Determination Iron(III) and Mercury(II) in Different Samples. Orient J Chem 2017;33(4). |
| Copy the following to cite this URL: Jawad S. K, Kadhim M. O, Azooz E. A. Incorporation Onium System With Cloud Point Extraction Method for Extraction and Determination Iron(III) and Mercury(II) in Different Samples. Orient J Chem 2017;33(4). Available from: http://www.orientjchem.org/?p=34862 |
Introduction
Iron is known as one of the essential nutritional elements for many living organisms due to its role in most of metabolic processes, including oxygen and electron transport, and DNA synthesis. exposure to excess iron can cause several diseases or disorders such as endocrine problems, arthritis, diabetes and liver disease1,2. Mercury is a toxic element found throughout the environment. Its mobile nature allows it to diffuse through the air, soils and ultimately into water systems3Trace determination of heavy metals is one of the most important issues of chemical analysis4 In 1978 Watanab introduced cloud point extraction (CPE) as a new extraction method for determination of Zn with l-(2-Pyridylazo)-2-Naphthol ligand5 .Since then CPE was applied widely for determination of various analytes6-7, mainly for the extraction of metal ions 8-11. The most important feature of CPE is application of a surfactant, mostly non-ionic as the extractant phase12 which means that CPE avoids the consumption of large amounts of expensive, toxic and flammable organic solvents13.Use crown ether DB18C6 and from acidic HCl media extracted Fe3+ ion by application CPL after change Fe3+ into FeCl4– TritonX-100 was necessary to obtained higher extraction efficiency Thermodynamic data was ΔHex=0.159 kJ mol-1, ΔGex=-62.43 kJ mol-1, ΔSex=174.83 J mol-1K-1, there are another empirical application for this study in real samples14.Used CPE methodology for determination Hg2+ in different tissues of grilled chickens with application clod vapors atomic absorption and organic agent (DDTP) so Triton X-11415.By application of CPE method coupled with spectrophotometric technique for extraction and determination of Hg2+ in different samples of fish,new thiazolylazo reagent was synthesized 7-(6-Bromo2-benzothiazolylazo)-8-Hydroxyquinoline and Triton X-114 at specific pH=5, DOL=7.4 ng mL-1 16 .Sensitive application method of solvent extraction used onium system for extraction Zn2+ from acidic aqueous solution of HCl as oxonium species by used Methyl Stearate ester as sensitive extract ant dissolved in chloroform the study show extracted species giving maximum absorbance at wave length λmax =275nm,Sandell’s sensitivity = 0.00832μg.cm-218.
Experimental
Materialsand Solutions
For spectroscopic studies and absorbance measurements used double beam spectrophotometer (Biochrom Libra 560) (UK)so that used Electrostatic water bath (WNB7-45) (England) for heating to CPT, as well as all experiments needed balance (A & D company, Limited, Dool, CE, HR 200, Japan)(±0.0001g).
For preparing all the solutions needing in experiment used high purity materials received from commercial sources without further purification and used Doubly distilled water with set of suitable glassware, stock solution 1mg/mL of Fe3+ ion prepared by dissolving 0.2880 gm in of FeCl3 in 100 mL and for Hg2+ ion dissolved 0.1353 gm of HgCl2 in 100 mL of distilled water other working solutions preparing by dilution method with distilled water in suitable volumetric flask ,so 1×10⁻² M of Nα-Benzoyl-L-arginine ethyl ester hydrochloride (BAEE) was prepared by dissolving (0.08571gm) in (25mL) distilled water. Other working solutions were prepared by dilution method with distilled water.
Comprehensive Method
10 mL aqueous solution contain 100 µg of metal ion under study Fe3+ andHg2+ with optimum concentration HCl and 1×10⁻⁴ M (BAEE), in the presence 0.5 mL of non-ionic surfactant Triton X-100.Heating the solution in electrostatic water bath for suitable temperature and time until formation cloud point layer then separated CPL from aqueous solution and dissolved CPL in 5 mL ethanol. The absorbance of alcoholic solution is measured at λmax=362nm for Fe3+ and λmax= 293nm for Hg2+ ion against blank prepared in the same manner without metal ions. but Aqueous solution for Fe3+ ion treated according to thiocyanate method but Hg2+ ion treated according to Dithizone spectrophotometric method 18 to determine remainder quantity of metal ions in aqueous solution after extraction and subtraction this quantity from original quantity 100µg to determine the transferred quantity to CPL to formation onium species extracted then calculated distribution ratio (D).
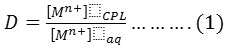
Whereas M+n= Fe3+ & Hg2+
Results and Discussion
Spectrophotometry
10 mL aqueous solution contain 100µg of Fe3+orHg2+ with 1M HCl and 1×10⁻⁴ M (BAEE),0.5mL 1% Triton X-100. Heating the solution in electrostatic water bath for suitable temperature and time until formation cloud point layer CPL with smaller volume, then separated CPL from aqueous solution and dissolved CPL in 5mL ethanol and talking absorption spectrum in(UV-Vis) region against blank prepared in the same manner without metal ions. The results were as in Figures (1 and 2):
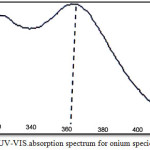 |
Figure 1: UV-VIS.absorption spectrum for onium species of Fe3+.
|
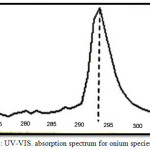 |
Figure 2: UV-VIS. absorption spectrum for onium species of Hg2+. |
The spectrum show wave length for the maximum the absorbance of onium species of Fe3+ ion was λmax= 362 nm but onium species of Hg2+ ion was λmax= 293 nm.
Variation of Hydrochloric Acid Concentration
Two set 10mL aqueous solutions contain 100µg of Fe3+orHg2+with different concentration HCl and 1×10⁻⁴ M (BAEE), 0.5mL 1% Triton X-100. Heating the solution to suitable temperature and time until formation CPL, then separated CPL from aqueous solution and complete the procedure according to comprehensive method. The results were as in Figures (4 and 5).
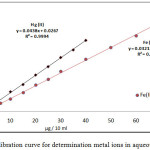 |
Figure 3: calibration curve for determination metal ions in aqueous solutions.
|
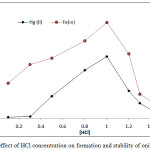 |
Figure 4: effect of HCl concentration on formation and stability of onium species |
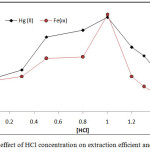 |
Figure 5: effect of HCl concentration on extraction efficient and D value |
The results shows 1M HCl was the optimum molar concentration of HCl in aqueous solution for extraction onium species of Fe3+ and Hg2+ ions at this molar concentration reached to higher extraction efficiency appear higher absorbance and D values because at this molar concentration reached to favorable equilibrium of formation onium species so that partitioning into cloud point layer CPL
4 HCl + Fe3+ + 4 H2O → H(H2O)4+ ;FeCl4– + 3H+ …..(1)
H(H2O)4+ ;FeCl4–+ 3BAEE → H(H2O)(BAEE)3+ ;FeCl4– + 3H2O ….(2)
H(H2O)(BAEE)3+ ;FeCl4– (Aqua.) → H(H2O)(BAEE)3+ ;FeCl4– (CPL) …(3)
Any concentration of HCl less than optimum value being not enough to reach favorable equilibria and giving decline in extraction efficiency so that any concentration of HCl in aqueous solution more than optimum value effect to decrease extraction efficiency because effect to increase the rate of backward direction of equilibrium.
Effect of Metal Ions Concentration
Extracted Fe3+orHg2+ according to onium system as detailed in comprehensive method from 10 mL aqueous solutions contain rising quantity of metal ions with existence 1M HCl The results were as in Figures (6 and 7):
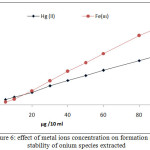 |
Figure 6: effect of metal ions concentration on formation and |
![Figure 7: D= f [metal ions]](http://www.orientjchem.org/wp-content/uploads/2017/07/Vol33No4_Inc_Sha_fig71-150x150.jpg) |
Figure 7: D= f [metal ions] |
The results appear linear relation between extraction efficiency and metal ion concentration in aqueous solution to optimum value of metal ion concentration equal to 100 µg at constant of other constant conditions, that in mean increasing in onium species formation and partitioning to CPL with increasing metal ion concentration.
Rising BAEE Concentration Effect
Extracted100µgof each metal ion under study in10mL aqueous solutions by rising concentration of BAEE at constant other condition according to comprehensive method, The results were as in fig Figures (8,9) (8 and 9):
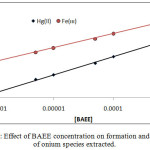 |
Figure 8 : Effect of BAEE concentration on formation and stability of onium species extracted. |
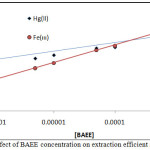 |
Figure 9 : Effect of BAEE concentration on extraction efficient and D value |
The results shows linear relation and reflect increasing in onium species concentration formation and stability with increasing concentration of BAEE, that is mean BAEE is un thermodynamic parameter which in it increasing concentration effect to increase that rate of forward direction of formation onium species with increasing concentration of onium species formed.
Thermodynamic
Effect of temperature on extraction efficiency of onium species by joining onium system and CPE methods involved extraction 100 µg in 10 mL aqueous solutions of each ion in presence 1M HCl ,1×10-4M (BAEE), 0.5 mL 1% Triton X-100 at rising temperature with 15 minutes of heating at each temperature according to comprehensive method. The results were as in Figures (10 and 11).
The extraction method shows 85°C was optimum temperature for extraction Fe3+ ion but 95°C for extraction Hg2+ after calculated extraction constant Kex for each ion by following the relation (2).
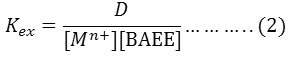
Diagram log Kexagainst 1/T K as in Figure (12)
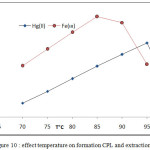 |
Figure 10: effect temperature on formation CPL and extraction |
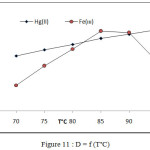 |
Figure 11: D = f (T°C) |
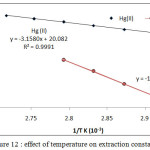 |
Figure 12: effect of temperature on extraction constant.
|
From the slopes of straight lines in fig (12) and relations (3-5) calculated thermodynamic data of extraction as in table (1)
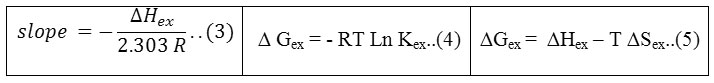
Table 1: Thermodynamic data of extraction.
|
Metal ions |
ΔHex kJ mol-1 |
ΔGex kJ mol-1 |
ΔSex J mol-1K-1 |
|
Fe3+ |
0.195 |
-66.480 |
186.254 |
|
Hg2+ |
0.0592 |
-77.981 |
212.065 |
At the optimum temperature reaching the thermodynamic equilibrium to formation CPL with favorable distribution to CPL to giving best extraction efficiency.
Effect of Heating Time
According to comprehensive method extracted Fe3+and Hg2+ from 10mL aqueous solutions involved 100µg of each metal ions and 1M HCl,1×10-4M (BAEE), 0.5 mL 1% Triton X-100. Heating at optimum temperature for rising time. The results were as in Figures (13 and 14):
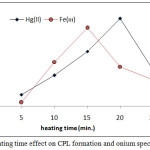 |
Figure 13: heating time effect on CPL formation and onium species extracted.
|
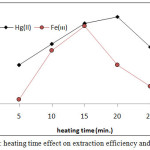 |
Figure 14: heating time effect on extraction efficiency and D value. |
The results shows (15min.) was the optimum heating time for extraction Fe3+ but for extraction Hg2+ ion needing (20min.) for heating. Whereas the heating time represents kinetic side of extraction at optimum value reach best equilibrium of CPL with higher density and small volume ,as well as favorable dehydration at any heating time less than optimum not reached to equilibrium so that at heating time more than optimum value increase the diffusion of micelles with decrease in dehydration so decrease in extraction efficiency.
Effect of Surfactant Volume
From 10mL aqueous solutions contain 100µg of Fe3+orHg2+ ions at optimum condition in existence rising volume of surfactant Triton X-100 according to comprehensive method. The results were as in Figures (15 and 16):
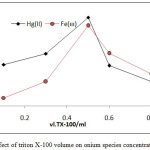 |
Figure 15: effect of triton X-100 volume on onium species concentration extracted |
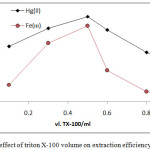 |
Figure 16: effect of triton X-100 volume on extraction efficiency and D value |
The results shows 0.5ml of TX-100 was the optimum surfactant volume for extraction both ion Fe3+and Hg2+this volume help to reached the state of critical micelles concentration CMC and produce best CPL enough to extracted higher quantity of onium species, volume less than optimum not allow to CMC, so that volume more than optimum value and by effect of electrostatic interaction between micelles increase diffusion of micelles with decrease in CPL
Effect of Electrolyte Salts
Extracted metal ions according to comprehensive method at optimum condition and in presence 0.01mL of different electrolytes, the results were as in table (2).
Table-2: Effect of electrolyte on extraction efficiency of Fe3+orHg2+ ions.
|
Electrolyte salts |
Fe3+ |
Hg2+ |
||
|
Abs. 362 nm |
D |
Abs. 293 nm |
D |
|
|
LiCl |
1.832 |
114.45 |
1.725 |
218.50 |
|
NaCl |
1.716 |
106.31 |
1.631 |
183.30 |
|
KCl |
1.638 |
99.00 |
1.510 |
165.70 |
|
NH4Cl |
1.601 |
91.51 |
1.480 |
151.40 |
|
MgCl2 |
1.813 |
109.52 |
1.646 |
192.80 |
|
CaCl2 |
1.616 |
94.53 |
1.575 |
171.21 |
The results appear enhancement in extraction efficiency in presence electrolyte in aqueous solutions because the electrolyte doing to destroying the hydration shell of metal ion Fe3+and Hg2+so that cause increase in dehydration of micelles that is mean increasing in onium species concentration formation and formation good CPL, also appear this effect differ from electrolyte to other according to behavior of electrolyte in aqueous solutions and LiCl giving the higher effect.
Interferences Effect
From 10 mL aqueous solutions extracted 100µg of Fe3+orHg2+ ions in presence 1M HCl , 1×10⁻⁴ M (BAEE), 0.5mL 1% TritonX-100 and 0.01ml of some interferences at optimum condition according to comprehensive method. The results were as in Table (3).
Table 3: Effect of interferences on extraction efficiencies
|
Interferences |
Fe3+ |
Hg2+ |
||
|
Abs. 362 nm |
D |
Abs. 293 nm |
D 40.11 28.65 |
|
|
Ni 2+ |
0.235 |
16.56 |
0.469 |
|
|
Co 2+ |
0.328 |
22.12 |
0.321 |
|
|
Cd 2+ |
0.807 |
57.44 |
0.646 |
60.34 |
|
Cu 2+ |
0.610 |
40.57 |
0.478 |
47.32 |
|
Zn 2+ |
0.689 |
43.83 |
0.701 |
80.51 54.47 |
|
Mn 2+ |
0.901 |
63.81 0.512 |
||
The results appear all metal cation give partially interferences and effect to decrease extraction efficiency because all these metal ion participation in formation onium species and this participation effect to decline concentration of HCl, (BAEE), than optimum values needed to extraction Fe3+ and Hg2+ and this decline in concentration not allow to reached equilibrium of formation and extraction onium species, but by reason of different ability and behavior of these metal cation in aqueous solutionsso different participation.
Applications
For spectrophotometric determination of Fe3+ and Hg2+ in different environmental and vital samples followed, the comprehensive method for extraction metal ion under study from 10mL aqueous solutions contain different quantity of metal cat ion at all optimum condition and after separated CPL from aqueous solutions ,and dissolved CPL in 5mL ethanol and measure absorbance for ethanolic solutions against blank prepared in the same method without metal ions, then plot absorbance against ppm of metal ion as in Figure (17)
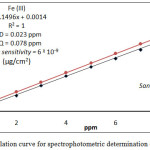 |
Figure 17 : calculation curve for spectrophotometric determination of Fe3+ and Hg2+ |
Any sample after preparing treated according to comprehensive method at optimum condition after measure the absorbance and return to calibration curve for each metal ion determine metal ion in the sample.The results were as in table (4) .
Table 4 : Fe3+ and Hg2+ content (ppm) in different samples.
|
samples |
Fe3+ |
Hg2+ |
||||
|
Thiocyanate method 18 |
Applied method* |
RSD % |
Dithiazone method 18 |
Applied method* |
RSD % |
|
|
agriculture 1 |
13.50 |
13.20 |
0.12 |
0.18 |
0.17 |
0.02 |
|
agriculture 2 |
20.60 |
21.00 |
0.02 |
0.20 |
0.16 |
0.03 |
|
Cow meat (Beef) |
01.50 |
01.60 |
0.14 |
0.16 |
0.20 |
0.01 |
|
chicken (breast) |
07.20 |
07.40 |
0.12 |
0.16 |
0.21 |
0.05 |
|
Drainage fish |
17.10 |
16.80 |
0.02 |
0.60 |
0.58 |
0.09 |
|
River water |
01.00 |
00.90 |
0.01 |
0.48 |
0.51 |
0.01 |
|
garden cress |
06.30 |
06.60 |
0.13 |
0.40 |
0.37 |
0.14 |
|
celery |
05.00 |
05.20 |
0.15 |
0.10 |
0.09 |
0.12 |
|
lettuce |
06.80 |
06.50 |
0.11 |
0.15 |
0.10 |
0.14 |
|
cucumber |
05.00 |
05.40 |
0.01 |
0.08 |
0.10 |
0.17 |
|
Tomato |
08.60 |
08.40 |
0.30 |
0.04 |
0.05 |
0.05 |
*Values given represent the average of five analysis of each sample.
Reference
- Jaric I., Jeftic Z.V., Cvijanovic G., Gacic Z., JovanovicL., SkoricS., LenhardtM., Microchemical Journal, 2011,98 ,77 .
CrossRef - LieuT., HeiskalaM. ,PetersonP.A., Yang Y., Molecular Aspects of Medicine,2001,22,1.
CrossRef - By Lab Manager Staff,Determination of Mercury in Waters by U.S. EPA Method 245.1 Cold Vapor Atomic Absorption Spectroscopy,2010 ,20.
- TokalioǧluŞ., KartalŞ., Elci L., Analytica Chimica Acta, 2000, 413, 33.
CrossRef - H. Watanabe, H. Tanaka,. Talanta,1978 ,25, 585 .
CrossRef - Jawad S.K., Azooz E.A., IMPACT: Journal of Research in Applied, Natural and Social Sciences, 2015, 1, 2.
- Jawad S.K., Salih M.N. , Journal of Natural Sciences Research ,2015 ,5, 3.
- Jawad S.K. , Hayder F.H. Journal of Eur. Chem. Bull. ,2015 ,4 , 8.
- Khammas Z. A-A. , Jawad S.K. , Ali I.R.,Global journal of science frontier research chemistry ,2013, 13 ,6.
- Jawad S.K. , Azooz E. A. , International Journal for Sciences and Technology ,2014, 9, 1 .
- Jawad S.K. , J. R. Muslim, Iraqi National J. of Chemistry , 2012,47,401-412.
CrossRef - Pytlakowska K., KozikV., Dabioch M.,Talanta, 2013 , 110, 202 .
CrossRef - Jawad S.K. , Azooz E.A. ,FIRE Journal of Science and Technology, 2015, 3, 261-273.
- Jawad S.K. ,KhaleelL. A. , Journal of Kufa for Chemical Science ,2016 , 2, 1.
- Shah A .Q ., KaziT.G., Baig J .A.,Afridi H.I., Kanhro G.A.,Arain M.B. ,Kolachi N.F. and Wadhwa S.K.,food and chemical toxicology,2010 , 48 ,65-69.
- KhammasZ. A.A., Ghali A.A. ,Kadhim K. H. . Iraqi National Journal of Chemistry, 2013 , 49, 25.
- Jawad S.K. ,Yassin M.A. ,BEST: Journal of Humanities, Arts,Medicine and Sciences,2016 , 2, 2.
- Marczenko Z., Balcerzak M. ,Separation preconcentration and spectrophotometry in inorganic analysis. Amesterdam: ELSEVIER, 2000, 1st.

This work is licensed under a Creative Commons Attribution 4.0 International License.
![]()
A New Edition of Web of Science
Journal Impact Factor
2022: 0.5
Five Year: 0.8
Journal is Indexed in

Cabells Whitelist
![]()


