Geochemical Environment of Oil and Gas Occurrences in the South-Caspian Basin Based on the Results of the Study of Mud Volcano Ejecta.
R. N. Mustaev
Gubkin Russian State University of Oil and Gas (National Research University) 65 LeninskyProspekt, Moscow, 119991, Russian Federation.
Corresponding Author E-mail: r.mustaev@mail.ru
DOI : http://dx.doi.org/10.13005/ojc/330452
The article demonstrates the results of geochemical studies with products of mud volcanoes conducted for a purpose of evaluating the generative potential of the South-Caspian basin. The kerogen types have been identified for different stratigraphic intervals and stages of the OM thermal maturity have been determined. The correlation had been established between the generative potential and the basin deposition and subsidence rate.
KEYWORDS:Geochemical research; mud volcanoes; the South Caspian basin; sedimentation; kerogen; generation potential
Download this article as:| Copy the following to cite this article: Mustaev R. N. Geochemical Environment of Oil and Gas Occurrences in the South-Caspian Basin Based on the Results of the Study of Mud Volcano Ejecta. Orient J Chem 2017;33(4). |
| Copy the following to cite this URL: Mustaev R. N. Geochemical Environment of Oil and Gas Occurrences in the South-Caspian Basin Based on the Results of the Study of Mud Volcano Ejecta. Orient J Chem 2017;33(4). Available from: http://www.orientjchem.org/?p=34584 |
Introduction
There is no analog in the world to the South-Caspian oil and gas basin in terms of the number of mud volcanoes and their diversity. Over 400 mud-volcano buildups are concentrated there, which is the quarter of the world count. This region also displays active mud volcano behavior, which is accompanied by ejection of a large volume of rock fragments and blocks (Fig.1).
Each mud volcano may be treated as a natural well delivering on the surface rock fragments practically from the entire feed channel. The region of the South-Caspian basin is built by a tremendous thickness (25 – 30 km) of Mesozoic-Cenozoic sediments and represents a unique information subject for a depth study of Earth. The origin of mud volcanoes is often being connected with oil and gas fields [1]. Large oil and gas-condensate fields have been discovered in the mud volcano areas (Lokbatan, Garadag, NeftyanyeKamni [«Oil Rocks»], Mishovdag, etc.).
For a purpose of evaluating the generative potential of the Mesozoic-Cenozoic complex in the South-Caspian depression, in the geochemical laboratory of Gubkin Russian State University of Oil and Gas studies have been conducted of 69 rock samples from из 22 mud volcanoes. The volcanoes are located on the Absheron Peninsula, in the Shamakhy-Gobustanarea, Lower Kura area, as well as the Caucasus Major (Fig.2). Also have been studied micro-oil samples from mud volcanoes Lokbatan, Chapylmysh and Gushchu.
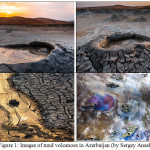 |
Figure 1: Images of mud volcanoes in Azerbaijan (by Sergey Anashkevich) |
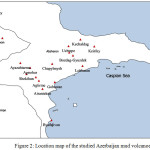 |
Figure 2: Location map of the studied Azerbaijan mud volcanoes. |
Geochemical Study Techniques
The samples have been studied using the pyrolysis technique with the Rock-Eval equipment. This enabled the determination of the whole spectrum of parameters describing qualitative and quantitative features of the rock OM. The parameters included: total organic carbon (ТОС), realized (S1) and residual rock generative potential (S2), oxygen and hydrogen indices (OI and HI), temperature of maximum hydrocarbon yield at pyrolysis (Тmax), productivity index (PI), etc.
Genetic and katagenetic characteristics of the organic matter are illustrated by various correlation diagrams for such pyrolytic parameters as НI, OI, S1+S2, Т°max, TOC, etc. One such diagram is a correlation diagram of the hydrogen index (НI) vs. Т°max. This diagram is in essence a modified Van-Krevelen diagram. It provides the opportunity not only of identifying kerogen fields of different OM types but also of following their katagenetic evolution.
The micro-oil study in mud volcanoes ejecta has been performed using the techniques of differential scanning colorimetry (DSC) andthermogravimetry (TG).
Geochemicalstudyresults
The modified Van-Krevelen diagram (Fig. 3а) enabled a classification of the kerogen type in samples:
The Pliocene and Miocene sediments are dominated by the type III kerogen(mostly mud volcanoes of the Absheron Peninsula);
The Oligocene and Eocene sediments are dominated by the type II and III kerogen(mostly mud volcanoes of the Shamakhy-Godustan area); in several Oligocene samples was discovered type I kerogen;
The Jurassic sediments are dominated by the type III kerogen(mostly mud volcanoes of the Caucasus Major);
In the Cretaceous sedimentsthe OMis represented by type IV kerogen and is positioned in the non-generative area (mostly mud volcanoes of the Caucasus Major).
Low oxygen index values (less than 30 mg CO2/g of TOC) in most samples indicates the low extent of oxidizing.
A dual diagram of HI and Tmax (Fig. 3b) shows that the samples capable of generating hydrocarbons have Tmax 435-4680C.
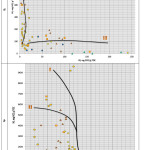 |
Figure 3: Modified Van-Krevelen diagrams: hydrogen index HI vs. oxygen index ОI (а) hydrogen index HI vs. maximum pyrolysis temperature Tmax (b)
|
According to J. Espitalier and К. Peters [2-4], reservoirs containing liquid oil or high concentrations of mobile bitumoid have anomalously low pyrolysis temperatures Тmах.
In the correlation diagram Tmax vs. PI (Fig. 4а) the points belonging to samples of different age and stage of the OM thermal maturity (regarding the capability of the oil and gas generation), are distributed by their stratigraphic association:
The Pliocene sediments in the 436-444°C area – early maturity stage;
The Miocene sediments in the 440-458°C area – between the peak of oil generation and the late maturity stage;
The Oligocene sediments in the 416-438°C area – the early maturity stage;
The Eocene sediments in the 432-440°C area – the early maturity stage;
The Cretaceous sediments in the 434-443°C area – the early maturity stage;
The Jurassic sediments around 410-445°C – between immature and the early maturation stage.
Overall, low Тmах values emphasized the migration nature of the bitumoid [5]. At the temperatures that low the extent of the OM katagenetic maturity is quite low. Despite an insignificant OM maturity extent it is possible that the hydrocarbon generation is already occurring. It is supported by the elevated content of S1 in the samples. For mature samples of the Miocene sediments in the value range of the pyrolytic parameter Tmax – 440-458ºС, the OM katagenetic permutation corresponds with the middle and completing stage of the «oil window» MK2-MK3. This is also supported by an increase of the productivity index up to 0.44.
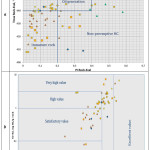 |
Figure 4: CorrelationTmaxvs. PI (а) and (S1 + S2 )vs. TOC (b).
|
The correlation diagram of the total (oil and kerogen) potential (S1+S2) vs. TOC (Fig.4b) demonstrates wide variability. By the stratigraphic association are identified:
The Pliocene sediments withvery high and outstanding generative potential;
The Miocene and Oligocene with the generative potential satisfactory to very high;
The Eocene sediments with mostly satisfactory generative potential;
The Cretaceous sediments with low generative properties (both according to S1+S2 and Сorg);
The Jurassic sediments withwidely variable generative properties between satisfactory to very high.
The study of micro-oil in mud volcano ejecta showed that most oil-saturated were ejecta from mud volcanoes Lokbatan, Chapylmysh and Gushchu. Their samples contained 3.6, 2.5 and 3.14% of oil respectively. The differential scanning colorimetry(DSC) and thermo-gravimetry curves of the samples are shown in Fig. 5.
At calculations were accepted the following ranges of component oxidation: light lubricant 300-360°C, medium 360-390°C, heavy 390-425°C, resins 425-510°C, asphaltens 510-660°C. The chemical composition and class of studied oils is included in Table 1.
The micro-oil from the Lokbatan mud volcano ejecta includes 20% of distillate, possibly kerosene-gasoil fraction; 22% of light lubricant; 15% of medium and 13% heavy; 20% resins and 10% of asphaltens. The micro-oil chemical composition is heavy (D=20%), naphtene –aromatic due to a high content of lubricant (50%) and resin-asphalten (30%) components. Therefore, the oil is weakly altered (a young geologic age).
The micro-oil from the Chapylmysh mud volcano ejecta is similar in its chemical composition with the oil from the Lokbatan mud volcano ejecta but is heavier, more naphtene due to lover content of the distillate fraction (D=11%) and elevated content of the lubricant fraction (М1=33%). Similarity of oils is supported by their differential scanning colorimetry curves with practically identical oxidation profiles.
The micro-oil from the Gushchu mud volcano ejecta is notably different in its chemical composition from the oils in Lokbatan and Chapylmysh mud volcano ejecta. It includes sharply elevated fraction of the resin component (34%) at the expense of a decreased lubricant component (27%) with low content of the distillate portion (26%). The oil is aromatically based, the heaviest from all studied, weakly altered (young).
At studies of micro-oil from mud volcanoes ejecta first of all should have been established the oil nature based on its localization in the rock – whether it was syngenetic with the rock or allochthonous, epigenetic (migrated). For this, it was necessary to know if the rock contains kerogen (residual organic matter), the oil producer.
The laboratory study of the Lokbatan, Chapylmysh and Gushchu mud volcanosejecta showed that they did not include the kerogen, i.e., residual organic matter. That suggests the emigration nature of the oils. In such a case, a heavy nature of the oils in these ejecta might have been caused by the chromatographic effect of oil separation into the fraction in the process of the oil flow advance from the high-pressure zone toward the lower one, usually from the bottom up. As the flow was advancing, the oil was enriching with light components due to adsorption phenomena at passing through rocks and different speed of hydrocarbon components advancing, and its tail portion, with heavy components (resins and asphaltens).
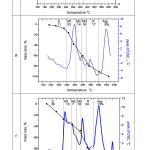 |
Figure 5: The differential scanning colorimetry and thermo-gravimetry curves of Lokbatan-1 (a), Chapylmysh-19 (b) and Gushchu-25 (c) mud volcanoes ejecta. (In the upper part of the Figure ares component symbols: D – distillate; М1, М2 and М3 – light, medium and heavy lubricant fractions; R – resin, Asp – asphaltens). |
Table 1: Chemical composition, % mass and class of oils from mud volcano ejecta
|
Sample from mud volcano |
Distillate |
Light lubricant М1 |
Medium lubricant М2 |
Heavy lubricant М3 |
Resins R |
Asphaltens Asp |
Oil class |
|
Lokbatan |
20 |
22 |
15 |
13 |
20 |
10 |
Naphtene-aromatic |
|
Chapylmysh |
11 |
33 |
14 |
16 |
17 |
9 |
Naphtene-aromatic |
|
Gushchu |
26 |
10 |
7 |
10 |
34 |
13 |
Aromatic |
Specifics of Hydrocarbon Generation in the South-Caspian Basin
It was established [7-10] that for conversion of the organic matter in oil are important the position of the oil and gas window, deposition and basin subsidence rates. Deposition of the sediment cover had various rates associated with the basin subsidence tempo and the volume of the sediment fill.
The effect of subsidence and deposition rates on the kinetics of hydrocarbon generation processes is demonstrated on an example of the South-Caspian Depression. The Depression is marked by high and super-high deposition rate, which was identified as a result of the subsidence history modeling. According to the generalized depositional model of the South-Caspian Depression (Fig. 6), the following picture of the basin subsidence was identified:
During Middle-Late Jurassic, 50-60 m / Ma;
During the Cretaceous period, 10-20 m / Ma;
By the beginning of Oligocene, 5-8 m / Ma;
During Oligocene – Early Miocene, 30-40 m / Ma;
During Pliocene the rate of tectonic subsidence exceeded 2,000 m/ Ma.
A great thickness of the sedimentary complex deposited in particular during Pliocene – Quaternary (5.3 Ma) were associated with a lowered erosion base level of the basin, stable subsidence, high deposition rate and also with the activity of Paleo-Volga, Paleo-Kura, Paleo-Uzboy and Paleo-Amu-Darya, i.e., with the input of a huge sedimentary volume of its fill-up. The stated conditions of basin evolution quite seriously affected the physicochemical rate of hydrocarbon generation processes in the South-Caspian Basin.
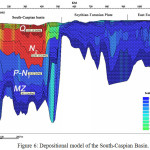 |
Figure 6: Depositional model of the South-Caspian Basin. |
The depositional model of the South-Caspian Basin and the obtained geochemical parameters of the mud volcano ejecta enabled plotting correlation diagrams of TOC vs. rate of deposition and correlation diagrams of the generative potential by sediments vs. deposition rate (Fig. 7). Averaged values for the stratigraphic complexes have been used [11-13].
The Middle-Late Jurassic sediments with the deposition at a rate 50-60 m / Ma and the Cretaceous sediments with the deposition at a rate 10-20 m / Ma have both low TOC values and low generative potential. From Oligocene to Miocene was occurring a gradual increase of both parameters. In Pliocene, the inverse correlation is noted: the deposition rate reached 2,000 m / Ma and values of the generative potential substantially declined. The reason for that was a super-avalanche deposition decreasing both the heat flow at the surface and geothermal gradient, an also the heat-blocking effect by underlying clayey sequences of the Productive Series. A result was the expanded interval of oil-gas generation (for the most subsided portion of the South-Caspian Basin the zone of oil-gas generation has the upper boundary at 10 km and the lower one at 18-20 km) and a decline in the generative potential.
The future study of physicochemical rates of the organic matter conversion in hydrocarbons will provide an opportunity to derive quantitative parameters of oil and gas generation in the study region.
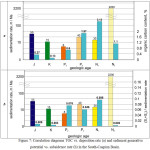 |
Figure 7: Correlation diagrams TOC vs. deposition rate (а) and sediment generative potential vs. subsidence rate (b) in the South-Caspian Basin.
|
Conclusions
Pyrolytic study of 69 rock samples from 22 mud volcano ejecta in the Apsheron Peninsula, which describe the entire stratigraphic section of the South-Caspian Basin, suggested the following conclusions:
The South-Caspian basin is a polyfocal basin. Within it are identified several stratigraphically separated autonomous generation foci: Aalenian-Bajocian (Middle Jurassic), Valanginian (Lower Cretaceous), Laleogene-Lower Miocene (mostly Oligocene-Lowe Miocene, i.e., Maykopian), Diatomaceous (Middle-Upper Miocene) and Kalin (lower part of the Lower Pliocene, i.e., Productive Series PT).
Kerogen types in various stratigraphic intervals were established, organic matter thermal maturity stages were determined and the source rock generative potential was correlated with he total organic carbon content.
Correlation of the generative potential vs. depositional rate and subsidence rate of the basin was established for the South-Caspian Basin. The study of the rate of the organic matter conversion in hydrocarbons enables the estimation of oil and gas generation quantitative parameters at great depths.
At great depths, in the zones of high pressure and temperature, are maintained all conditions for the processes of oil and gas-generation. The quantitative analysis of the oil formation is based on the chemical kinetics for the primary kerogen cracking and secondary oil cracking. Different katagenesis zone thicknesses are due to the hydrocarbon generation kinetics, which depends on the kerogen type, temperature gradient, pressure, lithologic composition and hydrogeological environment of the host sequences, deposition rate, etc. In regions with a thick sediment cover, and especially with substantial rat6e of deposition and basin bottom subsidence the lower oil-gas window boundary is significantly lowered, to 7 – 9 km and deeper.
References
- Guliev, I.; Panahi, B. Geo-Marine Letters, 2004, 24 (3), 169-176.
CrossRef - Espitali, J.; Durand, B.; Roussel, J. C.; Souron, C. Rev. Inst. Fr. Pétr., 1973, 28, 1, 37-66
- Peters,K.E.. AAPG Bulletin, 1986, 70, 3, 318.
- Kerimov, V.Yu.; Lapidus, A.L.; Yandarbiev, N.Sh.; Movsumzade, E.M.; Mustaev, R.N. Solid Fuel Chemistry, 2017, 51(2), 122-130.
CrossRef - Guliev, I.S.; Feizullayev, A.A. AAPG Memoir, 1996, 66, 63-70.
- Kerimov,V.Yu.;Shilov,G.Ya.;Mustaev, R.N.;Dmitrievskiy, S.S. NeftyanoeKhozyaystvo, 2016, 2, 8-11.
- Kerimov,V.Yu.;Mustaev, R.N.;Senin, B.V.;Lavrenova, E.A. NeftyanoeKhozyaystvo, 2015, 4, 26-29.
- Guliev, I.S.; KerimovV.Yu.; Mustaev, R.N. Doklady Earth Sciences, 2016, 471, 1, 1109–1112.
CrossRef - Kerimov,V.Yu.;Mustaev, R.N.; Bondarev, A.V. Oriental Journal of Chemistry,2016, 32, 6, 3235-3241.
- Kerimov, V.Yu., Serikova, U.S., Mustayev, R.N., Guliyev, I.SNeftyanoekhozyaystvo, 2014,5, 50-54.
- Mustaev, R.N.; Kerimov, V.Y.; Shilov, G.Y.; Dmitrievsky, S.S. 18th Science and Applied Research Conference on Oil and Gas Geological Exploration and Development, GEOMODEL, 2016.
- Pelet, R. Rev. d’InstitutFrancais du Pétrole, 1985, 40, 5, 551-556.
- Kerimov,V.Yu.;Mustaev, R.N.;Dmitrievsky, S.S.;Yandarbiev,N.Sh.;Kozlova, E.V. NeftyanoeKhozyaystvo, 2015, 10, 50-53.

This work is licensed under a Creative Commons Attribution 4.0 International License.
![]()
A New Edition of Web of Science
Journal Impact Factor
2022: 0.5
Five Year: 0.8
Journal is Indexed in

Cabells Whitelist
![]()


