Effect of MgO-SiO2 Ratio on the Forsterite (Mg2SiO4) Precursors Characteristics Derived from Amorphous Rice Husk Silica
1Department of Physics, University of Lampung, Indonesia.
2Department of Chemistry, University of Lampung, Indonesia.
Corresponding Author E-mail: simon.sembiring@fmipa.unila.ac.id
DOI : http://dx.doi.org/10.13005/ojc/330427
Download this article as:
![]()
This study acquires the potential of rice husk silica for production forsterite precursors using sol-gel method. The samples preparation were conducted by mixing magnesium oxide sol from Mg(NO3)2.6.12H2O with silica sol extracted from rice husk, with three different composition ratios of MgO to SiO2 are 1:1, 2:3 and 3:2 by weight and sintered at 900oC. The samples were characterized using Fourier transform infrared (FTIR) spectroscopy, x-ray diffraction (XRD),differential thermal analysis (DTA), followed by scanning electron microscopy (SEM). The FTIR results showed the presence of Si-O-Si, Mg-O and Mg-O-Si functional groups, which were associated with forsterite, enstatite, cristobalite and periclase, according to the XRD analysis. The formation of forsterite (Mg2SiO4) is composition-dependent as revealed the increase of forsterite intensity after sintered at 900oC in ratio 3:2. The surface morphology of non-sintered samples shows that particle and grain size were larger than particle and grain size of sintered samples. Also, SEM analysis of sintered samples clearly shows the presence of regular particle size with smaller grain size was found in ratio of MgO to SiO2 is 3:2. DTA analysis revealed that the formation of forsterite increased with increasing temperature. In addition, the electrical resistivities of the samples were found in the range of 0.75 x 10¹³ to 3.30 x 10¹³W-cm, demonstrating that the samples exhibit good potential as isolator.
KEYWORDS:Forsterite; rice husk; sintering; structure; microstructure
Introduction
Forsterite is a crystalline magnesium silicate ceramic with chemical formula Mg2SiO4, which has a melting point at temperature around 1890oC, good electrical insulation with value of electrical resistivity is 1013-1015 Ωcm1, low thermal expansion, good chemical stability and excellent insulation properties even at high temperatures2, and makes its suitable for use in thermal insulation. In addition, forsterite has low dielectric constant e» 6.8, making this material suitable for dielectric component for wave communication3. It is also well known that the crystal structure of forsterite is orthorhombic with unit cell of a = 47540 nm; b = 101971 nm; c = 59806 nm, and space group pbnm4, which could be regarded as consisting of SiO4 tetrahedral linked together by MgO6 octahedral5, but this MgO6 octahedral could be changed into MgO4 and MgO5 using thermal treatment. These structure changes reflect a change from glass phase into corner-shared tetrahedral mixture in which SiO4 and MgO4 are linked together by MgO5 polyhedral6. Structure and properties of forsterite ceramics are strongly dependent on the homogeneity, particle size distribution, phase purity of the initial powder, and preparation method.
Several different methods are widely recognized to produce forsterite ceramics. These methods include solid-state reaction7-12, wet reactions1,13and sol-gel14-17. The production of forsterite through the solid-state reaction usually requires high temperature and long reaction time, while the sol-gel process can promote molecule-level of mixing, results in high degree of homogeneity, which leads to reduced temperature and prevention of phase segregation during heating. However, the formation of a single phase forsterite, in the oxide systems MgO-SiO2 is difficult to obtain. It is always accompanied by secondary phases formation such as polymorphs of enstatite (MgSiO3), silica (SiO2) and/or periclase (MgO). This fact leads to the requirement of synthetic forsterite as one product of MgO-SiO2 system. In previous study, the presence of enstatite (MgSiO3) phase could be detrimental to the high temperature properties since enstatite dissociates into forsterite and silica-rich liquid at around 1557oC18. However, the quality of forsterite degrades substantially in the presence of glass impurity and high quality can be achieved when forsterite is synthesized from high purity raw materials19.For example, Kosanović, et al8 using powder mixtures of NH4-exchanged zeolite and MgO as starting materials reported that thermal treatment of the mixture above 900oC resulted small amount of minor phases and forsterite as a dominant phase. Several researches15,20, the use of a heat treatment, typically in the temperature range of 1000 to 1500 οC has been employed as part of the synthesis process to obtain phase pure forsterite.
According to the above obstacles, sol-gel method is expected to be an efficient method to increase the chemical homogeneity of the product and to reduce the reaction temperature, since this method allows the processing at lower temperatures and production of more homogeneous forsterite ceramics. However, in multi-components silicate system, hydrolysis and condensation rates are different with in silica and other alkoxides may cause non-uniform precipitation and that chemical inhomogeneity of the gel, leading to higher crystallization temperature8,21. As an example, by using magnesium nitrate hexahydrate and colloidal silica as raw materials, Fathi and Kharaziha13 found that nano-crystalline forsterite with the particle size of 17-20 nm could be produced using sol-gel method followed by sintering at 800oC, and Saberi et al1reported that initial formation of forsterite occurred at 760oC and complete formation of crystalline forsterite at 800oC.
In the context of ceramic material, one source of silica is rice husk ash as agriculture waste is known to contain silica in considerable amount, which could be extracted by relatively simple method to obtain high purity, and active silica. Several researches22-24reported that pure silica can be extracted with the purity in the range of 94-98% exists as amorphous and reactive. Many attempts have been made to utilize rice husk silica to produce various silica based materials, such as production of nanosilica25-26, zeolites27, silica aerogel28. In our previous investigations, several ceramic materials derived from rice husk silica reported in literatures are borosilicate29, carbosil30, aluminosilicate31, mullite32-33and cordierite34-35.
The present work investigates the preparation method of producing forsterite by using sol gel method and making use of biomaterial rice husk silica with relatively high purity product. The specific goal of this study is to evaluate the effect of different composition on the phase composition, microstructure, and electrical resistivity of forsterite synthesized. Characterization of the samples was carried out using FTIR, XRD, DTA and SEM. The electrical resistivity (ρ) of samples were measured using the four-point probe method.
Material and Methods
Preparation of Silica and Magnesium Sols
Preparation of silica sol was conducted following the procedures that have previously been applied29,35. In the first step, rice husk was washed with hot water to remove contaminants of water soluble organic matters present, and then dried in the room temperature. The dried husk (50 g) were stirred in 500 mL of 5% KOH solution. The mixture was boiled in a baker glass for 30 min. The mixture was allowed to cool to room temperature and left for 24 h. The mixture was filtered to separate the filtrate which contains silica (silica sol). Magnesium sol was prepared by dissolving 30 g of (Mg(NO3)2.6H2O into 100 mL ethanol in a beaker glass under magnetic stirring for 4 h.
Synthesis of for Sterite
To obtain the solid forsterite, calculated quantities of silica sol were added under stirring to the appropriate volume of magnesium sol to give the ratios of magnesium oxide and silica (MgO:SiO2) as a mass ratio of 1:1, 2:3 and 3:2. The mixture was heated at 90oC under continuous stirring to transform the sample (sol) into gel. The gel was aged for three days, rinsed repeatedly with deionised water to remove the excess of acid and alkali, and then oven dried at 110 oC for 6 h and grounded into powder with the size of 200 meshes. The powder was pressed in a metal die with the pressure of with the pressure of 2 x 10⁴ N/m2to produce cylindrical pellet, and then the pellet was sintered at 900 oC, using temperature programmed with a heating rate of 3 oC /min and holding time of 4 hours at peak temperatures.
Characterization of Forsterite
Functional Group Analysis
A Perkin Elmer Fourier Transform lnfrared (FTIR) Spectrometer was used to study the functional group of the forsterite. For measurement, sample was prepared by grinding together approximately two mg of forsterite powder with 300 mg potassium bromide (KBr) in a mortar, and the mixture was pressed to obtain a KBr pellet. The FTIR spectrum was generated by scanning the sample over the wave number range of 4000 to 400 cm-1 at a resolution of 4 cm-1.
X-Ray Diffraction Analysis
The XRD pattern was collected using an automated Shimadzu XD-610 X-ray diffractometer with Cuka (radiation (l= 0.15418 Å, produced at 40 kV and 30 mA). The diffractogram was recorded over the goniometry (20) ranging from 5-75. with step size of 0.02 and counting tirne of 1 sec/step, and post-diffraction graphite monochromator with Nal detector.
Differential Thermal Analysis
Differential thermal analysis (DTA) was carried out using DTA Merck Setaram Tag 24 S. The thermogram was produced by scanning the sample at temperature range of 30 to 1000oC.
Scanning Electron Microscopy Analysis
Scanning electron microscopy (SEM) (Philips-XL) was used to analyse the shape of developed microstructure of forsterite. Samples were prepared by thermally etched at temperature of 1000oC.
Electrical Measurement
The electrical measurements were measured by a four-point probe method.
Results and Discussion
Functional Group of Synthesized Forsterite
FTIR spectra of non sintered and sintered samples at 900 ºC with different ratios of MgO to SiO2 are shown in Fig. 1a and 1b, respectively.
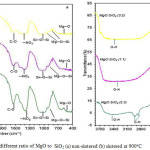 |
Figure 1: FTIR Spectra of the samples with different ratio of MgO to SiO2 (a) non-sintered (b) sintered at 900oC |
FTIR was conducted to follow the dehydration reaction of sample and the formation of Mg-O-Si bands. The results show the same functional groups for all samples. As shown in Fig 1(a-b), the most obvious peak is located at around 3436 cm-1, which is commonly assigned to stretching vibration of O-H bond. This absorption band is most likely arises from O-H bond of silanol group in Si(OH)4, Mg(OH)2 and trapped water molecules36. The presence of Si(OH)4 is supported by the existence of absorption band at 1083 cm-1, which is commonly assigned to stretching vibration of Si-O-Si, and the band at 559 cm-1, which is assigned to Si-O bond14.Anotherstrongbandobservedislocatedat1388cm-1, which is probably thecharacteristicstretchingvibrationoftheentrapped nitrate ions from (Mg(NO3)2.6H2O. The peaks at 1000, 842, 616, 505, 462 and 429 cm–1 belong to forsterite since peaks at 892, 718, 530 cm–1 are related to other phases. The peaks around 1000 cm–1 are assigned to Si-O stretching modes and those around 500 cm–1 to Mg-O stretching or Si-O bending modes. According to the previous report15, the bands located at 683 and 473 cm-1 are commonly assigned to vibration of Mg-O, and those at 917 and 993 cm-1signify the Mg-O-Si vibration36.The band related to the typical peaks of forsterite appear in the range of 830-1000 cm-1 (SiO4– stretching), at 500-620 cm-1 (SiO4 bending) and at 475 cm-1 for modes octahedral MgO6. In all of spectra (Fig. 1a-b), small peaks were observed at around 2396, and 1642 cm-1, which are commonly assigned to vibration of C=O and C-O bond37, probably originated from the residue of natural organic components of the husk and fromatmosphericCO2absorbed by the samples. Ascanbeseeninthesamplestreatedat 900oC,thepeak is decreased, suggesting that at this temperature, the bound CO was driven off from the sample.
Structural Characteristics of Synthesized Forsterite
Figure 2a-b shows the spectra of non-sintered and sintered samples at 900oC with different ratio of MgO to SiO2, respectively.
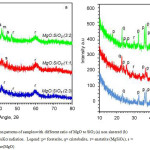 |
Figure 2: X-ray diffraction patterns of sampleswith different ratio of MgO to SiO2 (a) non sintered (b) sintered at 900oCusing CuKa radiation. Legend: p= forsterite, q= cristobalite, r= enstatite (MgSiO3), s = Silica(SiO2), m = periclase(MgO) |
Qualitative XRD was conducted by comparing the diffraction lines with those in the standard PCPDF files using search-match method38.According to this method, the phases identified in the non-sintered samples (Figure 2a)show the presence of enstatite/MgSiO3 (PDF-11-0273), with the most intense peak at 2q = 28.2º, silica/SiO2 (PDF-47-0715) at 2q = 23.8º, and periclase/MgO (PDF-45-0946),at 2q = 42.9º.For the non sintered samples (Fig. 2a) with different ratio of MgO to SiO2 show the formation enstatite increase with increasing MgO. It seems that at the initial stage, the magnesium nitrate hydrate must have reacted with silica (SiO2) to produce enstatite (MgSiO3) as described in equation 1. The features of the non sintered samples also indicate that some of the silica remains intact as demonstrated by the existenceof SiO2 phase and enstatite. For the sintered samples (Fig 2b) reveal the formation of forsterite, suggested that diffusion of MgO takes place through the enstatite, forming the forsterite phase as described in equation 2, as previously reported by others20,while the existence ofpericlase is most likely due to oxidation of magnesium.
(Mg(NO3)2.6H2O + SiO2 → Mg(NO3)2 + MgSiO3 + 6H2O (1)
MgO + MgSiO3 → Mg2SiO4 (2)
Comparison of the XRD patterns of the non sintered samples (Fig. 2a) to those of the sintered samples (Fig. 2b), very significant effect of sintering temperature is evidently observed. In the sintered samples at 900oC (Fig. 2b) present forsterite/Mg2SiO4 (PDF-34-0189), with the most intense peak at 2q =36.7o, and the secondary phases of cristobalite (PDF-39-1425) at 2q =21.98o, and periclase/MgO, while enstatite phase is vanished. For the sintered samples (Fig. 2b) with ratio of MgO to SiO2 are 2:3; 1:1 and 3:2 show the formation forsterite increase with increasing MgO. The presence of the secondary phases could be assigned to an incomplete reaction or insufficient homogeneity of the precursor mixtures.The cristobaliteis most likely formed as a result of rice husk silica crystallization during the thermal treatment, while the periclase originated from magnesium nitrate hexahydrate. The presence of secondary phases were also detected in the previous study by wahsh et al39and Rani et al40.In relation with the formation of forsterite in sintered samples, the XRD analyses clearly indicated that this phase has been produced at 900oC, and increased MgO was found to promote the formation of more forsterite (Fig. 2b), as reflected by enhanced intensity following the MgO, which agree with reactions presented above. The elimination of enstatite phase in the sintered samples confirmed that complete reaction of this phase with silica has occurred at the temperatures applied. Thermal treatment was found to lead to transformation of amorphous silica into cristobalite, which is in agreement with the nature of silica.
Thermal Characteristics of Synthesized Forsterite
The XRD analyses clearly indicated that existence of forsterite as expected, however this method provides no information regarding the mechanism of the formation of forsterite phase. Therefore, to gain some insights on how the process leading to forsterite formation took place, the samples were analysed using differential thermal analysis (DTA). Each of the sample was subjected to DTA in the temperature range of 50-1000oC, producing thermograms compiled in Figure 3.
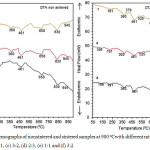 |
Figure 3: DTA Termographs of nonsintered and sintered samples at 900 oCwith different ratio of MgO to SiO2 (a) 2:3, (b) 1:1, (c) 3:2, (d) 2:3, (e) 1:1 and (f) 3:2 |
Fig. 3a-c shows DTA curves of non sintered with different ratio of MgO to SiO2 and Fig. 3d-f reveals DTA curves sintered samples at 900οC with different ratios of MgO to SiO2. As shown in Fig. 3a, non sintered sample with MgO ratio to SiO2 is 2:3, showing the existence of two endothermic peaks located at around 50-212, and 461-830oC. The peak in the range of 50-145οC is most likely due to the evaporation of water and residual organics probably present during the preparation of sample. The peak at around 191-212 οC could be assigned to the dehydration of silica and magnesium hydroxide, as supported by FTIR results and which is in agreement with the results of others36. The small endothermic peak at 461οC corresponds to amorphous phases and the endothermic peak at 658οC correspond to the talc hydroxylation and its transformation to enstatite, and endothermic peak at 830οC due to the crystallization of forsterite formation, as supported by previous study41-42. In the non sintered samples (Fig. 3b and c) it can be seen that the peak associated with evaporation of water is much smaller compared to that observed in the sample in Fig. 3a, suggesting that samples contain less water and are more dense. In addition, it is quite evident that phase transformation has taken place as indicated by increased peaks at 360, 461, 658οC, indicating that periclace, silica and enstatite have been produced. The forsterite peaks were seen at 830 and 945οC.Asdisplayedbythe thermograms of the sintered samples in Fig. 3d-f, it is quite different characteristics to those of the non sintered samples in Fig. 3a-c.It is evident that forsterite has been more clearly produced by increased peaks from 695 to 950οC.These temperature calcinations were also detected by Kamalian et al43.Based on the results of DTA, it can be concluded that thermal treatment plays an important role in facilitating the phase formation in the samples.
Microstructural Characteristics of Synthesized Forsterite
The surface morphologies of the non sintered and sintered samples at 900ºC with different ratio of MgO to SiO2 were characterized using SEM. Fig. 4(a-c) show the microstructure non sintered samples with different ratio of MgO to SiO2 are 2:3, 1:1 and 3:2, respectively. Fig. 4(d-f) present the microstructures sintered at 900ºC with different ratio of MgO to SiO2 are 2:3, 1:1 and 3:2, respectively.
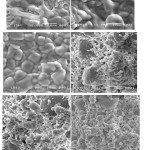 |
Figure 4: The scanning electron microscopy (SEM) images of non sintered samples with different ratio of MgO to SiO2, (a) 1:1, (b) 2:3, and (c) 3:2, andsinteredsamples at 900ºC, (d) 1:1, (e) 2:3, and (f) 3:2. |
As displayed by the images in Fig. 4(a-c), the surfaces morphologies of the samples are marked by the existence of particles with different grain sizes and distributions. The sample prepared at ratio 2:3 (Fig. 4a) is marked by large grains with less evident grain boundaries, compared to those observed for the other two samples (Fig. 4b-c).It is obvious that the clusters in the sample prepared at ratio 2:3 is surrounded by large grains. The large clusters are most likely composed of enstatite and silica. The surface of samples prepared at ratio (1:1 and 3:2) are dominated by large grains with clear evident grain boundaries composed of enstatite and distributed some small grains of silica.
Comparison of the surface morphologies of the non sintered samples (Fig. 4(a-c) to those of the sintered samples (Fig. 4d-f), very significant effect of sintering temperature is evidently observed. The micrographs presented in Fig. 4d-f demonstrate significant effect of sintering temperature on the size and distribution of the particles on the surface. As displayed by the images in Fig. 4d-f, the surfaces morphologies of the samples are marked by the existence of particles with different grain sizes and distributions. The sintered sample prepared at ratio 2:3 (Fig. 3d) is marked by large and small grains with less evident grain boundaries, compared to those observed for the other two samples (Fig. 4e-f).It is clear that the grains in the sintered sample prepared at ratio 2:3 is surrounded by large and small grains. The large grains are most likely composed of forsterite, while the small grains are cristoballite. The surface of sintered samples prepared at ratio (1:1 and 3:2) are dominated by large grains with clear evident grain boundaries composed of forsterite and distributed some small grains of cristobalite.
Electrical Characteristics of Synthesized Forsterite
Another important finding of this study is the effect of sintering temperatures on the electrical resistivities of the samples, as presented in Table 1.
Table 1: Electrical resistivity of the samples with ratio of MgO to SiO2is 3:2at different sintering temperatures.Estimated errors for the least significant digits are given in Parentheses.
|
Sintering Temperature (oC) |
Resistivity, r(x1013W-cm |
|
Non sintering |
0.75±0.04 |
|
1000 |
0.85±0.06 |
|
1100 |
1.07±0.05 |
|
1200 |
2.16±0.03 |
|
1300 |
3.30±0.06 |
Electrical resistivity of the samples was found to increase with increasing temperatures, in which the resistivities of the non sintered sample and the samples sintered at 1000 to 1300oC are ranging from 0.75 x 10¹³ to 3.30 x 10¹³W-cm. In general, the samples can be considered as isolator since the resistivities of isolators normally range from 1010 to 1020W-cm44.
Conclusions
The synthesis and characterisation of forsterite precursors derived from rice husk silica have been successfully demonstrated. XRD result on the non sintered samples show the presence of enstantite, silica and periclase. Significant effects of MgO-SiO2 ratioand sintering temperatures on the formation of forsterite characteristics were well identified. In overall, the forsterite synthesized are electrical isolators, implying their potential to be used in devises requiring electrical insulation components.
Acknowledgements
The authors wish to thank and appreciate The Directorate of Higher Education, The Ministry of Research, Technology, and Higher Education, Republic of Indonesia for research funding provided through the Fundamental Research Grant Program, 2017, with contract: 610//UN26.21/KU/20017.
References
- Saberi A., Alinejad B., Negahdari Z., Kazemi F., Almasi A.,Mater. Res. Bull.2007, 42(4), 666-673.
CrossRef - Diesperova M.I., Bron V.A., Perepelitsyn V.A., Boriskova T.I., Alekseeva V.A., and Kelareva E.I. Refrac. Indus. Ceram.1997, 18, 278-282.
CrossRef - SasikalaT.S., Suma M.N., Mohanan P., Pavithran,C., Sebastian M.T.,Alloys and Compounds.2008, 461(1-2),555-559.
CrossRef - Mineral Data Publishing.2001, Version 1.2.
- Hazen, R.M. Am. Mineral.1976, 61, 1280-1293.
- Wilding, M.C., Benmore, C. J., Tangeman J. A., and Sampath, S. Europhys. Lett.2004, 67(2), 10286-10288.
- Kiss S. J., Kostic E., Djurovic, D., Boskovic S. Powder Tech.2001, 114, 84- 88.
CrossRef - Kosanović C., Stubičar N., Tomašić N., Bermanec V., StubičarM. Alloys and Compounds.2005, 389(1–2), 306- 309.
CrossRef - Sano S., Saito N., Matsuda S., Ohashi N., Haneda H., Arita Y., Takemoto M. Am. Ceram. Soc. 2006, 89, 568-574.
CrossRef - Tavangarian F., Emadi R., and Shafyei A. Powder Tech.2010, 198(3),412-416.
CrossRef - Ghomi H., Jaberzadeh M., Fathi M.H. Alloys and Compounds. 2011, 509(5), 63- 68.
CrossRef - Emadi R., Tavangarian F., Foroushani, R.Z., Ghola mrezaie A. Ceram. Process. Res.2011, 12, 538- 543.
- Fathi M.H., and Kharaziha M. Mater. Lett.2009, 63(17), 1455-,1458.
- Tsai, M.T. Eur. Ceram. Soc.2002, 22, 1085- 1094.
CrossRef - Ni S., Chou L., Chiang J. Ceram. Int.2007, 33, 83- 88.
CrossRef - Kazakos A., Komarneni S., Roy R. Mater. Lett. 1990, 9 (10), 405-409.
CrossRef - Hassanzadeh-Tabrizi S.A. Ceram. Proc. Res.2014, 15(4), 207- 211.
- Mitchell M.B.D., Jackson D., James P.F. Sol-Gel Sci.Technol.1999, 15, 211- 219.
- Ohsato H., Tsunooka T., Sugiyama T., Kakimoto K., Ogawa H. Electroceram.2006, 17, 445- 450.
CrossRef - Tavangarian F., and Emadi R. Ceram. Silikaty.2010,54 (2), 122-127.
- Tsai, M.T. Eur. Ceram. Soc.2001, 23(8), 1283- 1291.
CrossRef - Haslinawati M.M., Matori K.A., Wahab Z.A., Sidek H.A.A., Zainal A.T. Int. Basic & Appl. Sci.2009, 09(09), 22- 25.
- Rafiee1 E., Shahebrahimi S., Feyzi1 M., and Shaterzadeh M. Int. Nano Lett.2012, 2(29), (2012), 1-8.
- Ugheoke B.I. and Mamat O. Int. Mater. Eng. Innovac.2012, 3(2), 139-155.
CrossRef - Amutha K., Ravibaskar R., and. Sivakumar, G. Int. nano Technol. and Appl.2010, 4(1), 61- 66.
- Liou T.H., and Yang C.C. Mat. Sci. Eng.2011, B 176, 521-529.
- Kordatos K., Gavela S., Ntziouni A., Pistiolas K.N., Kyritsi A. and Kasselouri-Rigopoulou V. Micro.and Meso. Mater.2008, 115(1-2), 189- 196.
- Nayak J. P., and Bera J. Trans. Ind. Ceram. Soc.2009,68,1-4.
CrossRef - Sembiring S. Indo. J. Chem.2011,11(1), 85- 89.
- Simanjuntak, W., Sembiring S., and Sebayang K. Indo. J. Chem.2012,12(1), 119-125.
- Simanjuntak W., Sembiring S., Manurung P., Situmeang R., and Low I.M. Ceram. Int.2013,39(8), 9369- 9375.
CrossRef - Sembiring S., and Simanjuntak W. Makara J. Sci.2012,16 (2), 77- 82.
- Sembiring S., Simanjuntak W., Manurung P., Asmi, D. and Low I.M. Ceram. Int.2014, 40(5), 7067-7072.
CrossRef - Simanjuntak W., and Sembiring S. Makara J. Sci.2011, 15(1), 97-100.
- Sembiring S., Simanjuntak W., Situmeang R., Riyanto A. and Sebayang K. Ceram. Int.2016, 42(7), 8431-8437.
CrossRef - Kharaziha M., and Fathi M.M. Ceram. Int.2009,35, 2449- 2454.
CrossRef - Adam F., Chua J.H. Coll. Interf. Sci.2014,280(1), 55-61.
CrossRef - Powder Diffraction File (Type PDF-2). Diffraction Data for XRD Identification. International Centre for Diffraction Data,PA, USA, 1997.
- Rani A.B., Annamalai A.R., Majhi M.R., and Kumar A.H. Inter. Chem. Tech. Res. CODEN( USA).2014,6(2), 1390- 1397.
- Wahsh M.M.S., Othman A.G.M., Abd El-Aleem S. Indus. and Eng. Chem.2014, 20(6), 3984-3988.
CrossRef - Mitchell M.B.D., Jackson D., James P.F. Sol-Gel Sci.Technol.1998, 13, 359-364.
- Park D.G., Martin M.H.E., Ober C.K., Burlitch J.M., Calvin O.B., Porter W.D., and Hubbard C.R. Am. Ceram. Soc.1994, 77(1),33-40.
CrossRef - Kamalian R., Yazdanpanah A., Moztarzadeh F., Mozafar M., Ravarian R., and Moztarzadeh Z. Ceram. Slikaty.2012, 56(4), 331–340
- Kingrey, W.D., Bowen H.K., D.R. Uhlmann D.R. Introduction to Ceramics, Jhon Wiley & Sons, 1976, 847-851


ISSN Online: 2231-5039

![]()


