Characteristics of Nano-Size Lacro3 prepared Through Sol-Gel Route using Pectin as Emulsifying Agent
Rudy Situmeang1, R. Supryanto1, Lolita N. Albert Kahar1, Wasinton Simanjuntak1 and Simon Sembiring2
1Department of Chemistry, University of Lampung, Indonesia.
2Department of Physics, University of Lampung, Indonesia Jln. Prof. Soemantri Brodjonegoro No 1 Bandar Lampung 35145.
Corresponding Author E-mail: rudy.tahan@fmipa.unila.ac.id
DOI : http://dx.doi.org/10.13005/ojc/330415
In this study, nano-sizeLaCrO3 was prepared through sol-gel route using pectin as emulsifying agent, followed by freeze – drying to obtain solid sample. The sample was prepared by mixing the solution of La(NO3)3.6 H2O and Cr(NO3)3.9 H2O with pectin solution under magnetic stirring. The sample was frozen and subsequently subjected to freeze – drying and calcination treatment at temperatures of 600, 700 and 800 ºC for 6 h. The calcined samples were characterized with several techniques. The phase composition was evaluated using the X-ray diffraction (XRD) technique, followed by crystallite size calculation using Scherrer Methods. The functionality of sample was identified using Fourier transform infrared(FTIR) spectroscopy, surface structurein three dimensional images was analyzed using Transmission electron microscopy (TEM), and particle size distribution was determined by Particles Size Distribution (PSA). The results of XRD characterization indicated that materials consist of various crystalline phases, with LaCrO3 as a major phase. FTIR Analysis revealed the existence of both Lewis and BrØnsted – Lowry acid sites, with Lewis acid as the prominent sites, represented by the absorption band located at around 1636 cm-1. The samples were found to display relatively homogeneous surface morphology, having the crystallite size in the range of 24 to 25 nm according to Scherrer equation.The PSA analyses revealed increased relative percentages of nano-size portion in the sample from 22 to 89% as temperatures increased from 600 to 800 ºC, with the particle size in the range of 30 to 35 nm as seen by the TEM .
KEYWORDS:perovskite; sol-gel; freeze-drying; pectin; acid sites
Download this article as:| Copy the following to cite this article: Situmeang R, Supryanto R, Kahar L. N. A, Simanjuntak W, Sembiring S. Characteristics of Nano-Size Lacro3 prepared Through Sol-Gel Route using Pectin as Emulsifying Agent. Orient J Chem 2017;33(4). |
| Copy the following to cite this URL: Situmeang R, Supryanto R, Kahar L. N. A, Simanjuntak W, Sembiring S. Characteristics of Nano-Size Lacro3 prepared Through Sol-Gel Route using Pectin as Emulsifying Agent. Orient J Chem 2017;33(4). Available from: http://www.orientjchem.org/?p=34609 |
Introduction
Perovskite compounds, ABO3 ( where A = cation of alkali, alkaline earth,or lanthanide metal, and B = cation of transition metal) have unique chemical and physical properties such as oxidative, magnetic, conductive, refractive, luminiscent, and catalytic. With such interesting and valuable properties, these compounds have been used widely such as a component in electronic devices1 – 3, sensors 4 – 7, magnetic materials8, 9, photoluminiscence materials10 – 12, catalysts13 – 15, solid oxide fuel cells16 – 18, and photocatalysts19, 20.Perovskite structural material (ABO3) can be synthesized by mixing the oxide of lanthanide or third main group elements with the oxide of the transition elements. The cations can fit into both the A and B sites within the same crystalline structure. The simple ABO3 composition obeys the limits of the tolerance factor, t = 0.71(rA+ro)/(rB+ro)21 – 23. This t – value led to the formation of crystalline structures such as cubic, orthorombic, and hexagonal form.
Spinel lanthanum chromites (LaCrO3) is one of the perovskite materials that has been extensively studied due to its applicability as interconnector for solid oxide fuel cell (SOFC’s), high chemical stability, good electrical properties at high temperature24 – 26, and catalytic activity for total oxidation27, partial oxidation28, oxidative dehydrogenation29, and photocatalyst30. Perovskite compounds have been prepared using various methods such as hydrothermal19, 31, 32, precipitation16, 33, co-precipitation34, 35, auto-combustion 36, 37, and sol – gel38 – 40. Among the aforementioned preparation techniques, sol-gel method holds particular importance, since this method offers several advantages over the others. Sol-gel route involves the use of raw material in the form of solution, enabling the homogeneous mixing of the raw materials, therefore promotes the formation of homogeneous product. In addition, this method offers the opportunity to obtain nano-size material. This opportunity makes sol-gel method very attractive considering the superior physical and chemical properties of nano-size materials compared to their micro- and macro-size counterparts and continuous growing roles of nano-size materials in a wide range of modern technologies41 – 43.
Since sol-gel technique involves transformation of raw materials from dissolved state into solid state, the particle size of the solid product is highly determined by the gelation process as well as the transformation of the gel into solid. To obtain the product with the particle size in nano scale, the agglomeration of the particles during gel development and transformation of the gel into solid by thermal treatment should be carefully controlled. In an attempt to control the transformation of sol into gel phase, the sol-gel method has been modified by introduction of additional agent into reaction system. Several compounds that have been tested as modifying agents are citric acid44, 45, glycine nitrate46, and ammonium carbonate47. In general, it was reported that the use of modifier in sol-gel process resulted in better characteristics of solid products, compared to those of the products produced without modifier, such as more homogeneous surface, smaller particle size, and narrower particle size distribution.
Pectin as an emulsifying agent in catalyst preparation has been used because itacts as a bonding substance with supporting and stabilizing function and controls. For example, synthesis of nanospinel CoFe2O4 using orange albedo pectin abled to obtain the average grain size in the range of 50 nm48 and using combustion method obtained around 70 nm49. Therefore, there is another promising possibility to prepare catalysts due to its particle size consideration.
Taking the role of modifier and drying of the gel in determining the characteristics of the solid material obtained using sol-gel method, this study attempted to synthesize nano-size LaCrO3 using sol-gel method by combining the use of pectin as green dispersing agent and freeze-drying process for drying of the gel. Dry sample was subsequently calcined at 600, 700 and 800ºC, and then characterized using XRD and search-Match method for qualitative analysis of the phases formed, PSA technique to determine the particles size distribution, Scherrer method to calculate crystallite sizes, FTIR spectroscopy for acid site identification, and TEM to visualize three-dimensional image of the surface structure.
Material and Methods
The chemical used in this study, hydrates of lanthanum nitrate, hydrates of chromium nitrate, pyridine, and NH3 are reagents gradeobtained from Merck. Pectin used as an emulsifying agent was obtained from local market. The main equipments used in this study areFourier Transform Infrared (FTIR) spectrophotometer(Shimadzu Prestige-21), Transmission Electron Microscope (TEM, Philips-XL ), Philips X-ray diffractometer (XRD) model PW 1710 with Cu-Kα radiation, and Particle Size Analyzer (PSA) Fritsch Analysette-22.
Preparation of Nanosize Lacro3
Preparation of nanosize La CrO3 was conducted by dissolving specified mass of La (NO3)3. 9H2O, and Cr (NO3)3. 6H2O, respectively in 100 mL of pectin solution (4 g pectin). After mixing , the mixture was stirred until homogenous solution was obtained, and then freeze-dried. Dry samples were calcined to 600, 700 and 800ºC for 6 h, using temperature program with temperature increase of 2ºC min-1.Whilethe final temperature has been reached, the hydrogen gas was flown for one hour.
Characterization of Lacro3
X-Ray Diffractogram Analysis
X-ray powder diffraction pattern of the sample was recorded over goniometric (2q) ranges from 10 to 90° at a step 0.02º/sec and couting time 1s/step, and using post-diffraction graphite monochromator with NaI detector on a Philips diffractometer Model PW 1710 using Cu Karadiation (l = 0.15418 nm), produced at 40 kV and 30 mA with a 0.15º receiving slit. The phase identification was performed using search and match method by comparing the x-ray pattern of the sample to those of the standards in the ICCD-JCPD files. The particle size was determined using Scherrer method50.
Particle Size Distribution Analysis
Particle size distribution of the solid sample was analyzed using Dynamic Light Scattering(DLS) technique. The analysis was carried out using wet method with ethanol as dispersant. The sample was scanned over the particle size range of 0 – 25 mm51.
Acid Sites Analysis
After heating at 120ºC, sample was transferred into a crucible and placed in vacuumized desiccator. Pyridine was transferred into another crucible and placed in the desiccator to allow the vapor of the pyridine to contact with the sample. After 24 h, the sample was taken from desiccator and left on open air for 2 h to expel the physically adsorbed pyridine from the sample. Finally, the sample was analyzed using the FTIR spectroscopy. The analysis was conducted by grinding the sample with KBr of spectroscopy grade, and scanned over the wave number range of 4000–400 cm−152-55.
TEM Analysis
To evaluate the surface morphology, the samples were characterized using TEM. The analysis was conducted on polished and thermally etched samples with different magnifications52.
Results and Discussion
Structural Analysis
Materials that have been prepared were characterized using some instruments such as X – ray diffraction, (FTIR) spectroscopy, PSA, and TEMas explained as follow :
X-Ray Diffraction Analysis
The XRD patterns of the samples calcined at 600, 700 and 800ºC were collected and compiled in Fig. 1.
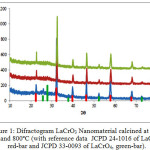 |
Figure 1: Difractogram LaCrO3 Nanomaterial calcined at 600, 700 and 800ºC (with reference data JCPD 24-1016 of LaCrO3, red-bar and JCPD 33-0093 of LaCrO4, green-bar). |
Analysis of the diffractogram of the sample calcined at 600ºC,using search and match method from ICCD data, revealed the existence LaCrO3 perovskite as a major phase and LaCrO4 huttonite as minor phase. The LaCrO3 perovskite phase is characterized by the most intense peaks at 2q = 32.34, 46.46 and 57.86º (JCPDF-24-1016), whilethe existence of LaCrO4huttonite is indicated by the small peaks at 2q = 25.68, 27.72 and 30º(JCPDF-33-0093). This pattern suggests that the reduction of LaCrO4 huttonite into LaCrO3perovskite was enhanced by hydrogen gas, resulted in lower crystallization temperature than that commonly reported, which is at least 700ºC 56 – 58. The significant role of hydrogen in promoting the formation of LaCrO3 perovskite phase was also supported by the XRD pattern of the sample calcined at 600ºC (Figure 1a), 700ºC (Figure 1b) and 800ºC (Figure 1c), in which the existence of LaCrO3 perovskite phase was clearly evident, and LaCrO4 huttonite was practically undetected as calcination temperature increased to 800ºC.
Scherrer Calculation
The crystallite sizes (DXRD) was determined using Scherrer equation. The calculation was based on the well-known Scherrer formula of 51:
![]()
Where D is the crystallite size (nm), k is a constant with the value in the range of 0.9–1.0 (in this calculation, k = 0.95), λ is the X-ray wavelength used, in this case, Cu-Kα = 0.15406 nm, β is the broadening of diffraction line measured at half maximum intensity,
![]()
(in radian), and q is the Bragg’s angle in degree unit. From Scherrer calculation based on the most intense of the representative peak, it was found that crystallite sizes of LaCrO3 calcined at 600, 700 and 800ºC were 24.84 , 24.12 and 27.09 nm, respectively. These resultsimply that there is a significant effect of the calcination temperatures applied on the crystallite size of the samples.
To evaluate the possibility of lattice distortion of LaCrO3 formed, microstrain (e) of the samples were calculated using the model proposed by Williamson and Hall59, with the mathematical equation of:
β (cos θ / λ) = DXRD + 4ε (sinθ/ λ)
where θ is the diffraction angle, λ is the wavelength of incident radiation and β is the full width at half maximum (FWHM) of the peak. By plotting the βcosθ/λ versus 4sin θ/λ , a straight line was obtained with 4ε as a slope. The calculation using this approach gave e = 1.2% and the average of crystallite size (DXRD) is of 24.84 nm for the sample calcined at 600ºC, while for the sample calcined at 700 and 800ºC, the value of e = 0.8 and 0.6% and the average of crystallite size (DXRD)are of 22.85 and 24.40 nm, respectively. From these microstrain data, it can be concluded that there was a local distortionreflecting the disorder present in the structure60.
Acidity Analysis
The FTIR spectra of the samples after being exposed to pyridine adsorption, in order to evaluate the presence of acid sites in the samples, are compiled in Figure 2. The presence of BrØnsted – Lowry acid site was evaluated based on the absorption bands associated with pyridium ion (C5H5NH+), while the presence of Lewisacid site was evaluated based on the absorption bands associated with pyridine (C5H5N:).
 |
Figure 2: infra red Spectra of LaCrO3 (a). calcined at 600ºC , (b). calcined at 700ºC, and (c) calcined at 800ºC. |
The presence of BrØnsted – Lowry acid site is indicated by the appearance of absorption band centered at 1384.36 cm-1in the spectrum of the sample calcined at 600ºC, and that centered at 1382.89 cm-1 in the spectrum of the sample calcined at 700ºC and centered at 1390 cm-1 in the spectrum of the sample calcined at 800oC. The presence of Lewis acid site is indicated by the absorption band centered at 1636.27, 1636.90 and 1637.45 cm-1 in the samples treated at 600, 700 and 800ºC, respectively. In term of relative intensity, the results obtained suggest that Lewis acid site is the prominent site in those samples and the sample calcined at 800ºC possess relatively the strongest acid properties based on the absorption energy.
In addition to information associated with acid site, the FTIR spectra also provide some information regarding the functional groups or bonds exist in the samples. The existence of Cr-O bond is indicated by the absorption bands located centered at 857.76 cm-1 for the sample calcined at 600ºC and that centered at 883.27 cm-1in the sample calcined at 700ºC, which were assigned to stretching vibration of the bond. These stretched vibrations are not coming from the pure O-Cr-O bondwhich is located at 783 cm-161, 62. The presence of this bond was also supported by the La-O-La absorption bands associated with bending vibration, located at around 617.77, 621.29, and 627.79 cm-1for sample calcined at 600, 700, and 800 ºC and a pure La-O-La stretching vibration located at 620 cm-163. Therefore, It can be implied that the La-O-Cr bond is existed.
Particle Size Analysis
Particle size distributionsof the samples as determined using PSA technique are presented in Figure 3.
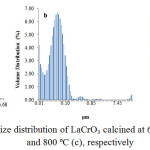 |
Figure 3: Particle size distribution of LaCrO3 calcined at 600ºC (a), 700ºC (b), and 800ºC (c), respectively |
The particle size distribution profiles shown in Figure 3 revealed that the particle sizes of the samples are quite different, in which the particle size of the sample calcined at 700ºC tends to be smaller than that of the sample calcined at 600ºC, demonstrating the significant effect of calcination temperatures on reducing the particle size of the sample. The results also display the existence of two and three groups of particle in the sample calcined at 600, 700 and 800ºC, respectively. More detailed inspection revealed that in the sample calcined at 600ºC, The first group, which is the main group, consists of particles with the size in the range of 0.00 to 0.13mm, and relative quantity of 31.19%. The second group consists of the particles with the size in the range of 0.13 to 1.25mm and relative quantity of 68.81%. In overall, 21.91% of this sample is composed of nano-size particles.
For the sample calcined at 700ºC, three groups of particles were observed. The first group, which is the main group, consists of particles with the size in the range of 0.00 to 0.15mm, and relative quantity of 89.79%. The second group which overlaps to some extent with the first group consist of the particles with the size in the range of 0.15 to 0.50mm and relative quantity of 5.61%. Then,the third group, separated considerably far from the other two, consists of particles with the size in the range of 17.73 to 37.86 mm with the relative quantity of 3.64%. In overall, 86.40% of this sample is composed of nano-size particles.
In the sample calcined at 800ºC, three group of particles were also observed. The first group, which is the main group, consists of particles with the size in the range of 0.00 to 0.21 mm and relative quantity of 95.8%. The second group which overlaps to some extent with the first group consists of particles with the size in the range of 0.21 to 0.55 mm and the relative quantity of 1.5%. Then,the third group, separated considerably far from the other two, consists of particles with the size in the range of 19.76 to 24.54 mm with the relative quantity of 2.48%. In overall 89.11% of this sample composed of nanosize particles. The results also indicate that the sample calcined at 700 and 800ºC is much richer in nano-size particles than the sample calcined at 600ºC, reflecting the significant role of the calcination temperatures in determining the size of the particles of the samples. In previous study64, the PSA method was applied to determine the particle size of LaCrO3 prepared using hydrothermal method, and reported that the average size of particles was 80 nm.
Transmission Electron Analysis
Characterization of the samples using TEM, produced the micrographs as shown in Figure 4. It displays evident agglomeration of the particles in both samples, and therefore, the existence of crystalline phase as a unit cell with firmed particle size and shape are hard to be identified. However, at certain areas, the presence of rhombohedral structure (pointed by blue arrow marked) can be observed, which confirms the existence of crystalline LaCrO3 phase.
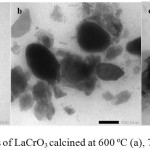 |
Figure 4: TEMmicrographs of LaCrO3 calcined at 600ºC (a), 700ºC (b), and 800ºC (c).
|
To predict the particle size, theVernier Caliper method was applied. According to this method, the particle size can be defined as the average of the size at five different spots. Using this method, it was found that the particle sizes of the sample calcined at 600 and 700ºC are 34.6 and 30 nm, respectively. The calculation results confirm the formation of nano size LaCrO3, in agreement with the results of PSA and XRD analyses, as discussed in previous parts. The particle sizes obtained using TEM in this study are significantly smaller than that of LaCrO3 prepared using sol-gel method reported by others65.
Conclusion
This current study demonstrated the potential of pectin solution as an emulsifying agent for preparing nano-size LaCrO3 material using sol-gel method. The existence of nano particles in the samples was confirmed by the results of characterization techniques applied, include XRD, PSA, and TEM, although particle agglomeration should also be acknowledged. The samples were found to exhibit Lewis and BrØnsted-Lowry acid characteristics, with Lewis acid as the dominant site, represented by the absorption band located at around 1636 cm-1 in the FTIR spectra . According to XRD results, the prime phase composing the samples is LaCrO3 phase. Relatively homogeneous surface morphology was exhibited by the samples, having the crystallite size in the range of 24 to 25 nm according to Scherrerequation.The PSA analyses revealed increased relative percentages of nano-size portion in the sample from 22 to 89% as temperatures increased from 600 to 800 ºC, with the particle size in the range of 30 to 35 nm as seen by the TEM .These characteristics imply that one of the potential use of the LaCrO3 prepared is as catalyst.
Acknowledgement
The authors wish to thank and appreciate The Research Institution of The University of Lampung for financial support through Decentralization of Research Grant of KEMENRISTEKDIKTI, with research contract No. 583/UN26.21/KU/2017.
References
- Chen, Q.; De Marco, N.; Yang, M.; Song, T.B. Chen, C.C., Zhao, H., Hong, Z., Zhou, H.; Yang,Y.Nano Today. 2015,10(3), 355 – 395. CrossRef
- Huang, L.K.; Xu, J.; Sun, X.; Du,Y.; Cai,H.; Ni,J.; Li, J.; Hu, Z.; Zhang,J.ACS Appl. Mater. 2016,Interfaces, 8 (15), 9811–9820.
- Mazet, L.; Yang, S. M.; Kalinin, S.V.; Schamm – Chardon, S.; Dubourdieu,C. Sci. Technol. Adv. Mater.2015,16,1 – 20.
- Moos, R.; Bektas, M.; Hanft, D.; Schönauer-Kamin, D.; Stöcker, T.; Hagen, G.J. Sens. Sens. Syst.2014,3, 223–229.
CrossRef - Josephine, B. A.; Jeseentharani, V.; Teresita, V. M.; George, M.; Antony, S. A. Sens. Trans.2013,156 (9), 304-309.
- Thuy, N. T.; Minh, D. L.; Giang, H. T.; Toan, N.N.Adv. Mater. Scie. Eng. 2014, 114, 1 – 5.
CrossRef - Giang, H. T.; Duy, H. T.; Ngan, P. Q.; Thai, G. H.; Thu, D. T. A.; Toan, N. N. Sens.Act. B: Chem.2011,158 (1), 246–251.
CrossRef - Belik, A. A. Sci. Technol. Adv. Mater. 2015,16, 21 – 28.
CrossRef - Asano, H.; Gotoh, H.; Matsushima, H.; Takeda, Y.; Zhong, J.; Rajanikanth, A.; Hono, K. J. Phys. : Conference Series 200/ 2010.
CrossRef - El-Sheikh , S.M.; Rashad, M.M.J. Alloys . Compd.2010,496 (1–2), 723–732.
CrossRef - Park, Nam-Gyu. Mater. Today. 2015, 18(2), 65–72
- Tiwari, N.; Kuraria, R.K.;Kuraria, S.R.; Tamrakar, R. K.J. Rad. Res. Appl. Sci., 2015,8(1), 68 – 76 .
- Situmeang, R.; Supriyanto, R.; Septanto, M.; Simanjuntak, W.; Sembiring, S.; Roger, A.C. Proc. Inter. Conf. Indones. Chem. Soc.2013,103 – 110
- Chawla, S. K.; Milka G.;Patel, F.; Patel,S. Proc. Eng.2013,51, 461 – 466.
CrossRef - Patel, F.; Patel , S.Proc. Eng. 2013 ,51, 324 – 329.
CrossRef - Chettapongsaphan, C.; Charojrochkul, S.; Assabumrungrat, S.; Laosiripojana,N.Asian J. Energy Environ.2008,9(1 – 2), 101-119.
- Kobsiriphat, W.; Madsen, B. D.; Wang, Y.; Shah, M.; Marks, L. D.; Barnett , S. A.J. Electrochem. Soc. 2010, 157 (2), B279-B284.
CrossRef - Cascos, V.; Alonso, J. A.; Fernández-Díaz, M. T. Materials.2016, 9, 579 – 591.
CrossRef - Shi, J .; Guo, L.Prog. Nat. Scie.2012,22(6), 592–615.
CrossRef - Prabhulkar, S.G.; Patil, R.M. Res. J. Mat. Sci.2013,1(9),1-9.
- Megha, U.; Shijina, K.; Varghese, G. Proc. Appl. Ceram.2014,8 (2), 87–92
CrossRef - Liu, X.C.; Hong, R.; Tian, C.J. Mater. Scie. : Mater. . Electron. 2008, 20 (4), 323–327.
CrossRef - Nagai T.; Ito W.; Sakon T. Solid Stat. Ion.2007,177, 3433.
CrossRef - Kumar, Y.; Regalado-Pérez, E.; Ayala, A. M.; Mathews, N.R.; Mathew, X.Solar Energ. Mater. Solar Cells, 2016,157, 10 – 17.
CrossRef - Rao, Y.;Wang, Z.; Chen, L.; Wu, R.; Peng, R.; Lu., Y.Int. J. Hydro. Energy.2013,38 , 14329.
CrossRef - Tiwari, B.; Dixit, A.; Naik, R.; Lawes, G.; Rao, M. S. R.Appl. Phys. Lett.2013, 103, 152906.
CrossRef - Zhang ,Z.; Kong,Z.; Liu, H.; Chen,Y.Front. Chem. Sci. Eng.2014,8 (1), 87-94.
CrossRef - Khine, M. S. S.; Chen, L.; Zhang , S.; Lin , J.; Jiang, S. P.;Inter. J. Hydro. Energy.2013,38, 13300 –13308.
CrossRef - Dinse, A.; Frank, B.; Hess, C.; Habel, D.; Schomäcker, R.J. Mol. Catal. A: Chemical.2008,289, 28 – 37.
CrossRef - Kanhere ,P.; Chen,Zhong. Mole. 2014, 19, 19995-20022.
CrossRef - Kang, M.; Yun,J.; Cho, C.; Kim, C.; Tai,W.Open J. Inorg. Non-Metal. Mat.2013,3, 37-42.\
- Rivas-Vázquez, L.P.;Rendón-Angeles , J.C.;Rodríguez-Galicia, J.L.;C.A.,Gutiérrez-Chavarria, K.J.;Yanagisawa, K.J. Eur. Ceram. Soc.2006,26 (1–2), 81–88.
CrossRef - Doggali, P.; Grasset, F.; Cador, O.; Rayalu, S.; Teraoka, Y.; Labhsetwar, N.J. Environ. Chem. Eng.2014, 2, 340
CrossRef - Kumar, S.; Teraoka, Y.; Joshi, A. G.; Rayalu, S.; Labhsetwar, N.J. Mol. Catal. A: Chem. 2011,348, 42
CrossRef - Yanping, W.; Junwu, Z.; Xiaojie, S.; Xujie, Y.; J. Rare Earths.2007,25, 601 – 610.
CrossRef - Corrêa, H. P. S.; Paiva-Santos, C. O.; Setz, L. F.; Martinez, L. G.; Mello-Castanho,S. R. H.; Orlando, M. T. D.Powder Diffraction Suppl. 2008,23 (2) , S18-S22.
CrossRef - Tong, Y .; Ma, J.; Zhao, S.; Huo, H.; Zhang, H.J. Nanomater.2015,115, 1 – 5.
CrossRef - Doggali P.; Rayalu S.; Teraoka Y.; Labhsetwar, N.J. Environ. Chem. Eng. 2015, 3, 420
CrossRef - Meng, M.; Guo, X.; Dai, F.; Li, Q.; Zhang, Z.; Jiang, Z.; Zhang, S.; Huangca, T.Y. Appl. Catal. B.2013,142–143, 278–289.
- Situmeang, R.; Manurung, P.; Sulistiyo, S. T.; Hadi, S.; Simanjuntak, W.; Sembiring, S.Asian J. Chem.2015,27(3), 1138 – 1142.
CrossRef - Girish, H.-N.; Shao, G.Q.; Basavalingu, B. RSC Adv. 2016,6, 79763 – 79767
CrossRef - Chen, W.; Chen, X.; Yang, Y.; Yuan, J.; Shangguan, W.Int. J. Hydro. Energy., 2014,39, 13468 – 13473.
CrossRef - López-Suárez, F E.; Bueno-López, A.; Illán-Gómez, M J.; Trawczynski, J.Appl. Catal. A.2014,485, 214 – 221.
CrossRef - Cornei, N.; Feraru, S.; Bulimestru, I.; Sandu, A.V.; Mita, C. Acta Chem. IAISI.2014,22(1), 1 – 12.
CrossRef - Chadli, I.; Omari, M.; Dalo, M. A.; Albiss, B. A.J. Sol-Gel Sci. Technol.2016,DOI 10.1007/s10971-016-4170-5.
CrossRef - Rivas-V´azqueza, L.P.; Rend´on-Angelesa, J.C.; Rodr´ıguez-Galiciaa,J.L.; Guti´errez-Chavarriaa, C.A.; Zhub, K.J.; Yanagisawa, K.J. Eur. Ceram. Soc.2006,26, 81–88
CrossRef - Zheng, J.; Lang, X.; Wang, C.Adv. Chem. Eng. Scie.2014, 4, 367 – 373.
CrossRef - Proveti, J. R. C.; Porto, P. S. S.; Muniz, E. P.; Pereira, R. D.; Araujo, D. R.; Silveira, M. B.J Sol-Gel Sci Technol.2015,75, 31-37.
CrossRef - Houshiar, M.; Zebhi, F.; Razi, Z. J.; Alidoust, A.; Askari, Z.J. Magn. Magn. Mater. 2014, 371, 43-48.
CrossRef - Wojnarowicz, J.; Mukhovskyi, R.; Pietrzykowska, E.; Kusnieruk, S.; Mizeracki, J.; Lojkowski, W. Beilstein J. Nanotechnol.2016,7, 721–732.
CrossRef - Rawle, A. “A Basic Guide to Particle Characterization”,Malvern Instrument Limited. Malaysia., 2012,1 – 8.
- Yazıcı.; D. Topaloğlu.; Bilgiç, C., Surf. Interfac. Anal.2010,42 (6), 959-962
- ASTM 4824 – 13, “Test method for Determination of catalyst acidity by pyridine chemisorption”,MNL 58-EB.2013.CrossRef
- Rashad, M.M.; El-Sheikh, S.M.Mat. Res. Bull. ??, 46(3), 469 – 477
- Situmeang, R.; Wibowo, S.; Simanjuntak, W.; Supryanto, R.; Amalia, R.; Septanto, M.; Manurung, P.; Sembiring, S.Indones. J. Chem.2015,15(2), 116 – 122.
- Rao, D. V. S.; Muraleedharan, K.; Humphreys, C. J. “Microscopy: Science,Technology, Applications and Education” Formetax, A. Méndez-Vilas and J. Díaz (Eds.).2010.
- Sathi R. N.; Purohit, R. D.; Tyagi, A. K.; Sinha, P. K.;Sharma, B. P.J. Am. Ceram. Soc.2008, 91, 88.
- Setz, L. F. G.; Mello-Castanho, S. R. H.; Moreno, R.; Colomer,M. T.Int. J. Appl. Ceram. Technol., 2009,6 (5) 626–635
CrossRef - Bushroa, A.R.; Rahbari, R.G.; Masjuki, H.H.; Muhamad, M.R. Vacuum.2012,86, 1107 – 1112.
CrossRef - Schäfer, N.; Chahine, G. A.; Wilkinson, A. J.; Schmid, T.; Rissom, T.; Schülli, T. U.; Abou-Ras,D.J. Appl. Cryst.2016,49,632-635.
CrossRef - Gupta, R. K.;Whang, C. M. J. Phys. : Condens. Matt.2007,19 (19), 196209.
CrossRef - Bonet, A.; Travitzky, N.; Greil, P.J. Ceram. Sci. Tech.2014,5(2), 93 – 100.
- Bikshalu, K.; Reddy, V.S.K.; Reddy, P.C.S.; Rao,K.V.IJEAR. 2014,4, 2348 – 0033.
- Kang, M.; Yun, J.; Cho, C.; Kim, C.; Tai, W. OJINM. 2013, 3, 37 – 42.
CrossRef - Rativa-Parada, W.; Gomez-Cuaspud, J.A.; Vera-Lopez, E.; Carda, J.B. 2017, 786, 012029.

This work is licensed under a Creative Commons Attribution 4.0 International License.
![]()
A New Edition of Web of Science
Journal Impact Factor
2022: 0.5
Five Year: 0.8
Journal is Indexed in

Cabells Whitelist
![]()


