Adsorptive Removal of Manganese (II) from Aqueous Solutionusing Graphene Oxide: A Kinetics and Thermodynamics Study
Anek Suddai, Prawit Nuengmatcha and Saksit Chanthai
Materials Chemistry Research Center, Department of Chemistry and Center of Excellence for Innovation in Chemistry, Faculty of Science, KhonKaen University, KhonKaen 40002, Thailand.
Corresponding Author E-mail: sakcha2@kku.ac.th
DOI : http://dx.doi.org/10.13005/ojc/330435
An excess amount of manganese is known to affect neurological toxicity. This study focused on adsorptive removal of Mn(II) using graphene oxide, whichwas carried out under optimum conditions after varying some experimental effects includingpH, anincubation time and aninitial concentration. It was demonstrated that Mn(II) adsorption follows both Langmuir and Freundlich isotherms. The maximum adsorption capacity for Mn(II) removal from an aqueous solution was 41.67 mg/g at pH 5 and their adsorption state was completed within 30 min. The adsorption kinetics was in accordance with pseudo second-order kinetic model. In thermodynamics diversion, changes in free energy, enthalpyand entropywere also studied.Overall, the adsorption process was exothermic and spontaneous in nature.
KEYWORDS:Graphene oxide; Manganese; Adsorption isotherm; Thermodynamics; Kinetics
Download this article as:| Copy the following to cite this article: Suddai A, Nuengmatcha P, Chanthai S. Adsorptive Removal of Manganese (II) from Aqueous Solutionusing Graphene Oxide: A Kinetics and Thermodynamics Study. Orient J Chem 2017;33(4). |
| Copy the following to cite this URL: Suddai A, Nuengmatcha P, Chanthai S. Adsorptive Removal of Manganese (II) from Aqueous Solutionusing Graphene Oxide: A Kinetics and Thermodynamics Study. Orient J Chem 2017;33(4). Available from: http://www.orientjchem.org/?p=34795 |
Introduction
Manganese (Mn) is an abundant element in the Earth’s crust and its presence in water is a result of leaching process.1 Although Mn is an essential nutrient element in living systems, an excess of Mn can result in toxic neurological effects, and there are many neurotoxic effects that cause a series of symptoms.2–4 Therefore, it is necessary to remove Mn(II) contaminants particularly from wastewater before it is releasedback to the environment.The adsorption process is one of the most promising for removal of metal ions. However, several carbon-based adsorbents for metal removal from wastewater are still limited in their use because of low efficiency and adsorption capacity. In order to improve capacity and selectivity of the adsorption, new adsorbents have been developed.Among these, graphene oxide (GO) is increasingly used as a new choice for carbon-based adsorbents. There are many applications of GO for removal from water samples of toxic metals and dye pollutants such as Hg(II),5Pb(II),6 As(V),7 Cd(II),8 Cr(VI),9Co(II),10 malachite green11and alizarin red S12.However, there have not been reports of its use on the removal of Mn(II) from aqueous solution.
In this study, GO was applied to remove Mn(II) from aqueous solution. Potential use of GO for Mn(II) removal in a batch adsorption study was compared with that of other carbon-based adsorbents. The effects of pH, an incubation time and an initial concentration of Mn(II) were optimized. Langmuir and Freundlich isotherms were also investigated in detail to fit its adsorption model. Bothkinetics and thermodynamicsaspects were also investigated to find out the adsorption behaviour for Mn(II) from aqueous solution.
Materials and Mathods
Preparation of Graphene Oxide
In this work, graphene oxide was prepared from commercial graphite following a protocol described in our previous work.13 Briefly, 3.0 g of graphite, 300 mL of 98% H2SO4, 23.0 g of KMnO4 and 3.0 g of NaNO3 were mixed under cold condition (0˚C) in an ice bath. After a 30-min stirring, a slow addition of 200 mL of deionized water to the mixture followed. The mixture was subject to another 30 min of stirring and then heated to 80˚C for 6 h before an addition of 40 mL of 30% H2O2. We used deionized water to wash the mixture several times until the filtrate pH reached neutral at which point lyophilized precipitates could be obtained.
Adsorption Experiment
The adsorption experiment of Mn(II) was performed using batch technique. Graphene oxide (0.02 g) was accurately weighed into a 125 mL conical flask followed by an addition of 25 mL of Mn(II) solution (10 mg/L). pH of the solution was adjusted. At room temperature (30˚C) and at approximately 200 rpm, the solution was subjected to shaking by an orbital shaker.To determine the optimum conditions for maximum adsorption capacity (qm) of GO, various experimental parameters were considered including pH of solution (1-6), an incubation time (1-50 min), and an initial concentration of Mn(II) (2-30 mg/L). After a period of shaking, we subjected the mixed solution to 5 min of centrifugation to separate the absorbent. AAS was used to determine Mn(II) in the supernatant solution. We conducted our all of our experiments in triplicate with the same experimental conditions. An equation below was used to determine the adsorption capacity (qe, mg/g) of Mn(II) at an equilibrium state,
where,Co, Ce, V and m are the initial Mn(II) concentration (mg/L) of the solution, Mn(II) concentration at the equilibrium state, the solution volume (L) and the adsorbent mass (g), respectively. To describe the equilibrium nature of Mn(II) adsorption onto the adsorbent, Langmuir and Freundlich adsorption models were also studied.
Results and Discussion
Optimum Conditions for Mn(II) Removal
Fig. 1(a) shows the effect of pH on the adsorption capacity.The pH value was adjusted by acetate buffer solution (pH 1-5) and phosphate buffer solution (pH 6). The results showedthat the adsorption capacity of Mn(II) dramatically increased with the solution at pH 1-4 and was constant in the pH range of 5-6. The maximum adsorption capacity was at pH 5 (3.14 mg/g). The pH value at the point of zero charge (pHPZC) of GO has been previously reported to be 4.111. At pH lower than pHPZC, the adsorption capacities of GO werelower due to the fact that under acidic solution, the surface GO surface was positively charged and did not favor an uptake of Mn(II). Whereas, at pH higher than pHPZC, the adsorbents’ surface became negatively charged facilitating the uptake of Mn(II). As a result, we found that we had the maximum adsorption capacity of GO at pH higher than 5.
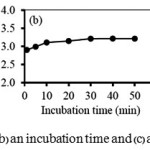
The effect of incubation time of Mn(II) adsorption onto the GOwith 10 mg/L of the initial Mn(II) concentration at pH 5 is shown in Figure 1(b).It can be well seen that at the beginning the rate of adsorption went up with increasing incubation time with equilibrium time observed within 30 min.We, therefore, subjected our further experiments with an incubation time of 30 min. Figure 1(c)shows the equilibrium adsorption capacity plotted against the initial concentration of Mn(II). It is demonstrated that the equilibrium adsorption capacity increased with increasing initial concentration. At Mn(II) concentration of 8 mg/L, the maximum equilibrium adsorption capacity of 20.03 mg/g was reached.Higher collision probability between Mn(II) and the adsorbent particles together with yet-to-be-occupied active sites on the GO surface likely contributed to the initial increase in the uptake capacity of GO when an initial Mn(II) concentration was increased.
 |
|
Thermodynamic Study
For thermodynamic study, the calculations of Gibbs free energy change (DGº), entropy change (DSº) and enthalpy change (DHº) were performed using the following equations:
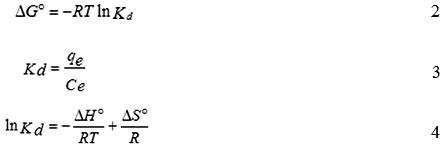
where,R is the constant (8.314 J/mol K), T is absolute temperature in K and Kdis the equilibrium constant. qe is the amount of the Mn(II) at equilibrium (mg/g), Ce is the equilibrium concentration (mg/L) ofMn(II) in the solution.
The slope and the intercept of the van’t Hoff plot of lnKdversus 1/T, were used for the calculation of ΔSº and ΔHº, respectively (Fig. 2). Table 1 summarizes the thermodynamic data.
Table 1: Thermodynamic data of Mn(II) adsorption using GO as an adsorbent.
| ΔHº (kJ/mol) | ΔSº (kJ/mol.K) | ΔGº (kJ/mol) | R2 | |||
| 303 K | 313 K | 323 K | 333 K | |||
| -8.08 | -7.03 | -23.69 | -23.30 | -24.17 | -25.01 | 0.8040 |
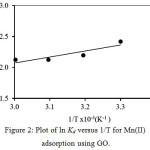 |
Figure 2: Plot of lnKdversus 1/T forMn(II) Click here to View figure |
Adsorption Using GO.
From Table 1,the negative value of ΔGº indicates that the ongoing adsorption process is spontaneous14. The negative ΔHº indicates that the adsorption of the metal by GO is exothermic in nature; while, the negative value of ΔSº indicates that during adsorption there is a tendency for lower disorder at the solid-solution interface15. The boundary layer becomes thinner at higher temperatures because metal molecules tend to escape from the adsorbent surface to its bulk solution, lowering the adsorption capacity when the temperature goes up16.
Kinetic Study
To understand the nature of the adsorption phenomenon in terms of the order of the rate constant, three kinetic models were applied including pseudo-first order, pseudo-second-order and intra-particle diffusion model. These modelsare expressed in the following equations (Eq. (5) to Eq. (7).
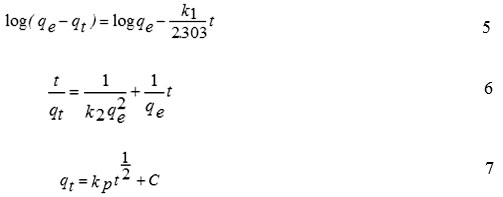
where, k1 is rate constant (L/min) of pseudo-first order adsorption, k2is rate constant of pseudo-second-order adsorption (g/mg min), kp is an intra-particle diffusion rate constant in mg/(g min1/2) qeand qt are the amounts of Mn(II) adsorbed onto GO at an equilibrium state (mg/g) and at time t, respectively.
For the pseudo-first order, we calculated the values of k1and qe from the slope and the intercept of the plot of log (qe–qt) versus t, respectively (Fig. 3(a));while, the values of k2 and qe for the pseudo-second-order adsorption are calculated from the slope and the intercept of the plot of t/qt versus t, respectively (Fig. 3(b). In addition, the values of kpand C of the intra-particle diffusion were based on the calculation from the slope and the intercept of the plot of qt versus t1/2, respectively (Fig. 3(c)). The kinetic parameters obtained from these models are summarized in Table 2.
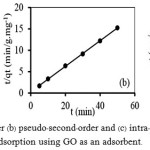 |
Figure 3a: pseudo–first–order (b) pseudo–second–order and (c) intra–particle diffusion of Mn(II) adsorption using GO as an adsorbent. |
Table 2: The kinetic parameters of Mn(II) adsorption using GO.
| qe,exp(mg/g) | Pseudo-first order | Pseudo-second order | Intra-particle diffusion | |||
| 3.28 | qe(mg/g) | 1.09 | qe(mg/g) | 3.33 | kp(mg/g.min1/2) | 0.11 |
| k1 (min) | 0.15 | k2 (g/mg.min) | 0.38 | C (mg/g) | 2.65 | |
| R2 | 0.9936 | R2 | 0.9999 | R2 | 0.9915 | |
As shown in Table 2, the pseudo-first order kinetic model could not explain the adsorption of Mn(II) using GO, as there was a great difference between the value from the calculation of maximum adsorption capacity (qe= 1.09 mg/g) and that from the experiment (qe,exp = 3.28 mg/g).On the contrary, the calculated qe value for the pseudo-second order kinetic model (3.33 mg/g) was similar to that from the experiment with high linear correlation coefficient (R2) of 0.9999. Therefore, the pseudo-second-order kinetic model was applicable tothe adsorption of Mn(II).
Adsorption Isotherm
Langmuir and Freundlich models are used to describe the adsorption isotherms.The Langmuir model assumes that an adsorbate’s monolayer coversa homogenous adsorbent surface which has a finite number of the adsorption sites via uniform strategies of adsorption without any transmigration of the adsorbateoccurring along the surface plane.The Freundlich adsorption isotherm assumes a heterogeneous surface energy for which the energy term in the Langmuir equation varies as a function of a surface coverage. The linear form of both Langmuir and Freundlichisotherms are given by the following Eq. (8) and Eq. (9):
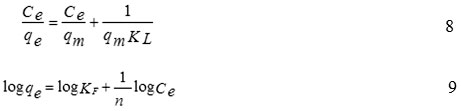
where,qmis the maximum amount of Mn(II) absorbed per unit weight of adsorbent (mg/g) that forms complete monolayer on the surface at the equilibrium state of metal concentration (mg/L), qe is the amount of Mn(II) adsorbed per unit weight of adsorbent at equilibrium, and KLis the Langmuir constant (L/mg), KFand n are the Freundlich constant and the intensity of adsorption,respectively.
The values of qmand KLare calculated from the slope and the intercept of the straight line plot of Ce/qe versus Ce, respectively (Fig. 4(a)).The values of KF and 1/n can be obtained from a linear plot of log qe versus log Ce (Fig.4(b)). Table 3 shows the constant values that are obtained from the Langmuir and Freundlich adsorption isotherms and their correlation coefficients (R2)
Table 3: Isotherm parameters and correlation coefficients calculated for the adsorption of Mn(II) using GO.
| Adsorbent | Langmuir isotherm | Freundlich isotherm | |||||
| qmax(mg/g) | KL | R2 | KF | 1/n | R2 | ||
| Graphene oxide | 41.67 | 0.02 | 0.9765 | 2.99 | 0.88 | 0.8773 | |
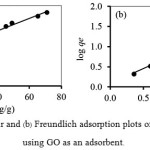 |
Figure 4a: Langmuir and (b)Freundlich adsorption plots of Mn(II) adsorption using GO as an adsorbent. |
From Table 3, it was found that Langmuir isotherm (R2> 0.97) fitted with the experimental results better than those of Freundlich isotherm (R2> 0.87). This indicates that there is a high degree of homogeneity on the GO surface with monolayer coverage of Mn(II) on it. The maximum adsorption capacity of Mn(II) was found to be 41.67 mg/g.
Table 4 shows the maximum adsorption capacity of Mn(II)using other adsorbents.In comparison with other carbon-based adsorbents, GO has by far the highest adsorption capacity for the Mn(II) removal from aqueous solution.
Table 4: Comparison of maximum adsorption capacities of Mn(II) using various carbon-based adsorbents
| Adsorbent | qm(mg/g) | Reference |
| Na-montmorillonite | 3.22 | [17] |
| Granular activated carbon | 2.54 | [18] |
| Dolomite | 2.21 | [19] |
| Activated carbon immobilized by tannic acid | 1.73 | [20] |
| Marble | 1.20 | [19] |
| Pithacelobiumdulce carbon | 0.41 | [21] |
| Graphene oxide | 41.67 | This work |
Conclusion
The results indicate the suitability and efficiency of graphene oxide as an adsorbent for the removal of Mn(II) from aqueous solution. With maximum adsorption capacity for Mn(II) being 41.67 mg/g, it far outstrips other carbon-based adsorbents. The pseudo second-order kinetic model was applicable to the adsorption kinetics..The intra-particle diffusion model described that the intra-particle diffusion was not the only rate-limiting step, but surface adsorption and intra-particle diffusion mechanisms worked in simultaneous corporation during adsorption. DG˚ indicates the spontaneity of the ongoing adsorption process; while,DS˚ indicates a tendency to lower disorder at the solid-solution interface during the adsorption. In addition, theDH˚ indicates that the adsorption process is an exothermic nature. Our experiments clearly showed that the as-prepared GO has a high potential as adsorbent forMn(II) removal.
Acknowledgements
This research study was financially supported by Materials Chemistry Research Center, Department of Chemistry and Center of Excellence for Innovation in Chemistry (PERCH-CIC), Faculty of Science, KhonKaen University,and the Ministry of Science and Technology, Bangkok, Thailand.
References
- Ates,A. Powder Technol.2014,264, 86-95.
CrossRef - Flynn, MR.; Susi,P. Int. J. Hyg. Environ Health. 2009, 212, 459-469.
CrossRef - Michalke, B.; Fernsebner, K. J. Trace Elem. Med. Biol. 2014, 28, 106-116.
CrossRef - Dusek, P.; Roos, P.M.; Litwin, T.; Schneider, S.A.; Flaten, T.P.; Aaseth, J. J. Trace Elem. Med. Biol. 2015,31, 193-203.
CrossRef - Nuengmatcha, P.; Mahachai, R.; Chanthai, S. Asian. J. Chem. 2014, 26, S85-S88.
CrossRef - Madadrang, C.J; Kim, H.Y.; Gao, G.; Wang, N.; Zhu, J.; Feng, H.; Gorring, M.; Kasner, M.L.; Hou, S.ACS Appl. Mater. Interfaces.2012, 4, 1186-1193.
CrossRef - Zhang, K.; Dwivedi, V.; Chi, C.; Wu, J. J. Hazard. Mater.2010, 182, 162-168.
CrossRef - Deng, J.H.; Zhang, X.R.; Zeng, G.M.; Gong, J.L.; Niu, Q.Y.; Liang, J. Chem. Eng. J.2013, 266, 189-200.
CrossRef - Li, L.; Fan, L.; Sun, M.; Qiu, H.; Li, X.; Duan, H.; Luo, C. Colloids Surf., B2013, 107, 76-83.
CrossRef - Zhao, G.; Li, J.; Ren, X.; Chen, C.; Wang, X. Environ. Sci. Technol.2011, 45, 10454-10462.
CrossRef - Nuengmatcha, P.; Mahachai, R.; Chanthai, S. Orient. J. Chem.2014, 30, 1463-1474.
CrossRef - Nuengmatcha, P. ;Mahachai, R.; Chanthai, S. Orient. J. Chem.2016, 32, 1399-1410.
CrossRef - Nuengmatcha, P.; Mahachai, R.; Chanthai, S. Asian. J. Chem.2014, 26, 1321-1323.
CrossRef - Haghdoost, G. Orient. J. Chem.2016, 32(3), 1485-1492.
CrossRef - Hadavifar, M.; Bahramifar, N.; Younesi, H.; Li, Q. Chem. Eng. J. 2014, 237, 217-228.
CrossRef - Saha, P.; Chowdhury, S.; Gupta, S.; Kumar, I. Chem. Eng. J. 2010, 165, 874-882.
CrossRef - Abollino, O.; Aceto, M.; Malandrino, M.; Sarzanini, C.; Mentasti, E. Water Res.2003, 37, 1619-1627.
CrossRef - Jusoh, A.B.; Cheng, W.H.; Low, W.M.; Nora’aini, A.; Noor, M.J.M.M. Desalination.2005, 182, 347-353.
CrossRef - Kroik, A.A.; Shramko, O.N.; Belous, N.V. Chem. Technol. Water. 1999, 21, 310-314.
- çer, A.Ȕ.; Uyanik, A.; Aygün, S.F. Sep. Purif. Technol.2006, 47, 113-118.
- Emmanuela, K.A.; VeerabhadraRao, A. Rasayan J. Chem.2008, 1, 840-852.

This work is licensed under a Creative Commons Attribution 4.0 International License.
![]()
A New Edition of Web of Science
Journal Impact Factor
2022: 0.5
Five Year: 0.8
Journal is Indexed in

Cabells Whitelist
![]()


