A Novel Stability Indicating Rp-Uplc-Dad Method for Determination of Metformin and Empagliflozin in Bulk and Tablet Dosage Form
Nenavath Padmaja1 and Guttena Veerabhadram2
1Department of pharmacy, University College of Technology, Osmania University, Hyderabad-500007, India.
2Department of chemistry, University College of Science,Osmaina University, Hyderabad-500007, India.
Corresponding Author E-mail: gvbhadram@gmail.com
DOI : http://dx.doi.org/10.13005/ojc/330441
The objective of the present work was to develop and validate a novel stability indicating RP-UPLC-DAD method for the simultaneous analysis of Metformin and Empagliflozin in bulk and tablet dosage form. This new RP-UPLC method has superior in technology to formal Reverse phase-HPLC with retention time, solvent utilization, resolution and less cost. The peak area separation was accomplished on a Waters model UPLC system equipped with PDA detector and autosampler. A volume of 5 µL of sample and standard were injected into the column and all analytes were separated by using the mobile phase contains mixture 0.1% ortho phosphoric acid buffer (the pH was adjusted to 3.4 with 0.1 N NaOH) and methanol in the ratio 40:60% v/v at a flow rate of 0.25ml/min through C18 BEH(Ethylene Bridged Hybrid) UPLC (100mm x 2.1mm ,1.8µm) at 350C column temperature and the detector wavelength was set at 254 nm. The system suitable parameters such as tailing factor , resolution and plate count of two drugs were 1.16 , 1.37 ;3.47 ;2314.34 and 4723 respectively. Retention time and peak area and of Metformin and Empagliflozin were found to be 0.882 & 3.471, 4887835 &163463 respectively. Regression equation shows an r value (correlation coefficient) of greater than 0.999 for Metformin and Empagliflozin. Percent recovery of Metformin and Empagliflozin was found to be 99.92%-100.12% & 100.12%-100.56% respectively .Both Metformin and Empagliflozin were subjected to stress conditions such as acidic, basic, oxidative, thermal and photo degradation butsubstantial degradation was observed in acid studies. The newly developed RP-UPLC-DAD chromatographicmethod was validated with regard of system suitability, linearity, robustness, accuracy, LOD,precision and LOQ.
KEYWORDS:Empagliflozin; Metformin; RP-UPLC; Stressstudies; Validation
Download this article as:| Copy the following to cite this article: Padmaja N, Veerabhadram G. A Novel Stability Indicating Rp-Uplc-Dad Method for Determination of Metformin and Empagliflozin in Bulk and Tablet Dosage Form. Orient J Chem 2017;33(4). |
| Copy the following to cite this URL: Padmaja N, Veerabhadram G. A Novel Stability Indicating Rp-Uplc-Dad Method for Determination of Metformin and Empagliflozin in Bulk and Tablet Dosage Form. Orient J Chem 2017;33(4). Available from: http://www.orientjchem.org/?p=34624 |
Introduction
Metformin is now established as a first choice drug for all type 2 diabetes mellitus patients, except when not tolerated or contraindicated it suppress hepatic gluconeogenesis and glucose output from liver. This is the major action responsible for lowering of blood glucose in diabetics. Enhance insulin mediated glucose uptake and disposal in skeletal muscle and fat. Insulin resistance exhibited by type II diabetics is thus overcome 1-2.Worldwide most of the patients with type II diabetes mellitus are commonly accomplished with a singular-agent therapy, generally metformin and it is a good and most commonly used antihyperglycemic agent which enhance the glucose margin in type 2 diabetes patients, lowering both postprandial and basal plasma glucose.Metformin molecular formula C4H11N5. HCl was and molecular weight 165.62 3-6 it is a white crystalline compound ,Structure of Metformin shown in Fig 1.
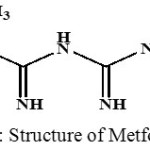 |
Figure 1: Structure of Metformin |
Practically all the glucose particles filtered at the glomerulus and it is reabsorbed in the proximal tubules The major transporter which accomplishes this is sodium glucose cotransporter-2 ,whose inhibition induces glycosuria and lowers blood glucose in type 2 DM, as well as causes weight loss. This SGLT-2 inhibitor Empagliflozin has been recently tested in type 2 DM patients .After single daily dose it lowers blood glucose levels 7-9.
Empagliflozin chemically, n-Glucitol, 1, 5-anhydro-1-C-[4-chloro-3- [[4-[[(3S)-tetrahydro-3-furanyl] oxy] phenyl] methyl] phenyl]-, (1S) .SGLT2 was highly stated in kidney .Empagliflozin plays an important role in good transporter and the reabsorption of glucose from the glomerular filtrate sent back into the circulation 10-11. Structure of Empagliflozin was shown in Fig 2.
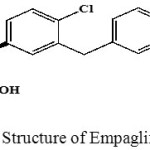 |
Figure 2: Structure of Empagliflozin |
Fast estimation ofMetformin and Empagliflozin in with more difference in label claims (Empagliflozin for 5 mg and Metformin for 500 mg) with short run time is a good challenge. For UPLC based analysis , the method of decreasing assays time effectively while resolving analytes from degraded products is often attained with column with small particles.
Literature survey brings out that Empagliflozin is determined by UV spectrophotometric method 12-14, RP-HPLC method 15-18, very less chromatographic methods were available for simultaneous determination of Metformin and Empagliflozin in bulk and tablet dosage form by using RP-HPLC 19-24, UPLC 25.
The analytical method development and validation of Metformin and Empagliflozinusing Gas liquid /Mass spectrometry and Liquid chromatography /Mass spectrometry were expensive and very delicate methods as compared with the UPLC for general analysis, hence it needs to use this UPLC –DAD technique for determination of stability studies by using RP-UPLC-DAD method Metformin and Empagliflozin in bulk and tablet dosage form.
Experimental
Chemicals and Reagents
Qualified Empagliflozin standard was kindly obtained by Manus akkteva (Ahmadabad, Gujarat, India). Metformin was kindly obtained by Aurobindo pharmaceuticals Ltd. (Hyderabad, Telengana, India). Synjardy® (Empagliflozin -5mg and Metformin-500 mg) (USA) were purchased from local market. Orthophosphoric acid AR grade was purchased from Merck (Darmstadit, Germany). HPLC grade solvent methanol was obtained from JVR fine chemicals ltd ( Hyderabad,Telengana, India).Millipore -Q ® type 1 ultrapure water system (Sartorius, Germany), vacuum pump was purchased from PCI Analytics Pvt,Ltd (Mumbai, India) were also used.
Instrumentation and Equipments
The UPLC waters system was used for the stability indicating method development and method validation .It consists of binary solvent manager with connected with photo diode array detector (MA,USA) controlled with Empower software and auto sampler and auto injector.C18 BEH (Ethylene Bridged Hybrid) UPLC (100mm x 2.1mm ,1.7µm) column was used from waters. Photo stability studies were performed in photo stability chamber (Osworld scientific equipment pvt.Ltd, Mumbai, India). Thermal stability studies were carried out in a dry air oven (Newtronic life care, Mumbai, India).
Solution Preparations
Preparation of Mobile Phase
0.1% ortho phosphoric acid buffer solution was accurately prepared by taking 1 ml ortho phosphoric acid in 1000 ml volumetric flask and dissolved it in water then made up to the mark by adjust the pH of solution to pH =3.4 with 0.1 N NaOH solution. Then filtered the resulting solution through 0.45µ filter under vacuum filtration.Mixture of ortho phosphoric acid buffer and methanol in the ratio 40:60% v/v was taken in a flask, degassed in ultrasonic water bath for 5 minutes allowed to cool at room temperature and then filtered through 0.45 µ filter under vacuum filtration. This prepared mobile phase was used as diluent.
Preparation of Standard Solution
Weighe accurately and transfer 100 mg Metformin and 10 mg Empagliflozin working standard into a 10 ml clean dry volumetric flask and add about 7 ml of and sonicated to dissolve it totally and make up the volume to the up mark with the diluent. (Stock solution).After that pipette out 0.3 ml of the above solutions into a 10ml dry volumetric flask and dilute up to the mark with diluent.
Preparation of Sample Solution
Weighe accurately 10 tablets crush in mortar and pestle and transfer equivalent to 500mg Metformin and 5mg Empagliflozin sample into a 10 ml clean dry volumetric flask add about 7 ml of diluent and sonicated it up to 30 mins to dissolve it completely and make up the volume up to the mark with with the diluent. Then it is filtered through 0.44 micron injection filter. After that pipette out 0.3 ml of Metformin and Empagliflozin from the above stock solution into a 10ml dry volumetric flask and dilute up to the mark with diluent and inject 5 mL of the standard and sample into the RP-UPLC system.
Chromatographic Conditions
Chromatographic column used was C18 BEH UPLC, 100mm x 2.1mm with particles 1.8µm. The mobile phase consist of mixture of 0.1% ortho phosphoric acid buffer and methanol in the ratio 40:60% v/v with a flow rate of 0.25ml/min, monitored at a wavelength of 254 nm and it maintained at 350C with a injection volumeof 5µl.
Method validation
System suitability Parameters
A system suitability test method was expressed based on the parameters results obtained in different chromatograms. The concentration of standard solution was 300 µg/ml for Metformin and 30 µg/ml for Empagliflozin respectively. The efficiency of column resolute from the analyte peak >20, 000, the tailing factor <5.0% and resolution between peaks of two drugs should be >1.5.
Precision
Precision was evaluated by studying the intermediate precision and repeatability . Precision of each sample was determined by six replicate injections at a concentration of 100µg/ml of Metformin and 10 µg/ml of Empagliflozin respectively.
Accuracy
To evaluate the accuracy of proposed method, recovery studies were conducted, it is determined in three times at three different levels of concentration i.e. 80%, 100%, 120% in tablet dosage and bulk form.
Linearity
The linearity of analytical method was determined by measuring different concentrations of standard solutions to Metformin (25-125µg/ml) and Empagliflozin (15-75µg/ml).The calibration curve was obtained by plotting concentration of sample solutions on X-axis and and mean peak areas on Y-axis.
Sensitivity
Sensitivity of the proposed analytical method was determined in terms of limit of limit of quantitation (LOQ) and detection (LOD). LOQ =10×ASD/S and LOD=3.3×ASD/S .In order to determine both parameters, concentration in the lower part of the linear range of calibration curve were used.
Robustness
The robustness method measures the method capability to it will not affected by very small, but if any deliberate changes in optimized chromatographic conditions was examined by testing influence of small deliberate changes in , change in mobile phase composition (90% to 110%), flow rate (± 0.2 ml/min), column temperature (±5°C) using 100µg/ml Metformin and 10 µg/ml Empagliflozin.
Stability Studies
In this stability studies , Metformin and Empagliflozinwere exposed to different chemical and physical degradation conditions such as 0.1 N HCl (acid degradation),0.1% N NaoH (base degradation), 30% H2O2 (oxidative degradation),heat (thermal degradation) and Ultra violet light (radiation decay) for defined time intevels ,and then diluted similar as standard stock dilution, and then repragentative chromatograms were obtained .The percentage of degradation compounds were calculated from the peak areas of the Metformin and Empagliflozinchromatograms. In the study of base or acid degradation, an amount of equivalent to powdered sample to 100mg Metformin and 10 mg Empagliflozin was transferred into 10 ml dry volumetric flask and add 3 ml of freshly prepared 0.1 N NaOH or 0.1N HCl .then shaken well and allowed for 24 hours at a temperature of 60°C.Then filtered the totel solution through 0.45µ filter into 10 ml standard flasks and neutralized the un reacted acid or base i.e 0.1 N HCl or 0.1N NaOH and made up to the mark. In case of oxidative degradation same amount of sample was transferred into 10 ml volumetric flask, add 3 ml of freshly prepared 30% H2O2 and kept at 75°C for 48 hours and filtered the totel solution through 0.45µ filter and made up to the mark. In the study of thermal decay or Ultra violet light -light degradation ,precisely same quantity of sample was transferred into clean and dry watch glass,placed in an hot air oven at 110°C .In the study of photo degradation precisely same amount of sample was transferred into 10 ml volumetric flask kept at sunlight for 48 hours and then made up to the mark with diluents.
Results and Discussion
Uplc Method Development
UPLC is a new analytical technique used for determination of pharmaceutical formulations and separations mostly in combined drugs and dosage forms .The main plan of this work was to develop a novel stability indicating RP-UPLC method for estimation of Metformin and Empagliflozin. Initial trails were conducted during UPLC method development for optimizing different parameters on the system suitability of the method.
After trying different columns like, cyano, PFP, C8 the last chance of the stationary phase that gave a good resolution and eluting all peaks with better separation was reverse phase C18 BEH UPLC (100mm x 2.1mm 1.8µm particle size) column, this column was only showing retention time less than 1.5 minutes. The the organic solvents acetonitrile and methanol were tried for analytical method development. Compare with acetonitrile, methanol was showing good peak separations and less column back pressure. As we need to analysis of compounds, tried with different mobile phases like phosphate buffer, formic acid, trifloroacetic acid ortho phosphoric acid. In acid hydrolysis drugs were showing good peak separation and shape .Finally the good results were obtained by use of mixture of 0.1% ortho phosphoric acid (pHof the buffer adjusted to 3.4 with 0.1 N NaOH) and methanol in the ratio 40:60% v/v at a flow rate of 0.25ml/min through C18 BEH(Ethylene Bridged Hybrid) UPLC (100mm x 2.1mm, 1.8µm) at 350C column temperature and the detector wavelength was set at 254 nm. Under the optimum chromatographic conditions, the retention times obtained for Metformin and Empagliflozin were 0.882 and 3.471 min, respectively. Optimized standard chromatogram for Metformin and Empagliflozin were expressed in figure 3.
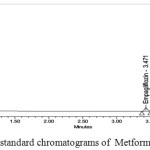 |
Figure 3: Optimized standard chromatograms of Metformin and Empagliflozin Click here to View figure |
Method Validation
System Suitability
System suitability parameters such as resolution,tailing factor, plate count and resolution for two drugs were found to be 3.47; 1.16 and 1.37 ;2314.34 and 4723 respectively. Peak area and retention time of Metformin and Empagliflozin were found to be 4887835 & 163463, 0.882 & 3.471 respectively. The results of system suitability were expressed in Table 1.
Table 1: System suitability results of Metformin and Empagliflozin
| S. no | Retention time | Peak area | USP plate count | USP tailing | Resolution |
| Metformin | 0.882 | 4887835 | 2314.34 | 1.16 | 3.471 |
| 0.888 | 4877016 | 2213.15 | 1.19 | 3.472 | |
| 0.885 | 4854854 | 2330.21 | 1.18 | 3.475 | |
| 0.889 | 4870934 | 2332.58 | 1.15 | 3.476 | |
| 0.895 | 4866954 | 2256.65 | 1.17 | 3.474 | |
| 0.889 | 4850952 | 2254.32 | 1.16 | 3.472 | |
| Mean | 4868090 | ||||
| S.D | 13768.2 | ||||
| % RSD | 0.28 | ||||
| Empagliflozin | |||||
| 3.471 | 163463 | 4723.0 | 1.36 | ||
| 3.472 | 162404 | 4277.64 | 1.37 | ||
| 3.475 | 156082 | 4463.81 | 1.36 | ||
| 3.476 | 162766 | 4655.72 | 1.37 | ||
| 3.474 | 166211 | 4682.24 | 1.36 | ||
| 3.472 | 159403 | 4407.81 | 1.36 | ||
| Mean | 161721.5 | ||||
| S.D | 3519.3 | ||||
| % RSD | 0.7 |
Precision
For repeatability and intermediate precision assessment, %RSD was calculated. All the samples exhibited RSD values < 2 % confirming that the analytical method was precise. The results of precision were expressed in Table 2.
Table 2: Precision study of Metformin and Empagliflozin
| Name of drug | Amount applied (µg/ml) | Repeatability (Mean peak area ± S.D) | % RSD | Intermediate precision (Mean peak area ±S.D) | % RSD |
| Metformin | 15 | 2304436.5 ± 41123.20 | 1.78 | 2304526.5 ± 41137.30 | 1.78 |
| 30 | 2304436.5 ± 39708.99 | 1.72 | 2304576.5 ± 41208.06 | 1.78 | |
| 45 | 2309936.5 ± 46072.95 | 1.99 | 2305076.5 ± 40500.90 | 1.75 | |
| Empagliflozin | 25 | 92605.0 ± 711.3 | 0.76 | 92563.5 ± 639.3 | 0.69 |
| 50 | 92605.5 ± 713.4 | 1.16 | 92613.5 ± 569.2 | 0.61 | |
| 75 | 92613.5 ± 710.6 | 1.18 | 92663.5 ± 639.9 | 0.69 |
Accuracy
The acceptable percentage recovery of Metformin and Empagliflozin in bulk and tablet dosage form ranged from 99.92%-100.12 % and 100.14%-100.56 % respectively. The results are tabulated in Table 3.
Table 3: Percentage recovery of Metformin and Empagliflozin
|
Name of drug |
Spiked level (%) |
Amount added |
Amount recovered |
% Recovery |
% RSD |
|
Metformin |
80 |
48.51 |
49.08 |
100.12 |
0.42 |
|
100 |
98.5 |
99.02 |
100.06 |
0.34 |
|
|
120 |
147.1 |
148.32 |
99.92 |
0.76 |
|
|
Empagliflozin |
50 |
4.62 |
4.95 |
100.14 |
0.39 |
|
100 |
9.82 |
9.94 |
100.56 |
0.68 |
|
|
150 |
14.24 |
14.56 |
100.36 |
0.82 |
Linearity
The linear regression equation and correlation (r) for Metformin and Empagliflozin were y = 53124x + 443856, 0.999 and y = 4170.1x + 39780, 0.999 respectively.Linerity curve of both drugs were expressed in Table 4, Fig 4 and 5.
Table 4: Linearity data of Metformin and Empagliflozin
| S.no | Metformin Concentration(µg/ml) | Peak area | Empagliflozin Concentration(µg/ml) | Peak area |
| 1 | 25 | 1737618 | 15 | 99860 |
| 2 | 50 | 3100784 | 30 | 166350 |
| 3 | 75 | 4447974 | 45 | 230484 |
| 4 | 100 | 5851768 | 60 | 289354 |
| 5 | 125 | 7002620 | 75 | 351112 |
| Slope | 53124 | 4170.1 | ||
| Y-intercept | 443856 | 39780 | ||
| Correlation coefficient | 0.999 | 0.999 | ||
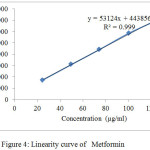 |
Figure 4: Linearity curve of Metformin |
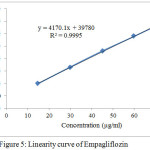 |
Figur 5: Linearity curve of Empagliflozin
|
Sensitivity
The limit of detection and limit of quantification of Metformin and Empagliflozinwere found to be 0.072µg/ml,0.330 µg/ml and 0.016 µg/ml, 0.964 µg/ml, respectively.
Robustness
Robustness of the method was expressed by % RSD values of Metformin and Empagliflozin peak areas as quantitative responses. All values were found to be less than 2%, indicates that method was robust. Results are shown in table 5.
Table 5: Robustness of Metformin and Empagliflozin
|
S.no |
Metformin peak area |
Metformin %RSD |
Metformin USP plate count |
Empagliflozin Peak area |
Empagliflozin % RSD |
Empagliflozin USP plate count |
|
Flow rate 0.80 |
486988.5 ± 631.4 |
0.12 |
2213.24 |
226543 ± 2626 |
1.15 |
3711 |
|
1.00 |
486938.5 ± 702.1 |
0.14
|
2219.12 |
227543 ± 1211 |
0.53 |
3725 |
|
1.20 |
487888.5±782.7 |
0.16
|
2268.32 |
226635 ± 2919 |
1.28 |
3752 |
|
Mobile phase composition |
||||||
|
30:70 |
487943.5 ± 704.9 |
0.14 |
2316.2 |
227600 ± 1979 |
0.86 |
3893 |
|
40:60 |
488048.5 ± 853.4 |
0.17 |
2321.0 |
227100 ± 1272 |
0.56 |
3819 |
|
50:50 |
487888.5 ± 782.7 |
0.16 |
2372.2 |
226100 ± 2687 |
1.18 |
3833 |
|
Column temperature |
||||||
|
30°C |
478048.5 ± 853 |
0.17 |
2318.3 |
226600 ± 1979 |
0.87 |
3963 |
|
35°C |
477548.5 ± 1560 |
0.32 |
2324.1 |
227635 ± 1505 |
0.66 |
3890 |
|
45°C |
475548.5 ± 1267 |
0.26 |
2352.3 |
226377 ± 1665 |
0.73 |
3933 |
Stability Studies
Degraded products were not found in oxidative, photolytic ,thermal condition which confirms that Metformin and Empagliflozin were stable to oxidative, photolytic ,thermal conditions. The drugs were found to be liable to acid, base hydrolysis as a total of 9.55, 9.22 & 8.98, 7.88 degradation was found respectively. Degradation details were expressed in table 6. Acid, base, oxidative, thermal, photolytic chromatograms were shown in figures 6-10.
Table 6: Degradation results of Metformin and Empagliflozin
|
S.no |
Metformin area |
Metformin % degraded |
Metformin % recovery |
Empagliflozin area |
Empagliflozin % degraded |
Empagliflozin % recovery |
|
Acid degradation |
8490245 |
90.45 |
9.55 |
659212 |
90.78 |
9.22 |
|
Base degradation |
6413362 |
91.02 |
8.98 |
413095 |
92.12 |
7.88 |
|
Peroxide degradation |
29871421 |
96.45 |
3.55 |
453286 |
95.21 |
4.79 |
|
Thermal degradation |
8123070 |
96.53 |
3.47 |
328834 |
96.18 |
3.82 |
|
Photo degradation |
8232042 |
96.82 |
3.18 |
432872 |
96.45 |
3.55 |
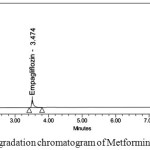 |
Figure 6: Acid degradation chromatogram of Metformin and Empagliflozin |
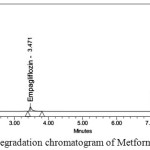 |
Figure 7: Base degradation chromatogram of Metformin and Empagliflozin
|
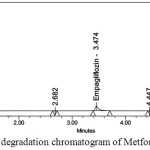 |
Figure 8: Oxidative degradation chromatogram of Metformin and Empagliflozin |
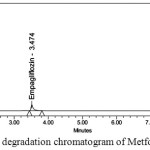 |
Figure 9: Thermal degradation chromatogram of Metformin and Empagliflozin
|
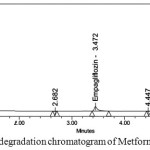 |
Figure 10: Photo degradation chromatogram of Metformin and Empagliflozin |
Conclusion
The proposed novel stability indicating isocratic RP-UPLC-DAD method was developed and validated for determination of Metformin and Empagliflozin in bulk and tablet dosage .Validation proves that the proposed method is good and satisfactory for determination of Metformin and Empagliflozin in tablet dosage and bulk form for accuracy, specificity, LOQ, LOD, precision, linearity and robustness. The proposed method is reliable ,simple, economical and adequate for use in routine drug quality control analysis in laboratories and pharmaceutical industry. Stability studies were done to assess the stability of compound and prove the stability indicating nature of developed RP-UPLC method.
Acknowledgement
One of the authors (Padmaja. N) is thankful to RGNF for awarding Senior Research Fellowship and Head, Department of chemistry for providing the necessary facilities.
References
- www.drugbank.ca/drugs/DB00331.
- ShedonMarkosky. Centre for drug evaluation and research application No:2043530orig1s000.2014.http://www.accessdata.fda.gov/drugsatfdadocs/nda/2014/204353Orig1s000ChemR
- Assement report on international non-proprietary name: Empagliflozin / Metformin. European medicines agency.2015EMEA/H/C/003770/0000.
- R .,Jeyalalitha.International journal of basic and clinical pharmacology.2015,4(6),1323-1327.Doi: 10.18203/2319-2003.ijbcp20151382.
- Hassna,Osama. , Hoda ,Abd. ,Elbadie.Medicine science.2016,1,46-56.Doi: 10.5455/medscience.2015.04.8343.
- Neeta ,Bansal., Priyanka, Chaudhary. ,MonikaRamola.International journal of reproduction, contraception, obstetrics and gynaecology. 2016,5(12), 4356-4360.Doi: 10.18203/2320-1770.ijrcog20164342.
- https://www.drugbank.ca/drugs/DB09038.
- Gangadharan ,Komala, M., Mather, A. Expert review of clinical pharmacology.2014, 7,271-279.Doi: 10.1586/17512433.2014.908703.
- Neumiller ,J, J. Drugs contex.t 2014,3,212-262. Doi: 10.7573/dic.212262.
- Haring , HU., Merker, L. , Seewaldt-Becker, E. Diabetes care.2014, 37, 1650-9. Doi: 10.2337/dc13-2105.
- FDA approves type 2 Diabetes drug from BoehringerIngelheim and Lilly .2011. http://www.genengnews.com/gen-news-highlights/fda-approves-type-2-diabetes-drug-from-boehringer-ingelheim-and-lilly/81245092.
- Jyothirmai ,N., Anil Kumar, M., Nagaraju, B. Journal de afrikana. 2016, 3(1), 177-187.
- Bassam, M, Ayoub .Molecular and bio molecular Spectroscopy .2016, 168, 118–122.
- N ,Padmaja., Mulagiri ,Sharath ,Babu., G, Veerabhadram. Der pharmacialettre. 2016, 8, 207-213
- Shyamala ,K., Nirmala, J.,Mounika ,B., Nandini. Der pharmalettere .2016,2, 457-464.
- Padmaja, N., Veerabhadram ,G. International journal of pharmaceutical science and research .2016,7,724-727.
- Shyamala ,M., Mounika, E., Sangeetha. Pharmanest. 2016, 7(1),3040-3042.
- N, Padmaja., G ,Veerabhadram. International journal of pharmaceutical sciences and research .2016,7 (11), 1000-08.
- Geetha, Swarupa.,Lakshmana, Rao ., Suresh babu. Asian j pharm clin res.2016, 9,126-135.
- N, Padmaja.,Mulagiri, Sharath, Babu., G ,Veerabhadram. Journal de afrikana.2016, 3, 314-328.
- Shaik ,Mahammad. ,Noorulla ., Sadath ,Ali. International journal of engineering technology and sciences.2015, 2, 66-71.
- Suresh, B,K., Geetha ,S, P., Lakshmana ,R,K., Prasad ,K ,R ,S. Asian j pharm clin res 2016,9,126-135.
- C, Rupasi, Pratyusha., M , BhagavanRaju . International journal of pharmacy. 2016,6(4),138-147.
- B ,JaffarHussain., C, Karuppasamy. ,Y, Suresh. Asian journal of research in chemistry and pharmaceutical sciences. 2016,4(3),91-100.
- Bassam ,m,Ayoub. Rscadv.2015,5, 703-709.doi: 10.1039/c5ra17231d.

This work is licensed under a Creative Commons Attribution 4.0 International License.
![]()
A New Edition of Web of Science
Journal Impact Factor
2022: 0.5
Five Year: 0.8
Journal is Indexed in

Cabells Whitelist
![]()


